Download to read offline


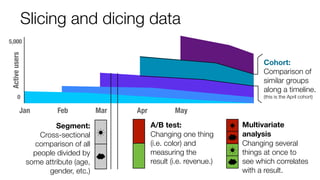

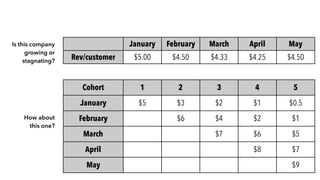
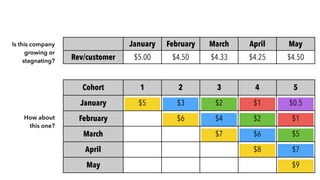
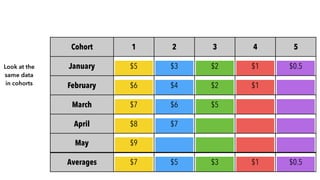
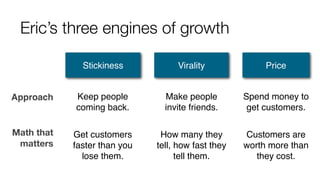
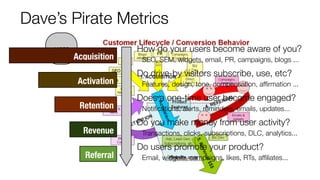


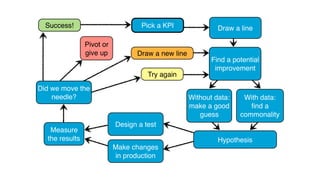

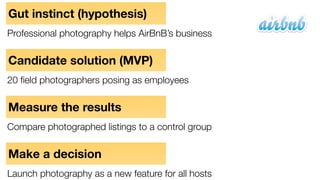


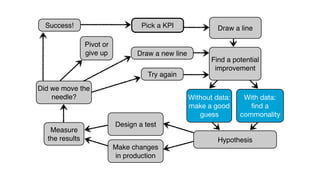
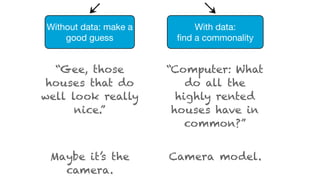


The document discusses lean analytics within the context of startups, emphasizing the importance of data-driven decision-making to achieve product/market fit. It covers various metrics and analytical methods, such as A/B testing and cohort analysis, which can inform strategies for customer acquisition, retention, and revenue generation. Additionally, it highlights the significance of identifying a single key performance indicator (KPI) to maintain focus in a startup environment.


