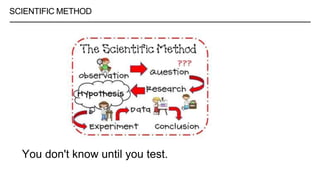
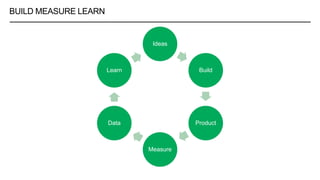
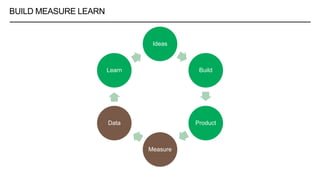
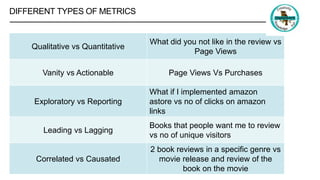
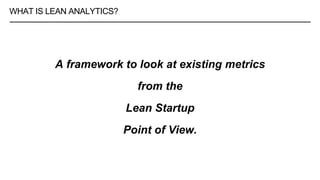
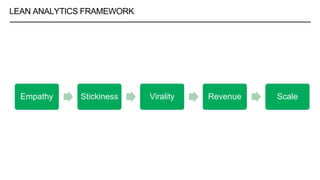
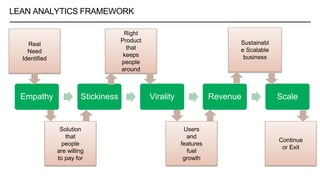
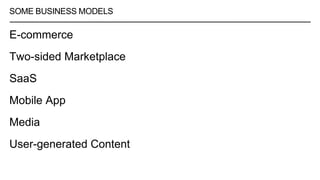
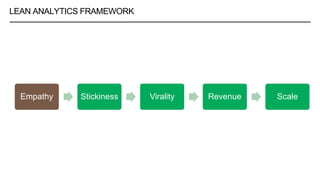
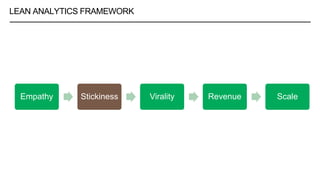
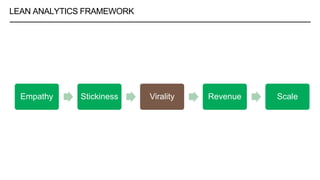
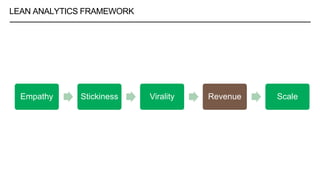
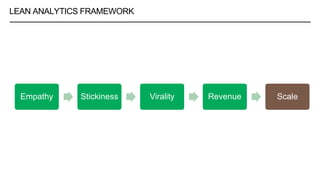
LEAN ANALYTICS
An Introduction
AGENDA
Introduction to Lean Startup
Introduction to Analytics
The Lean Analytics Framework
INTRODUCTION TO LEAN
STARTUP
When we're in the shower, when we're
thinking about our idea - boy, does it
sound brilliant. But the reality is that
most of our ideas are actually terrible –
Eric Ries
WHAT YOU THINK YOU KNOW
What I have heard
What I think will happen
What I think is common sense
What I read (*cough*)
DIGITAL AMRIT – WHAT I THOUGHT I KNEW
Blogs. Reviews.
I thought people will come in droves to read what I write.
WHAT YOU KNOW VS WHAT YOU THINK YOU KNOW
When you are launching a new product or idea, you don't know
anything about the market
WHAT IS A STARTUP
A startup is a human institution designed to deliver a new
product or service under conditions of extreme uncertainty
SCIENTIFIC METHOD
You don't know until you test.
BUILD MEASURE LEARN
Ideas
Build
Product
Measure
Data
Learn
BUILD MEASURE LEARN
Ideas
Build
Product
Measure
Data
Learn
DIGITAL AMRIT - HYPOTHESES
People are not going to read my blogs
People want to read books
People are too busy to find out what books to read
People want to find someone reliable to tell them whether
something is good or bad.
People want to buy the book based on the review.
A Minimum Viable Product (MVP) is the
version of a new product which allows a
team to collect the maximum amount of
validated learning about customers with the
least effort
SPEED
Time is an important resource. The faster your MVP
experiment is done, the quicker you can pivot.
Stop building things people don't want
INTRODUCTION TO
ANALYTICS
WHAT ARE GOOD METRICS
Comparative
Understandable
Changes Behaviour
RATES/RATIOS
The best metrics are generally ratios or rates
Easier to act on
Inherently comparative
Good for comparing opposing factors
Beware of false metrics
DIFFERENT TYPES OF METRICS
Qualitative vs Quantitative
What did you not like in the review vs
Page Views
Vanity vs Actionable Page Views Vs Purchases
Exploratory vs Reporting
What if I implemented amazon
astore vs no of clicks on amazon
links
Leading vs Lagging
Books that people want me to review
vs no of unique visitors
Correlated vs Causated
2 book reviews in a specific genre vs
movie release and review of the
book on the movie
SEGMENTATION
COHORT ANALYSIS
A/B TESTING AND MULTIVARIATE TESTING
LEAN ANALYTICS
FRAMEWORK
WHAT IS LEAN ANALYTICS?
A framework to look at existing metrics
from the
Lean Startup
Point of View.
LEAN ANALYTICS FRAMEWORK
Empathy Stickiness Virality Revenue Scale
LEAN ANALYTICS FRAMEWORK
Empathy Stickiness Virality Revenue Scale
Solution
that
people
are willing
to pay for
Real
Need
Identified
Right
Product
that
keeps
people
around
Users
and
features
fuel
growth
Sustainabl
e Scalable
business
Continue
or Exit
ONE METRIC THAT MATTERS
A single metric that’s incredibly important for the stage you
are in
WHY DOES THE OMTM MATTER?
It answers the most important question you have
It forces you draw a line in the sand
It focuses the entire company
It inspires a culture of experimentation
Stage ModelOMTM
SOME BUSINESS MODELS
E-commerce
Two-sided Marketplace
SaaS
Mobile App
Media
User-generated Content
LEAN ANALYTICS FRAMEWORK
Empathy Stickiness Virality Revenue Scale
EMPATHY
Your goal is to identify a need you can solve in a way people
will pay money for at scale.
Early on, you conduct qualitative, exploratory, open-ended
discussions to discover the unknown opportunities.
E-commerce 2S Marketplace SaaS Mobile App Media UGC
How do buyers
become aware of
the need? How
do they try to find
a solution? what
pain do they
encounter as a
result? what are
their demo-
graphics and
tech profiles?
what competes
with the product
you’re
proposing?
what’s the price
elasticity of the
product or
service?
Do buyers need
a place to sell?
Do sellers need
a place to buy?
How do they
transact today?
How do they find
items? what pre
vents them from
buying through
those channels?
will buyers share
sales revenue, or
go outside the
market? what
added-value
features entitle
you to a portion
of the proceeds?
will you be able
to generate
listings?
Do prospects
have a known
need they are
pained to solve
today? Can they
do it with
software? How
do they learn
about such
solutions? what’s
the buying
process? will the
features you’re
offering fit their
processes and
solve a pain well
enough for them
to part with
money and tell
their friends?
what’s your
target market?
what similar
games and
models have
worked? Are
there examples
of similar pricing
and gameplay
habits?
Does the basic
game structure
function? Do
users like a basic
MVP of core
gameplay, as
shown by user
testing?
Can you get
enough attention
around a
subject? How do
people consume
information? why
will they
consume your
content? what
tools, apps, and
platforms deliver
content to them
today?
Does a
community
exist? what
makes it special
and unique?
How do others
join it? How fast
is it growing? will
the com- munity
come
to you? where
does it convene
today? How
does it like to
interact? what
are its privacy
needs, and its
tolerance for
sharing and
advertising?
DIGITAL AMRIT - EMPATHY
Do people want to read business book reviews?
Is there a big audience out there?
How does goodreads works
LEAN ANALYTICS FRAMEWORK
Empathy Stickiness Virality Revenue Scale
STICKINESS
MVP Stickiness – Are your users getting the value they
want?
Iterating the MVP – least friction path between the user and
the ‘aha’ moment
HOW TO DECIDE WHAT’S PART OF THE MVP?
Why Will It Make things Better?
Can you Measure the Effect of the Feature?
How Long Will the Feature take to Build?
Will the Feature Overcomplicate things?
How Much Risk Is there in this new Feature?
How Innovative Is the new Feature?
What Do users Say they Want?
DIGITAL AMRIT - STICKINESS
put the conclusion on top to increase conversion
Why Will It Make things Better? – It makes it easy for busy folks to decided to read the book or not
immediately. Also, I can put an amazon link next to the conclusion so that the call to action is clear.
Can you Measure the Effect of the Feature? – Yes. Through Google Analytics and Amazon Affiliate
Center
How Long Will the Feature take to Build? -Instant
Will the Feature Overcomplicate things? - No
How Much Risk Is there in this new Feature? – Possibility that people don’t read my review fully.
How Innovative Is the new Feature? – not really. Should it be a twitter feed?
What Do users Say they Want? – quickly decide whether to buy the book or not.
STICKINESS
Your goal is to prove that you’ve solved a problem in a way that keeps
people coming back.
The key at this stage is engagement, which is measured by the time
spent interacting with you, the rate at which people return, and so on.
Don’t step on the gas until you’ve proven that people will do what you
want reliably.
Rely on cohort analysis to measure the impact of your continuous
improvements as you optimize the stickiness of your product.
E-commerce 2S Marketplace SaaS Mobile App Media UGC
Conversion,
shopping cart
size. For
acquisition: cost
of finding new
buyers. For
loyalty: per- cent
of buyers who
return in 90
days.
rate of inventory
creation, search
type and
frequency, price
elasticity, listing
quality, fraud
rates.
engagement,
churn, visitor/
user/customer
funnel, capacity
tiers, feature
utilization (or
neglect).
onboarding;
adoption; ease of
play; time to
“hooks”; day- ,
week-, and
month-long
churn; launches;
abandonment;
time played;
regional testing.
traffic, visits, re-
turns;
segmenting
business metrics
by topic,
category, author;
RSS, email,
twitter followers
and
clickthroughs.
Content creation,
engagement
funnel, spam
rates, content
and word-of-
mouth sharing,
primary
acquisition
channels.
LEAN ANALYTICS FRAMEWORK
Empathy Stickiness Virality Revenue Scale
VIRALITY
users sharing your product or service with others
Three types of Virality
Inherent – Google Drive
Artificial - Uber
Word-of-mouth
VIRAL COEFFICIENT & CYCLE TIME
Viral Coefficient > 1
Cycle Time
The higher your viral coefficient and the lower your cycle
time, the faster your business will grow.
GROWTH HACKING
Data-driven guerilla marketing
Requires deep understanding of the business and UX
VIRALITY
What kind of virality does your startup have?
Is it strong or weak?
What about your viral cycle time?
How can you influence both these factors?
What can do you do about your business that addresses
your customers’ wants as early as possible?
DIGITAL AMRIT - VIRALITY
Indirect Virality
Word of Mouth
Viral Coefficient is low
Cycle Time is high
E-commerce 2S Marketplace SaaS Mobile App Media UGC
Acquisition-
mode: customer
acquisition costs,
volume of
sharing. Loyalty
model: ability to
reactivate,
volume of buyers
who return.
Acquisition of
sellers,
acquisition of
buyers, inherent
and word-of-
mouth sharing.
Account creation
and configuration
Inherent virality,
customer
acquisition cost.
App store
ratings, sharing,
invites, rankings.
Content, virality,
search engine
marketing and
optimization;
promoting long
time on page.
Content invites,
user invites, in-
site messaging,
o -site sharing.
LEAN ANALYTICS FRAMEWORK
Empathy Stickiness Virality Revenue Scale
REVENUE
proving your idea is right to proving you can make money in
a scalable, consistent, self- sustaining way.
Customer Lifetime Value
Customer Acquisition Cost
For a sustainable business, CLV > CAC
REVENUE
High Viral Coefficient -> more people
Loyal customer base -> more often
Per transaction costs -> more efficiently
Big ticket transactions -> more money
Subscription -> more stuff
DIGITAL AMRIT - REVENUE
CAC is low
CLV is ???
E-commerce 2S Marketplace SaaS Mobile App Media UGC
transaction
value, revenue
per customer,
ratio of
acquisition cost
to lifetime value,
direct sales
metrics.
transactions,
commissions,
per-listing
pricing, value-
added services
such as
promotion,
photography.
Upselling,
customer
acquisition cost,
customer lifetime
value, upselling
path and road-
map.
Download
volumes,
average revenue
per player,
average revenue
per paying
player,
acquisition costs.
Cost per
engage- ment, a
liate revenues,
click- through
percent- ages,
number of
impressions.
Ads (same as
me- dia),
donations, user
data licens- ing.
LEAN ANALYTICS FRAMEWORK
Empathy Stickiness Virality Revenue Scale
SCALE
A wider audience
New markets
Predictable and sustainable business
New partners
Part of an ecosystem
SCALE
Focus on higher order metrics
External focused
Efficiency vs Differentiation
The Three Threes Model
E-commerce 2S Marketplace SaaS Mobile App Media UGC
Affiliates,
channels, white-
label, product
ratings, reviews,
support costs,
returns, RMAs
and refunds,
channel conflict.
other verticals,
related products;
bundling third-
party offers (e.g.,
car rental in a
vacation rental
site , shipping in
a craft market-
place , etc.)
Application
programming
interface (API)
traffic, Magic
number, app
ecosystem,
channels,
resellers, support
costs,
compliance, on-
premise/private
versions.
Spinoffs,
publisher and
distribution
deals,
international
versions.
Syndication,
licenses, media
and event
partnerships.
Analytics, user
data, private and
third-party ad
models, APIs.
CONGRATULATIONS
Now you are the system!
• Define success
• Hypothesize and experiment
• Build Measure Learn
• Track Metrics to change your behaviour
SUMMARY
ACKNOWLEDGEMENTS
Thanks to
• Eric Ries for his book - The Lean Startup
• Alistair Croll for & Benjamin Yoskowitz for their book – Lean Analytics
Without which I could not have done this presentation.
I highly recommend buying these books.
OTHER ANALYTICS
FRAMEWORKS
DAVE MCCLURE’S PIRATE METRICS
AARRR – Acquisition, Activation, Retention, Revenue and
Referral
ERIC RIES’S ENGINES OF GROWTH
Sticky Engine
Virality Engine
Paid Engine
ASH MAURYA’S LEAN CANVAS
SEAN ELLIS’S STARTUP GROWTH PYRAMID
THE LONG FUNNEL

Introduction to lean analytics

  • 1.
  • 2.
    AGENDA Introduction to LeanStartup Introduction to Analytics The Lean Analytics Framework
  • 3.
  • 4.
    When we're inthe shower, when we're thinking about our idea - boy, does it sound brilliant. But the reality is that most of our ideas are actually terrible – Eric Ries
  • 5.
    WHAT YOU THINKYOU KNOW What I have heard What I think will happen What I think is common sense What I read (*cough*)
  • 6.
    DIGITAL AMRIT –WHAT I THOUGHT I KNEW Blogs. Reviews. I thought people will come in droves to read what I write.
  • 7.
    WHAT YOU KNOWVS WHAT YOU THINK YOU KNOW When you are launching a new product or idea, you don't know anything about the market
  • 8.
    WHAT IS ASTARTUP A startup is a human institution designed to deliver a new product or service under conditions of extreme uncertainty
  • 9.
    SCIENTIFIC METHOD You don'tknow until you test.
  • 10.
  • 11.
  • 12.
    DIGITAL AMRIT -HYPOTHESES People are not going to read my blogs People want to read books People are too busy to find out what books to read People want to find someone reliable to tell them whether something is good or bad. People want to buy the book based on the review.
  • 13.
    A Minimum ViableProduct (MVP) is the version of a new product which allows a team to collect the maximum amount of validated learning about customers with the least effort
  • 14.
    SPEED Time is animportant resource. The faster your MVP experiment is done, the quicker you can pivot.
  • 15.
    Stop building thingspeople don't want
  • 16.
  • 17.
    WHAT ARE GOODMETRICS Comparative Understandable Changes Behaviour
  • 18.
    RATES/RATIOS The best metricsare generally ratios or rates Easier to act on Inherently comparative Good for comparing opposing factors
  • 19.
  • 20.
    DIFFERENT TYPES OFMETRICS Qualitative vs Quantitative What did you not like in the review vs Page Views Vanity vs Actionable Page Views Vs Purchases Exploratory vs Reporting What if I implemented amazon astore vs no of clicks on amazon links Leading vs Lagging Books that people want me to review vs no of unique visitors Correlated vs Causated 2 book reviews in a specific genre vs movie release and review of the book on the movie
  • 21.
  • 22.
  • 23.
    A/B TESTING ANDMULTIVARIATE TESTING
  • 24.
  • 25.
    WHAT IS LEANANALYTICS? A framework to look at existing metrics from the Lean Startup Point of View.
  • 26.
    LEAN ANALYTICS FRAMEWORK EmpathyStickiness Virality Revenue Scale
  • 27.
    LEAN ANALYTICS FRAMEWORK EmpathyStickiness Virality Revenue Scale Solution that people are willing to pay for Real Need Identified Right Product that keeps people around Users and features fuel growth Sustainabl e Scalable business Continue or Exit
  • 28.
    ONE METRIC THATMATTERS A single metric that’s incredibly important for the stage you are in
  • 29.
    WHY DOES THEOMTM MATTER? It answers the most important question you have It forces you draw a line in the sand It focuses the entire company It inspires a culture of experimentation
  • 30.
  • 31.
    SOME BUSINESS MODELS E-commerce Two-sidedMarketplace SaaS Mobile App Media User-generated Content
  • 32.
    LEAN ANALYTICS FRAMEWORK EmpathyStickiness Virality Revenue Scale
  • 33.
    EMPATHY Your goal isto identify a need you can solve in a way people will pay money for at scale. Early on, you conduct qualitative, exploratory, open-ended discussions to discover the unknown opportunities.
  • 34.
    E-commerce 2S MarketplaceSaaS Mobile App Media UGC How do buyers become aware of the need? How do they try to find a solution? what pain do they encounter as a result? what are their demo- graphics and tech profiles? what competes with the product you’re proposing? what’s the price elasticity of the product or service? Do buyers need a place to sell? Do sellers need a place to buy? How do they transact today? How do they find items? what pre vents them from buying through those channels? will buyers share sales revenue, or go outside the market? what added-value features entitle you to a portion of the proceeds? will you be able to generate listings? Do prospects have a known need they are pained to solve today? Can they do it with software? How do they learn about such solutions? what’s the buying process? will the features you’re offering fit their processes and solve a pain well enough for them to part with money and tell their friends? what’s your target market? what similar games and models have worked? Are there examples of similar pricing and gameplay habits? Does the basic game structure function? Do users like a basic MVP of core gameplay, as shown by user testing? Can you get enough attention around a subject? How do people consume information? why will they consume your content? what tools, apps, and platforms deliver content to them today? Does a community exist? what makes it special and unique? How do others join it? How fast is it growing? will the com- munity come to you? where does it convene today? How does it like to interact? what are its privacy needs, and its tolerance for sharing and advertising?
  • 35.
    DIGITAL AMRIT -EMPATHY Do people want to read business book reviews? Is there a big audience out there? How does goodreads works
  • 36.
    LEAN ANALYTICS FRAMEWORK EmpathyStickiness Virality Revenue Scale
  • 37.
    STICKINESS MVP Stickiness –Are your users getting the value they want? Iterating the MVP – least friction path between the user and the ‘aha’ moment
  • 38.
    HOW TO DECIDEWHAT’S PART OF THE MVP? Why Will It Make things Better? Can you Measure the Effect of the Feature? How Long Will the Feature take to Build? Will the Feature Overcomplicate things? How Much Risk Is there in this new Feature? How Innovative Is the new Feature? What Do users Say they Want?
  • 39.
    DIGITAL AMRIT -STICKINESS put the conclusion on top to increase conversion Why Will It Make things Better? – It makes it easy for busy folks to decided to read the book or not immediately. Also, I can put an amazon link next to the conclusion so that the call to action is clear. Can you Measure the Effect of the Feature? – Yes. Through Google Analytics and Amazon Affiliate Center How Long Will the Feature take to Build? -Instant Will the Feature Overcomplicate things? - No How Much Risk Is there in this new Feature? – Possibility that people don’t read my review fully. How Innovative Is the new Feature? – not really. Should it be a twitter feed? What Do users Say they Want? – quickly decide whether to buy the book or not.
  • 40.
    STICKINESS Your goal isto prove that you’ve solved a problem in a way that keeps people coming back. The key at this stage is engagement, which is measured by the time spent interacting with you, the rate at which people return, and so on. Don’t step on the gas until you’ve proven that people will do what you want reliably. Rely on cohort analysis to measure the impact of your continuous improvements as you optimize the stickiness of your product.
  • 41.
    E-commerce 2S MarketplaceSaaS Mobile App Media UGC Conversion, shopping cart size. For acquisition: cost of finding new buyers. For loyalty: per- cent of buyers who return in 90 days. rate of inventory creation, search type and frequency, price elasticity, listing quality, fraud rates. engagement, churn, visitor/ user/customer funnel, capacity tiers, feature utilization (or neglect). onboarding; adoption; ease of play; time to “hooks”; day- , week-, and month-long churn; launches; abandonment; time played; regional testing. traffic, visits, re- turns; segmenting business metrics by topic, category, author; RSS, email, twitter followers and clickthroughs. Content creation, engagement funnel, spam rates, content and word-of- mouth sharing, primary acquisition channels.
  • 42.
    LEAN ANALYTICS FRAMEWORK EmpathyStickiness Virality Revenue Scale
  • 43.
    VIRALITY users sharing yourproduct or service with others Three types of Virality Inherent – Google Drive Artificial - Uber Word-of-mouth
  • 44.
    VIRAL COEFFICIENT &CYCLE TIME Viral Coefficient > 1 Cycle Time The higher your viral coefficient and the lower your cycle time, the faster your business will grow.
  • 45.
    GROWTH HACKING Data-driven guerillamarketing Requires deep understanding of the business and UX
  • 46.
    VIRALITY What kind ofvirality does your startup have? Is it strong or weak? What about your viral cycle time? How can you influence both these factors? What can do you do about your business that addresses your customers’ wants as early as possible?
  • 47.
    DIGITAL AMRIT -VIRALITY Indirect Virality Word of Mouth Viral Coefficient is low Cycle Time is high
  • 48.
    E-commerce 2S MarketplaceSaaS Mobile App Media UGC Acquisition- mode: customer acquisition costs, volume of sharing. Loyalty model: ability to reactivate, volume of buyers who return. Acquisition of sellers, acquisition of buyers, inherent and word-of- mouth sharing. Account creation and configuration Inherent virality, customer acquisition cost. App store ratings, sharing, invites, rankings. Content, virality, search engine marketing and optimization; promoting long time on page. Content invites, user invites, in- site messaging, o -site sharing.
  • 49.
    LEAN ANALYTICS FRAMEWORK EmpathyStickiness Virality Revenue Scale
  • 50.
    REVENUE proving your ideais right to proving you can make money in a scalable, consistent, self- sustaining way. Customer Lifetime Value Customer Acquisition Cost For a sustainable business, CLV > CAC
  • 51.
    REVENUE High Viral Coefficient-> more people Loyal customer base -> more often Per transaction costs -> more efficiently Big ticket transactions -> more money Subscription -> more stuff
  • 52.
    DIGITAL AMRIT -REVENUE CAC is low CLV is ???
  • 53.
    E-commerce 2S MarketplaceSaaS Mobile App Media UGC transaction value, revenue per customer, ratio of acquisition cost to lifetime value, direct sales metrics. transactions, commissions, per-listing pricing, value- added services such as promotion, photography. Upselling, customer acquisition cost, customer lifetime value, upselling path and road- map. Download volumes, average revenue per player, average revenue per paying player, acquisition costs. Cost per engage- ment, a liate revenues, click- through percent- ages, number of impressions. Ads (same as me- dia), donations, user data licens- ing.
  • 54.
    LEAN ANALYTICS FRAMEWORK EmpathyStickiness Virality Revenue Scale
  • 55.
    SCALE A wider audience Newmarkets Predictable and sustainable business New partners Part of an ecosystem
  • 56.
    SCALE Focus on higherorder metrics External focused Efficiency vs Differentiation The Three Threes Model
  • 57.
    E-commerce 2S MarketplaceSaaS Mobile App Media UGC Affiliates, channels, white- label, product ratings, reviews, support costs, returns, RMAs and refunds, channel conflict. other verticals, related products; bundling third- party offers (e.g., car rental in a vacation rental site , shipping in a craft market- place , etc.) Application programming interface (API) traffic, Magic number, app ecosystem, channels, resellers, support costs, compliance, on- premise/private versions. Spinoffs, publisher and distribution deals, international versions. Syndication, licenses, media and event partnerships. Analytics, user data, private and third-party ad models, APIs.
  • 58.
  • 59.
    • Define success •Hypothesize and experiment • Build Measure Learn • Track Metrics to change your behaviour SUMMARY
  • 60.
    ACKNOWLEDGEMENTS Thanks to • EricRies for his book - The Lean Startup • Alistair Croll for & Benjamin Yoskowitz for their book – Lean Analytics Without which I could not have done this presentation. I highly recommend buying these books.
  • 61.
  • 62.
    DAVE MCCLURE’S PIRATEMETRICS AARRR – Acquisition, Activation, Retention, Revenue and Referral
  • 63.
    ERIC RIES’S ENGINESOF GROWTH Sticky Engine Virality Engine Paid Engine
  • 64.
  • 65.
    SEAN ELLIS’S STARTUPGROWTH PYRAMID
  • 66.

Editor's Notes

  • #3 Put a story for digital amrit and etsy
  • #4 Add build measure learn cycle
  • #6 My site is Digital Amrit. Blogs. Reviews. I thought people will come in droves to read it.
  • #8 Uptake was very low.
  • #14 People want to read books People are too busy to find out what books to read People want to find someone reliable to tell them whether something is good or bad. People want to buy the book based on the review.
  • #18 Take cricket Use run rate
  • #19 Revenue vs revenue per customer
  • #20 Page Views in Digital Amrit vs Likes on Good Reads
  • #21 Do you like my writing style? Vs page views Page views vs purchases What if I implemented amazon astore vs no of clicks on amazon links Books that people want me to review vs no of clicks on reviews Fantasy and fantasy vs
  • #22 The process of defining and subdividing a large homogenous market into clearly identifiable segments having similar needs, wants, or demand characteristics.
  • #23 Cohort analysis is a subset of behavioral analytics that takes the data from a given dataset (e.g. an eCommerce platform, web application, or online game) and rather than looking at all users as one unit, it breaks them into related groups for analysis. These related groups, or cohorts, usually share common characteristics or experiences within a defined time-span. Cohort analysis allows a company to “see patterns clearly across the life-cycle of a customer (or user), rather than slicing across all customers blindly without accounting for the natural cycle that a customer undergoes.”
  • #24 A/B testing is a controlled experiment with two variants, A and B Multivariate testing is a technique for testing a hypothesis in which multiple variables are modified. The goal of multivariate testing is to determine which combination of variations performs the best out of all of the possible combinations
  • #26 Examples of cohort analysis
  • #27 Show groups of metrics under each heading
  • #28 Show groups of metrics under each heading
  • #33 Show groups of metrics under each heading
  • #34 Put metrics for each business model
  • #35 Do people want to read business book reviews? Is there a big audience out there? How does goodreads works
  • #37 Show groups of metrics under each heading
  • #38  Fiction reviews Putting the conclusion on the top vs towards the end
  • #39 Yes. People who are
  • #43 Show groups of metrics under each heading
  • #44 Virality is simply users sharing your product or service with others. There are three kinds of virality: • Inherent virality is built into the product, and happens as a function of use. • Arti cial virality is forced, and often built into a reward system. • Word-of-mouth virality is the conversations generated by satis ed users, independent of your product or service.
  • #45  Viral Coefficient = invitation rate (invites/number of users) * acceptance rate (no of sign ups/invitations)
  • #46  Growth hacking is an increasingly popular term for data-driven guerilla marketing. It relies on a deep understanding of how parts of the business are related, and how tweaks to one aspect of a customer’s experience impact others. It involves: Finding a metric you can measure early in a user’s lifecycle (e.g., number of friends a user invites) through experimentation , or, if you have the data, an analysis of what good users have in common Understanding how that metric is correlated to a critical business goal (e.g., long-term engagement) Building predictions of that goal (e.g., how many engaged users you’ll have in 90 days) based on where the early metric is today Modifying the user experience today in order to improve the business goal tomorrow (e.g., suggesting people a user might know), assuming today’s metric is causing a change in tomorrow’s goal
  • #47 Should you Move On to the Revenue Stage? Ask yourself these questions: Are you using any of the three types of virality (inherent, arti cial, word of mouth) for your startup? Describe how. If virality is a weak aspect of your startup, write down three to ve ideas for how you could build more virality into your product. What’s your viral coef cient? Even if it’s below 1 (which it likely is), do you feel like the virality that exists is good enough to help sustain growth and lower customer acquisition costs? What’s your viral cycle time? How could you speed it up? What are the segments or cohorts of users who do what your business model wants them to do? What do they have in common? What can you change about your product, market, pricing, or another aspect of your business to address this as early as possible in their customer lifecycle?
  • #50 Show groups of metrics under each heading
  • #51 Revenue vs revenue per customer
  • #55 Show groups of metrics under each heading
  • #57 Three Threes 3 tiers of management 3 big assumptions 3 tactical decisions for each assumption 3 experiments for each assumption
  • #64 Sticky – retention Virality - viral coefficient CLV and CAC