Download as PDF, PPTX

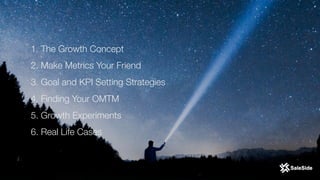


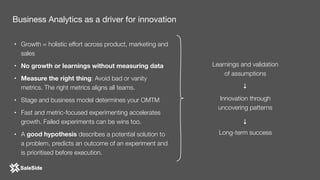

The document by Juliana Méndez outlines growth marketing strategies, emphasizing the importance of metrics in achieving business goals and driving growth. It discusses key concepts such as finding a North Star metric and One Metric That Matters (OMTM), goal setting, and conducting growth experiments while avoiding vanity metrics. Real-life case studies illustrate successful applications of these strategies, highlighting the value of data-driven decision-making in marketing.


![How to run a perfect Net Promoter Score campaign [Webinar]](https://cdn.slidesharecdn.com/ss_thumbnails/webinarhowtorunaperfectnpscampaign1-170406121457-thumbnail.jpg?width=640&height=640&fit=bounds)


![Hacking-Uncovered-How-People-Get-Hacked-and-How-to-Stay-Safe[1].pptx](https://cdn.slidesharecdn.com/ss_thumbnails/hacking-uncovered-how-people-get-hacked-and-how-to-stay-safe1-260130170011-4883a9c7-thumbnail.jpg?width=640&height=640&fit=bounds)