Downloaded 399 times
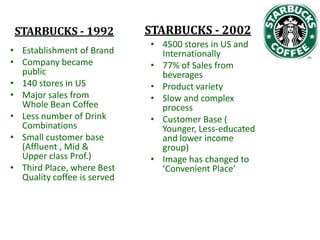
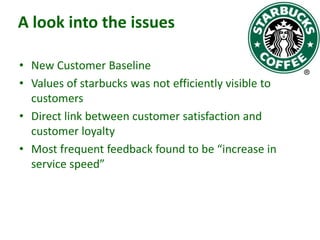
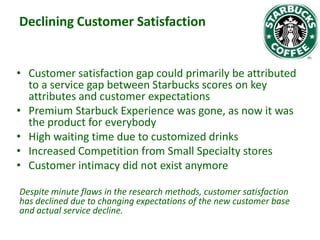
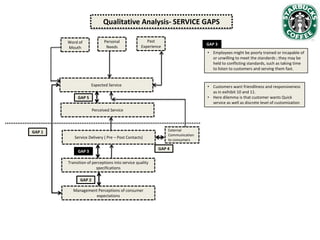
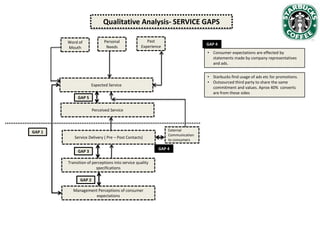
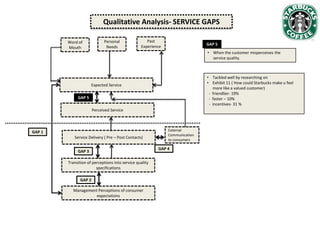
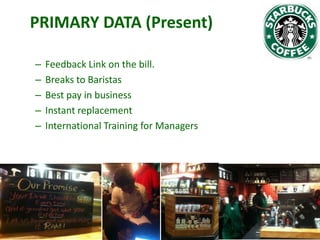

Starbucks has grown significantly since establishing in 1971 and going public in 1992. It has expanded from 140 US stores selling whole bean coffee to over 5,800 stores worldwide offering a large variety of customized drinks. While Starbucks initially targeted affluent, well-educated customers, its customer base has diversified over time. Recent data shows customer satisfaction has declined as expectations have risen and perceived service has slowed, in part due to increased customization options overwhelming employees. Starbucks is analyzing how to improve customer service and regain customer intimacy to increase loyalty.


![[rokonz.com] Glossary of Semantic SEO Part-3.pdf](https://cdn.slidesharecdn.com/ss_thumbnails/rokonz-260123200835-55123e1e-thumbnail.jpg?width=640&height=640&fit=bounds)


![[rokonz.com] Glossary of Semantic SEO Part-1.pdf](https://cdn.slidesharecdn.com/ss_thumbnails/rokonz-260123200456-440e4060-thumbnail.jpg?width=640&height=640&fit=bounds)