Downloaded 808 times
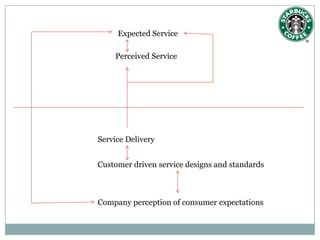
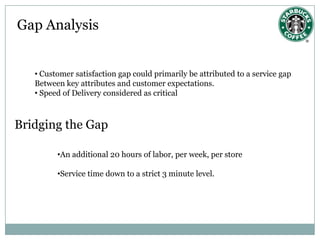
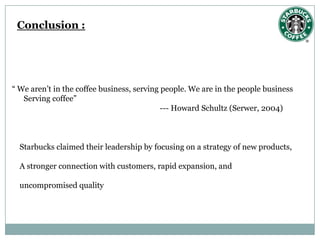

Starbucks is the largest coffeehouse company in the world with over 20,000 stores globally. It positions itself as an upscale brand selling coffee and a "rich experience". Starbucks focuses on its 7Ps - product, place, price, promotion, people, physical evidence, and process. It aims to provide a clean, friendly environment and legendary customer service. However, there is sometimes a gap between customer expectations of speed and Starbucks' actual delivery times. Starbucks works to bridge this gap and maintain its leadership in the coffee industry through strategies like new products, customer connections, and uncompromising quality.


