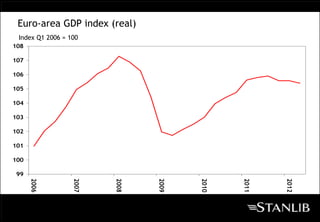
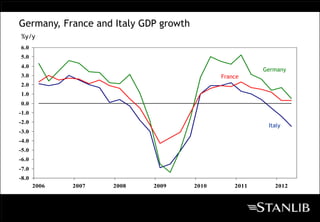
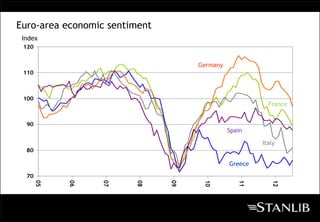
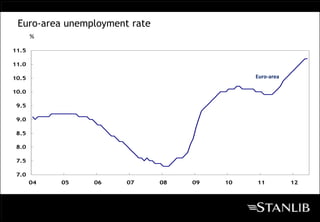
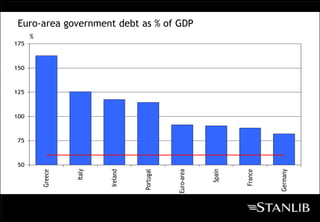
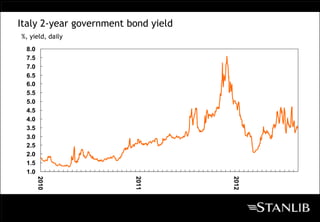
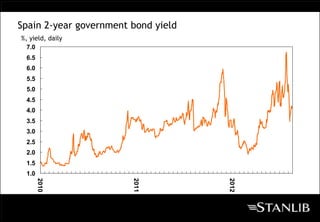
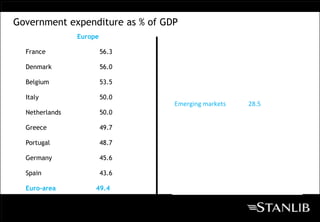
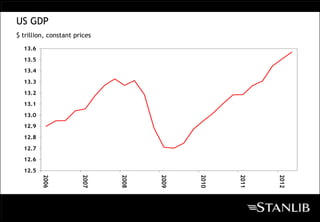
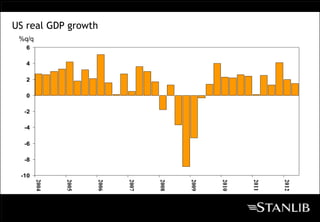
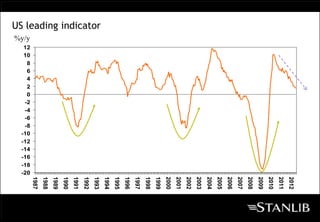
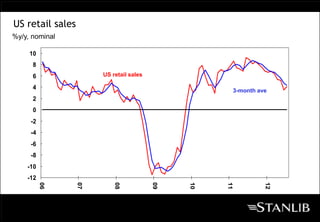
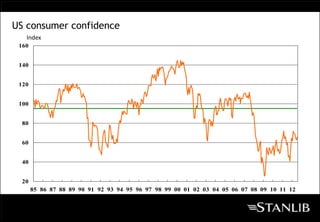
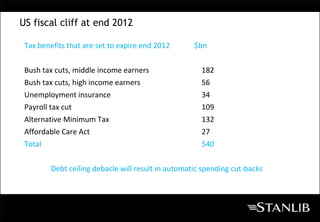
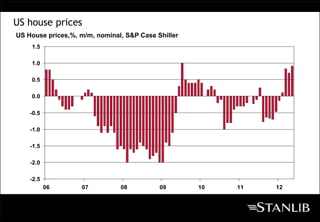
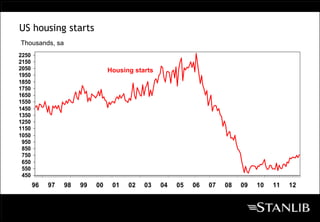
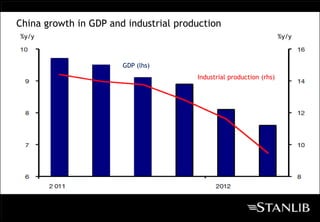
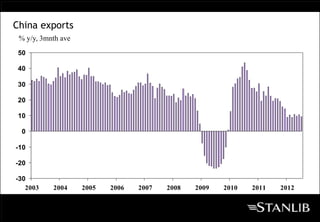
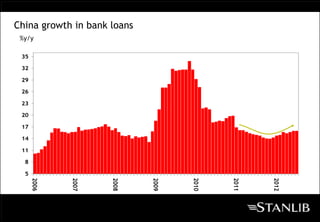
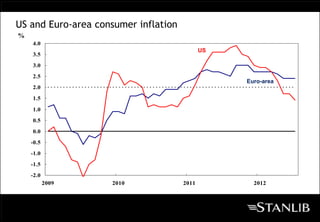
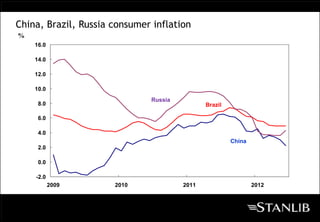
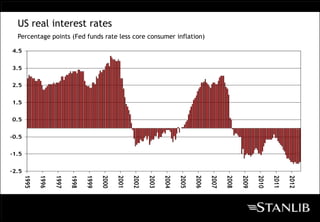
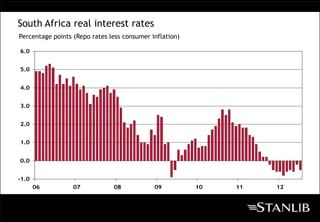
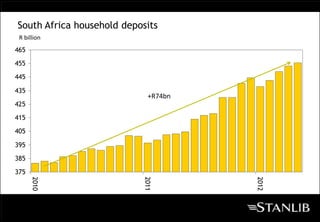
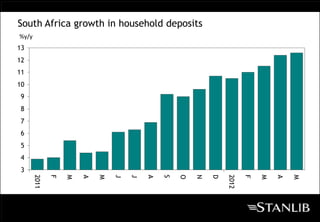
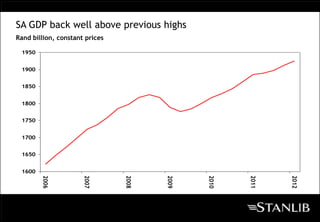
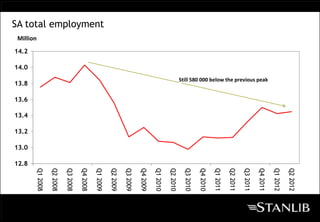
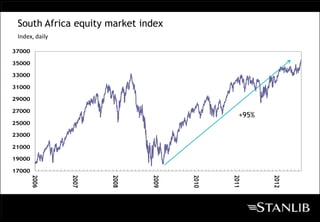
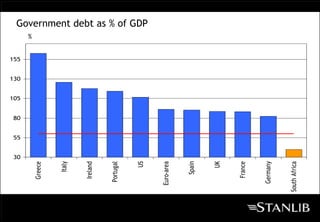
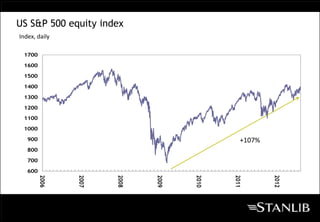
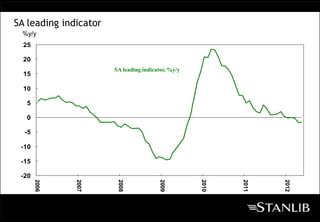
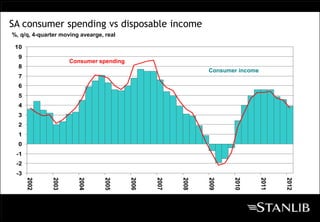
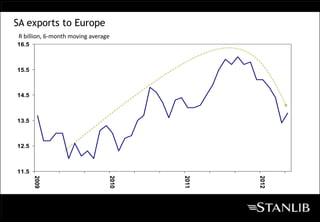
World economy under pressure:
 implications for South Africa


                                 Kevin Lings
                                 Economist
                                   STANLIB
Euro-area GDP index (real)
 Index Q1 2006 = 100
108

107

106

105

104

103

102

101

100

99
      2006


                  2007


                         2008


                                2009


                                       2010


                                              2011


                                                     2012
Germany, France and Italy GDP growth
%y/y
6.0
5.0
4.0
                                                         Germany
3.0                                           France
2.0
1.0
0.0
-1.0
-2.0
                                                          Italy
-3.0
-4.0
-5.0
-6.0
-7.0
-8.0
       2006   2007   2008   2009       2010       2011      2012
Euro-area economic sentiment
 Index
 120


                                    Germany
 110


 100
                                                         France


  90
                                              Spain

                                                       Italy
  80

                                              Greece
  70
       05


            06


                 07


                        08


                               09


                                     10


                                                 11


                                                          12
Euro-area unemployment rate
       %

11.5

11.0

10.5                                          Euro-area

10.0

 9.5

 9.0

 8.5

 8.0

 7.5

 7.0
       04   05   06    07      08   09   10   11          12
Euro-area government debt as % of GDP
      %
175


150


125


100


75


50


                                                            Spain
                   Italy


                                                                             Germany
                                                Euro-area
                           Ireland


                                     Portugal


                                                                    France
          Greece
Italy 2-year government bond yield
%, yield, daily
 8.0
 7.5
 7.0
 6.5
 6.0
 5.5
 5.0
 4.5
 4.0
 3.5
 3.0
 2.5
 2.0
 1.5
 1.0
       2010


                         2011


                                     2012
Spain 2-year government bond yield
%, yield, daily
  7.0
 6.5
 6.0
 5.5
 5.0
 4.5
 4.0
 3.5
 3.0
 2.5
 2.0
 1.5
 1.0
       2010


                        2011


                                     2012
Government expenditure as % of GDP
                Europe

  France                 56.3

  Denmark                56.0

  Belgium                53.5

  Italy                  50.0
                                 Emerging markets   28.5
  Netherlands            50.0

  Greece                 49.7

  Portugal               48.7

  Germany                45.6

  Spain                  43.6

  Euro-area          49.4
US GDP
$ trillion, constant prices
  13.6

  13.5
  13.4

  13.3

  13.2

  13.1

  13.0

  12.9

  12.8

  12.7
  12.6

  12.5
         2006


                       2007


                              2008


                                     2009


                                            2010


                                                   2011


                                                          2012
US real GDP growth
 %q/q
   6

   4

   2

   0

  -2

  -4

  -6

  -8

 -10
        2004


               2005


                      2006


                             2007


                                    2008


                                           2009


                                                  2010


                                                         2011


                                                                2012
2012
                                    2011
                                    2010
                                    2009
                                    2008
                                    2007
                                    2006
                                    2005
                                    2004
                                    2003
                                    2002
                                    2001
                                    2000
                                    1999
                                    1998
                                    1997
                                    1996
                                    1995
                                    1994
US leading indicator


                                    1993
                                    1992
                                    1991
                                    1990
                                    1989
                                    1988
                                    1987

                               12
                               10
                                8
                                6
                                4
                                2
                                0
                               -2
                               -4
                               -6
                               -8
                              -10
                              -12
                              -14
                              -16
                              -18
                              -20
                       %y/y
US retail sales
%y/y, nominal

     10
      8
      6                US retail sales

      4                                                 3-month ave
      2
      0
     -2
     -4
     -6
     -8
    -10
    -12
          06


                  07


                           08


                                         09


                                              10


                                                   11


                                                                  12
US consumer confidence
   Index
 160


 140


 120


 100


  80


  60


  40


  20
       85 86 87 88 89 90 91 92 93 94 95 96 97 98 99 00 01 02 03 04 05 06 07 08 09 10 11 12
US fiscal cliff at end 2012

 Tax benefits that are set to expire end 2012       $bn

 Bush tax cuts, middle income earners                 182
 Bush tax cuts, high income earners                   56
 Unemployment insurance                               34
 Payroll tax cut                                      109
 Alternative Minimum Tax                              132
 Affordable Care Act                                  27
 Total                                                540

         Debt ceiling debacle will result in automatic spending cut-backs
US house prices
US House prices,%, m/m, nominal, S&P Case Shiller
    1.5

    1.0

    0.5

    0.0

    -0.5

    -1.0

    -1.5

    -2.0

    -2.5
           06      07          08          09       10   11   12
US housing starts
Thousands, sa
2250
2150
2050                            Housing starts
1950
1850
1750
1650
1550
1450
1350
1250
1150
1050
 950
 850
 750
 650
 550
 450
       96   97   98   99   00    01   02   03    04   05   06   07   08   09   10   11   12
China growth in GDP and industrial production
%y/y                                                                 %y/y


                       GDP (lhs)
                                       Industrial production (rhs)
China exports
 % y/y, 3mnth ave
 50

 40

 30

 20

 10

  0

-10

-20

-30
   2003    2004     2005   2006   2007   2008   2009   2010   2011   2012
China growth in bank loans
 %y/y

 35

 32

 29

 26

 23

 20

 17

 14

 11

  8

  5
      2006


             2007


                     2008


                             2009


                                    2010


                                           2011


                                                  2012
US and Euro-area consumer inflation
%
    4.0
                                             US
    3.5
    3.0
    2.5
                                                  Euro-area
    2.0
    1.5
    1.0
    0.5
    0.0
    -0.5
    -1.0
    -1.5
    -2.0
           2009     2010              2011          2012
China, Brazil, Russia consumer inflation
%
    16.0

    14.0

    12.0

    10.0
                              Russia
     8.0                                      Brazil

     6.0

     4.0
                                                       China
     2.0

     0.0

    -2.0
           2009       2010             2011                    2012
South Africa consumer inflation
 % y/y


 14

 12

 10

  8

  6

  4

  2

  0
      2006   2007    2008     2009   2010   2011   2012
Global consumer inflation rate
  %y/y                           %y/y
2012
                                                                             2011
                                                                             2010
                                                                             2009
                                                                             2008
                                                                             2007
                                                                             2006
                                                                             2005
                                                                             2004
US corn price (Chicago)


                                                                             2003
                                                                             2002
                                                                             2001
                          $ per bushel
                                                                             2000


                                         9

                                             8

                                                 7

                                                     6

                                                         5

                                                             4

                                                                 3

                                                                     2

                                                                         1
Global interest rates
 %                                                %


                        Emerging markets (rhs)


                        Developed markets (lhs)
US real interest rates
  Percentage points (Fed funds rate less core consumer inflation)

4.5


3.5


2.5


1.5


0.5


-0.5


-1.5


-2.5
       1995

              1996

                     1997

                            1998

                                   1999

                                          2000

                                                 2001

                                                        2002

                                                               2003

                                                                      2004

                                                                             2005

                                                                                    2006

                                                                                           2007

                                                                                                  2008

                                                                                                         2009

                                                                                                                2010

                                                                                                                       2011

                                                                                                                              2012
South Africa real interest rates
Percentage points (Repo rates less consumer inflation)

6.0


5.0


4.0


3.0


2.0


1.0


0.0


-1.0
       06         07           08            09          10   11   12
South Africa household deposits
 R billion
465
455

445

435
                            +R74bn
425

415

405

395

385

375
      2010


                           2011


                                     2012
South Africa growth in household deposits
%y/y
13
12
11
10
 9
 8
 7
 6
 5
 4
 3
       2011

              F

                  M

                      A

                          M

                              J

                                  J

                                      A

                                          S

                                              O

                                                  N

                                                      D

                                                          2012

                                                                 F

                                                                     M

                                                                         A

                                                                             M
SA GDP back well above previous highs
Rand billion, constant prices

 1950


 1900


 1850


 1800


 1750


 1700


 1650


 1600
        2006


                      2007


                                2008


                                       2009


                                              2010


                                                     2011


                                                            2012
Q2 2012
                                                                                                                         Q1 2012
                                              Still 580 000 below the previous peak


                                                                                                                         Q4 2011
                                                                                                                         Q3 2011
                                                                                                                         Q2 2011
                                                                                                                         Q1 2011
                                                                                                                         Q4 2010
                                                                                                                         Q3 2010
                                                                                                                         Q2 2010
                                                                                                                         Q1 2010
                                                                                                                         Q4 2009
                                                                                                                         Q3 2009
                                                                                                                         Q2 2009
SA total employment


                                                                                                                         Q1 2009
                                                                                                                         Q4 2008
                                                                                                                         Q3 2008
                                                                                                                         Q2 2008
                      Million                                                                                            Q1 2008

                                14.2

                                       14.0

                                                             13.8

                                                                                      13.6

                                                                                             13.4

                                                                                                    13.2

                                                                                                           13.0

                                                                                                                  12.8
SA non-financial corporate deposits
R billion

 550


 500


 450


 400

 350


 300


 250
       2006


              2007


                      2008


                               2009


                                      2010


                                             2011


                                                    2012
South Africa equity market index
 Index, daily

37000

35000

33000

31000

29000

27000
                                              +95%
25000

23000

21000

19000

17000
        2006


                2007


                       2008


                              2009


                                     2010


                                            2011


                                                     2012
30
                    55
                         80
                              105
                                    130
                                          155
    Greece                                      %


       Italy


     Ireland


   Portugal


         US
                                                    Government debt as % of GDP


  Euro-area


      Spain


         UK


     France


   Germany


South Africa
Net foreign purchases of South African bonds
R billion, cumulative

220
200                                                                   +R156bn
180
160
140
120                                                 Bonds
100
 80
 60
 40
 20
  0
-20
      2004


              2005


                        2006


                               2007


                                      2008


                                             2009


                                                            2010


                                                                   2011


                                                                                2012
South Africa 10-year government bond yield
 %, yield, daily
 10.0

  9.5

  9.0

  8.5

  8.0

  7.5

  7.0

  6.5

  6.0
        2010


                         2011


                                             2012
US Federal Reserve quantitative easing
$ billion
2200
2050
1900
1750
1600
1450
1300
1150
1000
  850
  700
  550
  400
  250
  100
  -50
       2008


                2009


                            2010


                                         2011


                                                2012
US 10-year government bond yield
%, yield, daily
   4.5

   4.0

   3.5

   3.0

   2.5

   2.0

   1.5

   1.0
         2010


                         2011


                                   2012
US corporate cash on balance
 % of GDP

9.8
9.5
9.3
9.0
8.8
8.5
8.3
8.0
7.8
7.5
7.3
7.0
      2002


             2003


                    2004


                           2005


                                  2006


                                         2007


                                                2008


                                                       2009


                                                              2010


                                                                     2011


                                                                            2012
US S&P 500 equity index
Index, daily

 1700

 1600

 1500

 1400

 1300

 1200
 1100

 1000

   900                                         +107%
   800

   700

   600
         2006


                2007


                       2008


                              2009


                                     2010


                                            2011


                                                       2012
SA leading indicator
 %y/y
  25

  20
                       SA leading indicator, %y/y
  15

  10

   5

   0

  -5

 -10

 -15

 -20
       2006


              2007


                        2008


                                        2009


                                                    2010


                                                           2011


                                                                  2012
SA consumer spending vs disposable income
%, q/q, 4-quarter moving avearge, real

 10
  9
                     Consumer spending
  8
                                                              Consumer income
  7
  6
  5
  4
  3
  2
  1
  0
 -1
 -2
 -3
      2002


              2003


                        2004


                                 2005


                                         2006


                                                2007


                                                       2008


                                                              2009


                                                                     2010


                                                                                2011


                                                                                       2012
SA exports to Europe
 R billion, 6-month moving average
16.5


15.5


14.5


13.5


12.5


11.5
       2009


                                 2010


                                        2011


                                               2012
Government revenue and expenditure as % of GDP
  %
 35
 34                                                   Fiscal years
 33
 32
 31
        Expenditure as % of GDP

 30
 29
 28
 27
 26
                                  Revenue as % of GDP
 25
 24
      05/06


               06/07


                       07/08


                                  08/09


                                          09/10


                                                  10/11


                                                            11/12


                                                                     12/13


                                                                             13/14


                                                                                     14/15
Government salary payments
Billions
 400
                                                                +6.4% per annum
 360


 320
                     +16.0% per annum
 280


 240


 200


 160
           2007/08


                       2008/09


                                  2009/10


                                            2010/11


                                                      2011/12


                                                                    2012/13


                                                                                  2013/14


                                                                                            2014/15
Increase in the spending on social grants
%y/y
 13

 12

 11

 10

  9

  8

  7

  6

  5
        2009/10


                  2010/11


                            2011/12


                                      2012/13


                                                2013/14


                                                          2014/15
Public sector infrastructural spending
 Rbn                                                                                          R844.5bn
  350
         Public sector only spent 68% of budget
  300

  250

  200

  150                                                                                            284.6      297.6
                                                                                   262.3
                                                                        226.6
  100                                  193.0      203.6
                                                             177.8
                            130.2
   50             83.6
        70.7

   0
        2005/06


                  2006/07


                             2007/08


                                        2008/09


                                                   2009/10


                                                              2010/11


                                                                         2011/12


                                                                                    2012/13


                                                                                                  2013/14


                                                                                                             2014/15
World corruption perception index: South Africa
World ranking
  65


  60


  55


  50


  45


  40
           2005


                  2006


                         2007


                                2008


                                        2009


                                                  2010


                                                         2011
Transnet capital expenditure
(R300bn over 7yrs)
Rbn                        Create 588 000 direct and in-direct job opportunities
60
55
50
45
40
35
30
25
20
15
10
 5
 0
      2007


             2008


                    2009


                             2010


                                     2011


                                            2012


                                                   2013


                                                           2014


                                                                  2015


                                                                         2016


                                                                                   2017


                                                                                          2018


                                                                                                 2019
Transnet capacity creation projects

● Iron ore export railway line expansion to 82.5m tons, up from 43m

● Coal railway line expansion to 97.5m tons, up from 65m

● Increase export manganese exports to 12m tons from 5m tons

● General rail freight capacity from 79.7m tons to 170.2m tons

● Container terminal at Coega

● Cape Town container port expansion

● Durban container port terminal berth deepening

● Transnet multi purpose product pipeline
SA non-financial corporate deposits
R billion

 550


 500


 450


 400

 350


 300


 250
       2006


              2007


                      2008


                               2009


                                      2010


                                             2011


                                                    2012
Thank you

Stanlib Presentation. World economy under pressure.

  • 1.
    World economy underpressure: implications for South Africa Kevin Lings Economist STANLIB
  • 2.
    Euro-area GDP index(real) Index Q1 2006 = 100 108 107 106 105 104 103 102 101 100 99 2006 2007 2008 2009 2010 2011 2012
  • 3.
    Germany, France andItaly GDP growth %y/y 6.0 5.0 4.0 Germany 3.0 France 2.0 1.0 0.0 -1.0 -2.0 Italy -3.0 -4.0 -5.0 -6.0 -7.0 -8.0 2006 2007 2008 2009 2010 2011 2012
  • 4.
    Euro-area economic sentiment Index 120 Germany 110 100 France 90 Spain Italy 80 Greece 70 05 06 07 08 09 10 11 12
  • 5.
    Euro-area unemployment rate % 11.5 11.0 10.5 Euro-area 10.0 9.5 9.0 8.5 8.0 7.5 7.0 04 05 06 07 08 09 10 11 12
  • 6.
    Euro-area government debtas % of GDP % 175 150 125 100 75 50 Spain Italy Germany Euro-area Ireland Portugal France Greece
  • 7.
    Italy 2-year governmentbond yield %, yield, daily 8.0 7.5 7.0 6.5 6.0 5.5 5.0 4.5 4.0 3.5 3.0 2.5 2.0 1.5 1.0 2010 2011 2012
  • 8.
    Spain 2-year governmentbond yield %, yield, daily 7.0 6.5 6.0 5.5 5.0 4.5 4.0 3.5 3.0 2.5 2.0 1.5 1.0 2010 2011 2012
  • 9.
    Government expenditure as% of GDP Europe France 56.3 Denmark 56.0 Belgium 53.5 Italy 50.0 Emerging markets 28.5 Netherlands 50.0 Greece 49.7 Portugal 48.7 Germany 45.6 Spain 43.6 Euro-area 49.4
  • 10.
    US GDP $ trillion,constant prices 13.6 13.5 13.4 13.3 13.2 13.1 13.0 12.9 12.8 12.7 12.6 12.5 2006 2007 2008 2009 2010 2011 2012
  • 11.
    US real GDPgrowth %q/q 6 4 2 0 -2 -4 -6 -8 -10 2004 2005 2006 2007 2008 2009 2010 2011 2012
  • 12.
    2012 2011 2010 2009 2008 2007 2006 2005 2004 2003 2002 2001 2000 1999 1998 1997 1996 1995 1994 US leading indicator 1993 1992 1991 1990 1989 1988 1987 12 10 8 6 4 2 0 -2 -4 -6 -8 -10 -12 -14 -16 -18 -20 %y/y
  • 13.
    US retail sales %y/y,nominal 10 8 6 US retail sales 4 3-month ave 2 0 -2 -4 -6 -8 -10 -12 06 07 08 09 10 11 12
  • 14.
    US consumer confidence Index 160 140 120 100 80 60 40 20 85 86 87 88 89 90 91 92 93 94 95 96 97 98 99 00 01 02 03 04 05 06 07 08 09 10 11 12
  • 15.
    US fiscal cliffat end 2012 Tax benefits that are set to expire end 2012 $bn Bush tax cuts, middle income earners 182 Bush tax cuts, high income earners 56 Unemployment insurance 34 Payroll tax cut 109 Alternative Minimum Tax 132 Affordable Care Act 27 Total 540 Debt ceiling debacle will result in automatic spending cut-backs
  • 16.
    US house prices USHouse prices,%, m/m, nominal, S&P Case Shiller 1.5 1.0 0.5 0.0 -0.5 -1.0 -1.5 -2.0 -2.5 06 07 08 09 10 11 12
  • 17.
    US housing starts Thousands,sa 2250 2150 2050 Housing starts 1950 1850 1750 1650 1550 1450 1350 1250 1150 1050 950 850 750 650 550 450 96 97 98 99 00 01 02 03 04 05 06 07 08 09 10 11 12
  • 18.
    China growth inGDP and industrial production %y/y %y/y GDP (lhs) Industrial production (rhs)
  • 19.
    China exports %y/y, 3mnth ave 50 40 30 20 10 0 -10 -20 -30 2003 2004 2005 2006 2007 2008 2009 2010 2011 2012
  • 20.
    China growth inbank loans %y/y 35 32 29 26 23 20 17 14 11 8 5 2006 2007 2008 2009 2010 2011 2012
  • 21.
    US and Euro-areaconsumer inflation % 4.0 US 3.5 3.0 2.5 Euro-area 2.0 1.5 1.0 0.5 0.0 -0.5 -1.0 -1.5 -2.0 2009 2010 2011 2012
  • 22.
    China, Brazil, Russiaconsumer inflation % 16.0 14.0 12.0 10.0 Russia 8.0 Brazil 6.0 4.0 China 2.0 0.0 -2.0 2009 2010 2011 2012
  • 23.
    South Africa consumerinflation % y/y 14 12 10 8 6 4 2 0 2006 2007 2008 2009 2010 2011 2012
  • 24.
  • 25.
    2012 2011 2010 2009 2008 2007 2006 2005 2004 US corn price (Chicago) 2003 2002 2001 $ per bushel 2000 9 8 7 6 5 4 3 2 1
  • 26.
    Global interest rates % % Emerging markets (rhs) Developed markets (lhs)
  • 27.
    US real interestrates Percentage points (Fed funds rate less core consumer inflation) 4.5 3.5 2.5 1.5 0.5 -0.5 -1.5 -2.5 1995 1996 1997 1998 1999 2000 2001 2002 2003 2004 2005 2006 2007 2008 2009 2010 2011 2012
  • 28.
    South Africa realinterest rates Percentage points (Repo rates less consumer inflation) 6.0 5.0 4.0 3.0 2.0 1.0 0.0 -1.0 06 07 08 09 10 11 12
  • 29.
    South Africa householddeposits R billion 465 455 445 435 +R74bn 425 415 405 395 385 375 2010 2011 2012
  • 30.
    South Africa growthin household deposits %y/y 13 12 11 10 9 8 7 6 5 4 3 2011 F M A M J J A S O N D 2012 F M A M
  • 31.
    SA GDP backwell above previous highs Rand billion, constant prices 1950 1900 1850 1800 1750 1700 1650 1600 2006 2007 2008 2009 2010 2011 2012
  • 32.
    Q2 2012 Q1 2012 Still 580 000 below the previous peak Q4 2011 Q3 2011 Q2 2011 Q1 2011 Q4 2010 Q3 2010 Q2 2010 Q1 2010 Q4 2009 Q3 2009 Q2 2009 SA total employment Q1 2009 Q4 2008 Q3 2008 Q2 2008 Million Q1 2008 14.2 14.0 13.8 13.6 13.4 13.2 13.0 12.8
  • 33.
    SA non-financial corporatedeposits R billion 550 500 450 400 350 300 250 2006 2007 2008 2009 2010 2011 2012
  • 34.
    South Africa equitymarket index Index, daily 37000 35000 33000 31000 29000 27000 +95% 25000 23000 21000 19000 17000 2006 2007 2008 2009 2010 2011 2012
  • 35.
    30 55 80 105 130 155 Greece % Italy Ireland Portugal US Government debt as % of GDP Euro-area Spain UK France Germany South Africa
  • 36.
    Net foreign purchasesof South African bonds R billion, cumulative 220 200 +R156bn 180 160 140 120 Bonds 100 80 60 40 20 0 -20 2004 2005 2006 2007 2008 2009 2010 2011 2012
  • 37.
    South Africa 10-yeargovernment bond yield %, yield, daily 10.0 9.5 9.0 8.5 8.0 7.5 7.0 6.5 6.0 2010 2011 2012
  • 38.
    US Federal Reservequantitative easing $ billion 2200 2050 1900 1750 1600 1450 1300 1150 1000 850 700 550 400 250 100 -50 2008 2009 2010 2011 2012
  • 39.
    US 10-year governmentbond yield %, yield, daily 4.5 4.0 3.5 3.0 2.5 2.0 1.5 1.0 2010 2011 2012
  • 40.
    US corporate cashon balance % of GDP 9.8 9.5 9.3 9.0 8.8 8.5 8.3 8.0 7.8 7.5 7.3 7.0 2002 2003 2004 2005 2006 2007 2008 2009 2010 2011 2012
  • 41.
    US S&P 500equity index Index, daily 1700 1600 1500 1400 1300 1200 1100 1000 900 +107% 800 700 600 2006 2007 2008 2009 2010 2011 2012
  • 42.
    SA leading indicator %y/y 25 20 SA leading indicator, %y/y 15 10 5 0 -5 -10 -15 -20 2006 2007 2008 2009 2010 2011 2012
  • 43.
    SA consumer spendingvs disposable income %, q/q, 4-quarter moving avearge, real 10 9 Consumer spending 8 Consumer income 7 6 5 4 3 2 1 0 -1 -2 -3 2002 2003 2004 2005 2006 2007 2008 2009 2010 2011 2012
  • 44.
    SA exports toEurope R billion, 6-month moving average 16.5 15.5 14.5 13.5 12.5 11.5 2009 2010 2011 2012
  • 45.
    Government revenue andexpenditure as % of GDP % 35 34 Fiscal years 33 32 31 Expenditure as % of GDP 30 29 28 27 26 Revenue as % of GDP 25 24 05/06 06/07 07/08 08/09 09/10 10/11 11/12 12/13 13/14 14/15
  • 46.
    Government salary payments Billions 400 +6.4% per annum 360 320 +16.0% per annum 280 240 200 160 2007/08 2008/09 2009/10 2010/11 2011/12 2012/13 2013/14 2014/15
  • 47.
    Increase in thespending on social grants %y/y 13 12 11 10 9 8 7 6 5 2009/10 2010/11 2011/12 2012/13 2013/14 2014/15
  • 48.
    Public sector infrastructuralspending Rbn R844.5bn 350 Public sector only spent 68% of budget 300 250 200 150 284.6 297.6 262.3 226.6 100 193.0 203.6 177.8 130.2 50 83.6 70.7 0 2005/06 2006/07 2007/08 2008/09 2009/10 2010/11 2011/12 2012/13 2013/14 2014/15
  • 49.
    World corruption perceptionindex: South Africa World ranking 65 60 55 50 45 40 2005 2006 2007 2008 2009 2010 2011
  • 50.
    Transnet capital expenditure (R300bnover 7yrs) Rbn Create 588 000 direct and in-direct job opportunities 60 55 50 45 40 35 30 25 20 15 10 5 0 2007 2008 2009 2010 2011 2012 2013 2014 2015 2016 2017 2018 2019
  • 51.
    Transnet capacity creationprojects ● Iron ore export railway line expansion to 82.5m tons, up from 43m ● Coal railway line expansion to 97.5m tons, up from 65m ● Increase export manganese exports to 12m tons from 5m tons ● General rail freight capacity from 79.7m tons to 170.2m tons ● Container terminal at Coega ● Cape Town container port expansion ● Durban container port terminal berth deepening ● Transnet multi purpose product pipeline
  • 52.
    SA non-financial corporatedeposits R billion 550 500 450 400 350 300 250 2006 2007 2008 2009 2010 2011 2012
  • 53.