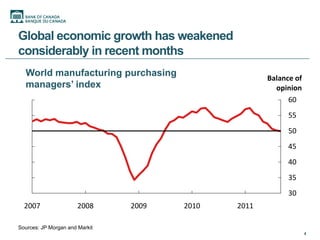
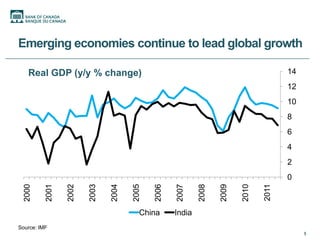
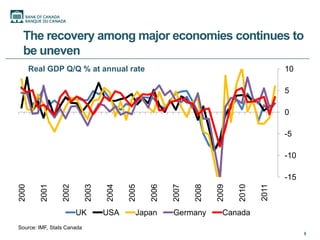
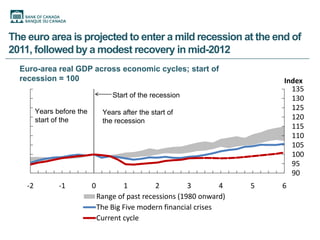
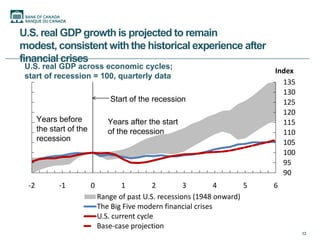
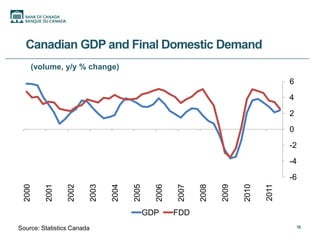
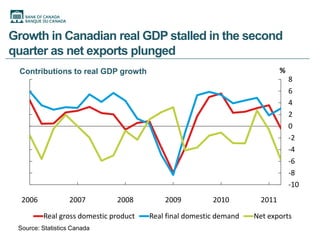
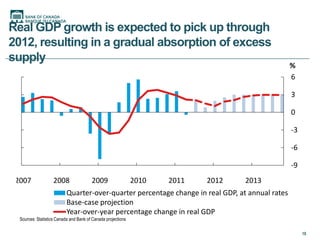
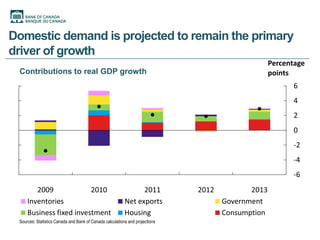
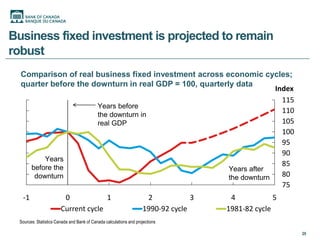
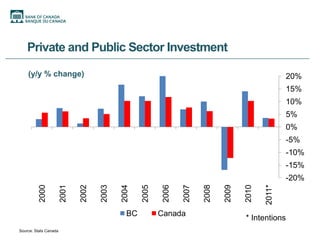
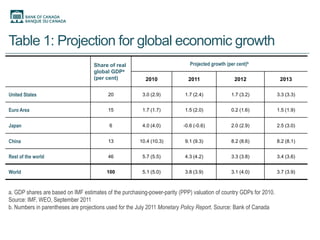
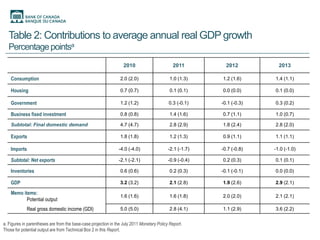
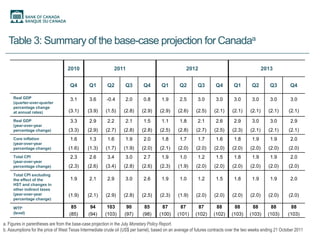
Recent Developments in the Canadian
Economy
December 2011


                 Dr. Farid Novin


                                   Bank of Canada
Outline
   ๏‚ง World Economy

   ๏‚ง The United States

   ๏‚ง Canada and BC


                         2
The World Economy


                    3
Global economic growth has weakened
considerably in recent months
  World manufacturing purchasing                     Balance of
  managersโ€™ index                                      opinion
                                                           60
                                                           55
                                                           50
                                                           45
                                                           40
                                                           35
                                                           30
  2007                 2008     2009   2010   2011

Sources: JP Morgan and Markit
                                                                  4
Emerging economies continue to lead global growth

    Real GDP (y/y % change)                                                             14
                                                                                        12
                                                                                        10
                                                                                        8
                                                                                        6
                                                                                        4
                                                                                        2
                                                                                        0
                                             2006
  2000

          2001

                 2002

                        2003

                               2004

                                      2005


                                                    2007

                                                            2008

                                                                   2009

                                                                          2010

                                                                                 2011
                                         China      India
Source: IMF
                                                                                             5
The recovery among major economies continues to
  be uneven
       Real GDP Q/Q % at annual rate                                                       10

                                                                                           5

                                                                                           0

                                                                                           -5

                                                                                           -10

                                                                                           -15


                                                                                    2011
                                          2005

                                                 2006
2000

          2001

                 2002

                            2003

                                   2004


                                                        2007

                                                               2008

                                                                      2009

                                                                             2010
                        UK         USA       Japan      Germany         Canada
Source: IMF, Stats Canada
                                                                                                 6
The euro area is projected to enter a mild recession at the end of
2011, followed by a modest recovery in mid-2012
  Euro-area real GDP across economic cycles; start of
  recession = 100                                                            Index
                                                                               135
                                    Start of the recession                     130
         Years before the
                                                                               125
                                 Years after the start of
         start of the            the recession
                                                                               120
                                                                               115
                                                                               110
                                                                               105
                                                                               100
                                                                               95
                                                                               90
    -2          -1          0           1         2         3        4   5   6
                                Range of past recessions (1980 onward)
                                The Big Five modern financial crises
                                Current cycle
Policy rates remain at or near historic lows in most
     advanced economies
                                                                                                         %
                                                                                                         4.5
                                                                                                         4.0
                                                                                                         3.5
                                                                                                         3.0
                                                                                                         2.5
                                                                                                         2.0
                                                                                                         1.5
                                                                                                         1.0
                                                                                                         0.5
                                                                                                         0.0
        2008                              2009                              2010          2011

                              Canada                      United States            Euro area     Japan
Source: Bank of Canada, US Federal Reserve, European Central Bank, Bank of Japan


                                                                                                               8
Large deficits remain a problem for many
countries...
Deficit as a % of GDP, all levels of government


                                                  -5


                                                  -15


                                                  -25


                     2008    2009    2010         -35

 Source: IMF
                                                       9
Euro-area sovereigns, even some larger core
    countries, are facing rising funding costs
   10-year sovereign yield spreads
   over German bonds, basis points
Basis points                                                                        Basis points
2400                                                                                       1400
2000                                                                                       1200
1600                                                                                       1000
                                                                                           800
1200
                                                                                           600
 800                                                                                       400
 400                                                                                       200
     0                                                                                     0
       2008                      2009             2010            2011
                    Greece (left scale)   Ireland  Portugal   Spain    Italy         France
Source: Bloomberg                                                       Last observation: 21 October 2011

                                                                                                            10
US economy


             11
US GDP and Final Domestic Demand

 (volume, y/y % change)                           8
                                                  6
                                                  4
                                                  2
                                                  0
                                                  -2
                                                  -4
                                                  -6
  1990
  1991
  1992
  1993

  1995

  1997

  1999
  2000
  2001
  2002
  2003
  2004
  2005
  2006
  2007
  2008

  2010
  1994

  1996

  1998


  2009

  2011
                  GDP     Final Domestic Demand
                                                       12
U.S. real GDP growth is projected to remain
modest, consistent with the historical experience after
financial crises
 U.S. real GDP across economic cycles;
                                                                              Index
 start of recession = 100, quarterly data
                                                                                135
                                                                                130
                                  Start of the recession                        125
                                                                                120
       Years before              Years after the start                          115
       the start of the          of the recession                               110
       recession                                                                105
                                                                                100
                                                                                95
                                                                                90
  -2          -1          0           1         2        3         4      5   6
                              Range of past U.S. recessions (1948 onward)
                              The Big Five modern financial crises
                              U.S. current cycle
                              Base-case projection
                                                                                      13
Quantitative easing has led to an increase in the Federal
         Reserveโ€™s balance sheet

     Federal Reserve Assets, Trillions of US$       Federal Reserve Liabilities, Trillions of US$
3                                               3


2                                               2


                                                1
1
                                                               others
             TALF                Swaps                         GA
                                                               Depository Institutions
             CP loan facility    TAC                           SFA
             MBS                 Other                         Reverse Repo
             Treasury's                         0              Federal Reserve notes
                                                               other liabilities
                                                    2008


0
    2โ€ฆ


                                                                                               14
Canada and B.C.


                  15
Canadian GDP and Final Domestic Demand
    (volume, y/y % change)
                                                                                             6
                                                                                             4
                                                                                             2
                                                                                             0
                                                                                             -2
                                                                                             -4
                                                                                             -6


                                                                                      2011
                                                                               2010
 2000

         2001

                 2002

                            2003

                                   2004

                                          2005

                                                   2006

                                                          2007

                                                                 2008

                                                                        2009
                                                 GDP      FDD
Source: Statistics Canada                                                                         16
Growth in Canadian real GDP stalled in the second
quarter as net exports plunged
 Contributions to real GDP growth                                            %
                                                                                 8
                                                                                 6
                                                                                 4
                                                                                 2
                                                                                 0
                                                                                 -2
                                                                                 -4
                                                                                 -6
                                                                                 -8
                                                                                 -10
  2006            2007        2008         2009          2010         2011

         Real gross domestic product   Real final domestic demand   Net exports
 Source: Statistics Canada
Real GDP growth is expected to pick up through
2012, resulting in a gradual absorption of excess
supply
                                                                                                 %
                                                                                                 6

                                                                                                 3

                                                                                                 0

                                                                                                 -3

                                                                                                 -6

                                                                                                 -9
 2007               2008                2009                  2010   2011   2012   2013
                           Quarter-over-quarter percentage change in real GDP, at annual rates
                           Base-case projection
                           Year-over-year percentage change in real GDP
  Sources: Statistics Canada and Bank of Canada projections

                                                                                                      18
Domestic demand is projected to remain the primary
driver of growth
                                                                                                   Percentage
 Contributions to real GDP growth                                                                  points
                                                                                                         6
                                                                                                         4
                                                                                                         2
                                                                                                         0
                                                                                                         -2
                                                                                                         -4
                                                                                                         -6
        2009             2010                                   2011          2012          2013
     Inventories                                          Net exports                Government
     Business fixed investment                            Housing                    Consumption
 Sources: Statistics Canada and Bank of Canada calculations and projections
Business fixed investment is projected to remain
robust
  Comparison of real business fixed investment across economic cycles;
  quarter before the downturn in real GDP = 100, quarterly data
                                                                      Index
                                                                        115
                      Years before
                      the downturn in
                                                                        110
                      real GDP                                          105
                                                                        100
                                                                        95
                                                                        90
        Years
    before the
                                                                        85
                                                         Years after
     downturn                                            the downturn   80
                                                                        75
   -1                    0            1                              2            3    4            5
                        Current cycle                               1990-92 cycle     1981-82 cycle
  Sources: Statistics Canada and Bank of Canada calculations and projections

                                                                                                        20
Private and Public Sector Investment

    (y/y % change)                                                                                    20%
                                                                                                      15%
                                                                                                      10%
                                                                                                      5%
                                                                                                      0%
                                                                                                      -5%
                                                                                                      -10%
                                                                                                      -15%
                                                                                                      -20%


                                                                                              2011*
          2000

                       2001

                              2002

                                     2003

                                            2004

                                                   2005

                                                           2006

                                                                  2007

                                                                         2008

                                                                                2009

                                                                                       2010
                                              BC          Canada
                                                                                       * Intentions
Source: Stats Canada
Employment has nearly returned to pre-recession
  levels in B.C.
Index 2006Q1=100                                          110
                                                          108
                                                          106
                                                          104
                                                          102
                                                          100
                                                          98
                                                          96
                                                          94
     2006          2007     2008   2009   2010     2011
                            B.C.          Canada

Source: Statistics Canada
                                                                22
Commodity prices

       Index 2006=100                                                                     250

                                                                                          200

                                                                                          150

                                                                                          100

                                                                                          50

                                                                                          0
       2006


                         2007


                                      2008


                                                      2009


                                                                      2010


                                                                                   2011
                                Oil          Copper          Lumber          Nat. Gas

Source: Bank of Canada

                                                                                                23
BCโ€™s forestry industry has been severely affected
    by the US housing recession
       Exports ($millions)                                                                             12,000

                                                                                                       10,000

                                                                                                       8,000

                                                                                                       6,000

                                                                                                       4,000

                                                                                                       2,000

                                                                                                       0


                                                                                             2011YTD
                            2002


                                                                                      2010
           2000

                   2001


                                   2003

                                          2004

                                                 2005

                                                          2006

                                                                 2007

                                                                        2008

                          Wood products                 Pulp & paper products  2009
Source: BC Stats
However, efforts to grow Chinese demand for BCโ€™s
softwood lumber have been very successful
  Growth in value of softwood                           Share of BC softwood
  lumber exports to China                               lumber exports by value
                              120
  (y/y% change)                                         (%)                           80
                                                  100                                 70
                                                                                      60
                                                  80                                  50
                                                                                      40
                                                  60
                                                                                      30
                                                  40                                  20
                                                                                      10
                                                  20
                                                                                      0


                                                        2011YTD
                                                            2004


                                                            2008
                                                            2000
                                                            2001
                                                            2002
                                                            2003

                                                            2005
                                                            2006
                                                            2007

                                                            2009
                                                            2010
                                                  0
                                        2011YTD
 2006

           2007

                   2008

                          2009

                                 2010


Source: BC Stats
                                                        United States   Japan     China   25
Capacity pressures have eased in recent months


      %                                                                 %
                                                                         3
 70
 60                                                                      2
 50                                                                      1
 40                                                                      0
 30                                                                      -1
 20                                                                      -2
 10                                                                      -3
  0                                                                      -4
      2006    2007         2008         2009         2010        2011
             Some and significant difficulty* (left scale)
             Labour shortages** (left scale)
             Conventional measure of the output gap*** (right scale)

                                                                              26
Table 1: Projection for global economic growth
                                    Share of real                            Projected growth (per cent)b
                                    global GDPa
                                    (per cent)            2010              2011                  2012               2013

United States                             20            3.0 (2.9)         1.7 (2.4)             1.7 (3.2)           3.3 (3.3)


Euro Area                                 15            1.7 (1.7)         1.5 (2.0)             0.2 (1.6)           1.5 (1.9)


Japan                                     6             4.0 (4.0)         -0.6 (-0.6)           2.0 (2.9)           2.5 (3.0)


China                                     13           10.4 (10.3)        9.1 (9.3)             8.2 (8.6)           8.2 (8.1)


Rest of the world                         46            5.7 (5.5)         4.3 (4.2)             3.3 (3.8)           3.4 (3.6)


World                                    100            5.1 (5.0)         3.8 (3.9)             3.1 (4.0)           3.7 (3.9)


a. GDP shares are based on IMF estimates of the purchasing-power-parity (PPP) valuation of country GDPs for 2010.
Source: IMF, WEO, September 2011
b. Numbers in parentheses are projections used for the July 2011 Monetary Policy Report. Source: Bank of Canada
Table 2: Contributions to average annual real GDP growth
  Percentage pointsa
                                                                   2010                       2011          2012          2013

    Consumption                                                  2.0 (2.0)                   1.0 (1.3)    1.2 (1.6)     1.4 (1.1)

    Housing                                                      0.7 (0.7)                   0.1 (0.1)    0.0 (0.0)     0.1 (0.0)

    Government                                                   1.2 (1.2)                  0.3 (-0.1)    -0.1 (-0.3)   0.3 (0.2)

    Business fixed investment                                    0.8 (0.8)                   1.4 (1.6)    0.7 (1.1)     1.0 (0.7)

    Subtotal: Final domestic demand                              4.7 (4.7)                   2.8 (2.9)    1.8 (2.4)     2.8 (2.0)

    Exports                                                      1.8 (1.8)                   1.2 (1.3)    0.9 (1.1)     1.1 (1.1)

    Imports                                                     -4.0 (-4.0)                 -2.1 (-1.7)   -0.7 (-0.8)   -1.0 (-1.0)

    Subtotal: Net exports                                       -2.1 (-2.1)                 -0.9 (-0.4)   0.2 (0.3)     0.1 (0.1)

    Inventories                                                  0.6 (0.6)                   0.2 (0.3)    -0.1 (-0.1)   0.0 (0.0)

    GDP                                                          3.2 (3.2)                   2.1 (2.8)    1.9 (2.6)     2.9 (2.1)

    Memo items:
                                                                 1.6 (1.6)                   1.6 (1.8)    2.0 (2.0)     2.1 (2.1)
           Potential output
             Real gross domestic income (GDI)                    5.0 (5.0)                   2.8 (4.1)    1.1 (2.9)     3.6 (2.2)


a. Figures in parentheses are from the base-case projection in the July 2011 Monetary Policy Report.
Those for potential output are from Technical Box 2 in this Report.
Table 3: Summary of the base-case projection for Canadaa

                                   2010                      2011                                    2012                                       2013


                                     Q4        Q1        Q2        Q3        Q4        Q1        Q2        Q3        Q4        Q1        Q2        Q3         Q4

     Real GDP                        3.1       3.6       -0.4      2.0       0.8       1.9       2.5       3.0       3.0       3.0       3.0       3.0         3.0
     (quarter-over-quarter
     percentage change
     at annual rates)               (3.1)     (3.9)     (1.5)     (2.8)     (2.9)     (2.9)     (2.6)     (2.5)     (2.1)     (2.1)     (2.1)     (2.1)       (2.1)
     Real GDP                        3.3       2.9       2.2       2.1       1.5       1.1       1.8       2.1       2.6       2.9       3.0       3.0         2.9
     (year-over-year
     percentage change)             (3.3)     (2.9)     (2.7)     (2.8)     (2.8)     (2.5)     (2.8)     (2.7)     (2.5)     (2.3)     (2.1)     (2.1)       (2.1)
     Core inflation                  1.6       1.3       1.6       1.9       2.0       1.8       1.7       1.7       1.6       1.8       1.9       1.9         2.0
     (year-over-year
     percentage change)             (1.6)     (1.3)     (1.7)     (1.9)     (2.0)     (2.1)     (2.0)     (2.0)     (2.0)     (2.0)     (2.0)     (2.0)       (2.0)
     Total CPI                       2.3       2.6       3.4       3.0       2.7       1.9       1.0       1.2       1.5       1.8       1.9       1.9         2.0
     (year-over-year
     percentage change)             (2.3)     (2.6)     (3.4)     (2.8)     (2.6)     (2.3)     (1.9)     (2.0)     (2.0)     (2.0)     (2.0)     (2.0)       (2.0)
     Total CPI excluding
     the effect of the               1.9       2.1       2.9       3.0       2.6       1.9       1.0       1.2       1.5       1.8       1.9       1.9         2.0
     HST and changes in
     other indirect taxes
     (year-over-year                (1.9)     (2.1)     (2.9)     (2.8)     (2.5)     (2.3)     (1.9)     (2.0)     (2.0)     (2.0)     (2.0)     (2.0)       (2.0)
     percentage change)

     WTIb                            85         94       103        90        85       87        87        87        88        88        88        88          88
     (level)                        (85)       (94)     (103)      (97)      (98)     (100)     (101)     (102)     (102)     (103)     (103)     (103)      (103)

a. Figures in parentheses are from the base-case projection in the July Monetary Policy Report.
b. Assumptions for the price of West Texas Intermediate crude oil (US$ per barrel), based on an average of futures contracts over the two weeks ending 21 October 2011

Recent developments in the canadian economy dec2011

  • 1.
    Recent Developments inthe Canadian Economy December 2011 Dr. Farid Novin Bank of Canada
  • 2.
    Outline ๏‚ง World Economy ๏‚ง The United States ๏‚ง Canada and BC 2
  • 3.
  • 4.
    Global economic growthhas weakened considerably in recent months World manufacturing purchasing Balance of managersโ€™ index opinion 60 55 50 45 40 35 30 2007 2008 2009 2010 2011 Sources: JP Morgan and Markit 4
  • 5.
    Emerging economies continueto lead global growth Real GDP (y/y % change) 14 12 10 8 6 4 2 0 2006 2000 2001 2002 2003 2004 2005 2007 2008 2009 2010 2011 China India Source: IMF 5
  • 6.
    The recovery amongmajor economies continues to be uneven Real GDP Q/Q % at annual rate 10 5 0 -5 -10 -15 2011 2005 2006 2000 2001 2002 2003 2004 2007 2008 2009 2010 UK USA Japan Germany Canada Source: IMF, Stats Canada 6
  • 7.
    The euro areais projected to enter a mild recession at the end of 2011, followed by a modest recovery in mid-2012 Euro-area real GDP across economic cycles; start of recession = 100 Index 135 Start of the recession 130 Years before the 125 Years after the start of start of the the recession 120 115 110 105 100 95 90 -2 -1 0 1 2 3 4 5 6 Range of past recessions (1980 onward) The Big Five modern financial crises Current cycle
  • 8.
    Policy rates remainat or near historic lows in most advanced economies % 4.5 4.0 3.5 3.0 2.5 2.0 1.5 1.0 0.5 0.0 2008 2009 2010 2011 Canada United States Euro area Japan Source: Bank of Canada, US Federal Reserve, European Central Bank, Bank of Japan 8
  • 9.
    Large deficits remaina problem for many countries... Deficit as a % of GDP, all levels of government -5 -15 -25 2008 2009 2010 -35 Source: IMF 9
  • 10.
    Euro-area sovereigns, evensome larger core countries, are facing rising funding costs 10-year sovereign yield spreads over German bonds, basis points Basis points Basis points 2400 1400 2000 1200 1600 1000 800 1200 600 800 400 400 200 0 0 2008 2009 2010 2011 Greece (left scale) Ireland Portugal Spain Italy France Source: Bloomberg Last observation: 21 October 2011 10
  • 11.
  • 12.
    US GDP andFinal Domestic Demand (volume, y/y % change) 8 6 4 2 0 -2 -4 -6 1990 1991 1992 1993 1995 1997 1999 2000 2001 2002 2003 2004 2005 2006 2007 2008 2010 1994 1996 1998 2009 2011 GDP Final Domestic Demand 12
  • 13.
    U.S. real GDPgrowth is projected to remain modest, consistent with the historical experience after financial crises U.S. real GDP across economic cycles; Index start of recession = 100, quarterly data 135 130 Start of the recession 125 120 Years before Years after the start 115 the start of the of the recession 110 recession 105 100 95 90 -2 -1 0 1 2 3 4 5 6 Range of past U.S. recessions (1948 onward) The Big Five modern financial crises U.S. current cycle Base-case projection 13
  • 14.
    Quantitative easing hasled to an increase in the Federal Reserveโ€™s balance sheet Federal Reserve Assets, Trillions of US$ Federal Reserve Liabilities, Trillions of US$ 3 3 2 2 1 1 others TALF Swaps GA Depository Institutions CP loan facility TAC SFA MBS Other Reverse Repo Treasury's 0 Federal Reserve notes other liabilities 2008 0 2โ€ฆ 14
  • 15.
  • 16.
    Canadian GDP andFinal Domestic Demand (volume, y/y % change) 6 4 2 0 -2 -4 -6 2011 2010 2000 2001 2002 2003 2004 2005 2006 2007 2008 2009 GDP FDD Source: Statistics Canada 16
  • 17.
    Growth in Canadianreal GDP stalled in the second quarter as net exports plunged Contributions to real GDP growth % 8 6 4 2 0 -2 -4 -6 -8 -10 2006 2007 2008 2009 2010 2011 Real gross domestic product Real final domestic demand Net exports Source: Statistics Canada
  • 18.
    Real GDP growthis expected to pick up through 2012, resulting in a gradual absorption of excess supply % 6 3 0 -3 -6 -9 2007 2008 2009 2010 2011 2012 2013 Quarter-over-quarter percentage change in real GDP, at annual rates Base-case projection Year-over-year percentage change in real GDP Sources: Statistics Canada and Bank of Canada projections 18
  • 19.
    Domestic demand isprojected to remain the primary driver of growth Percentage Contributions to real GDP growth points 6 4 2 0 -2 -4 -6 2009 2010 2011 2012 2013 Inventories Net exports Government Business fixed investment Housing Consumption Sources: Statistics Canada and Bank of Canada calculations and projections
  • 20.
    Business fixed investmentis projected to remain robust Comparison of real business fixed investment across economic cycles; quarter before the downturn in real GDP = 100, quarterly data Index 115 Years before the downturn in 110 real GDP 105 100 95 90 Years before the 85 Years after downturn the downturn 80 75 -1 0 1 2 3 4 5 Current cycle 1990-92 cycle 1981-82 cycle Sources: Statistics Canada and Bank of Canada calculations and projections 20
  • 21.
    Private and PublicSector Investment (y/y % change) 20% 15% 10% 5% 0% -5% -10% -15% -20% 2011* 2000 2001 2002 2003 2004 2005 2006 2007 2008 2009 2010 BC Canada * Intentions Source: Stats Canada
  • 22.
    Employment has nearlyreturned to pre-recession levels in B.C. Index 2006Q1=100 110 108 106 104 102 100 98 96 94 2006 2007 2008 2009 2010 2011 B.C. Canada Source: Statistics Canada 22
  • 23.
    Commodity prices Index 2006=100 250 200 150 100 50 0 2006 2007 2008 2009 2010 2011 Oil Copper Lumber Nat. Gas Source: Bank of Canada 23
  • 24.
    BCโ€™s forestry industryhas been severely affected by the US housing recession Exports ($millions) 12,000 10,000 8,000 6,000 4,000 2,000 0 2011YTD 2002 2010 2000 2001 2003 2004 2005 2006 2007 2008 Wood products Pulp & paper products 2009 Source: BC Stats
  • 25.
    However, efforts togrow Chinese demand for BCโ€™s softwood lumber have been very successful Growth in value of softwood Share of BC softwood lumber exports to China lumber exports by value 120 (y/y% change) (%) 80 100 70 60 80 50 40 60 30 40 20 10 20 0 2011YTD 2004 2008 2000 2001 2002 2003 2005 2006 2007 2009 2010 0 2011YTD 2006 2007 2008 2009 2010 Source: BC Stats United States Japan China 25
  • 26.
    Capacity pressures haveeased in recent months % % 3 70 60 2 50 1 40 0 30 -1 20 -2 10 -3 0 -4 2006 2007 2008 2009 2010 2011 Some and significant difficulty* (left scale) Labour shortages** (left scale) Conventional measure of the output gap*** (right scale) 26
  • 27.
    Table 1: Projectionfor global economic growth Share of real Projected growth (per cent)b global GDPa (per cent) 2010 2011 2012 2013 United States 20 3.0 (2.9) 1.7 (2.4) 1.7 (3.2) 3.3 (3.3) Euro Area 15 1.7 (1.7) 1.5 (2.0) 0.2 (1.6) 1.5 (1.9) Japan 6 4.0 (4.0) -0.6 (-0.6) 2.0 (2.9) 2.5 (3.0) China 13 10.4 (10.3) 9.1 (9.3) 8.2 (8.6) 8.2 (8.1) Rest of the world 46 5.7 (5.5) 4.3 (4.2) 3.3 (3.8) 3.4 (3.6) World 100 5.1 (5.0) 3.8 (3.9) 3.1 (4.0) 3.7 (3.9) a. GDP shares are based on IMF estimates of the purchasing-power-parity (PPP) valuation of country GDPs for 2010. Source: IMF, WEO, September 2011 b. Numbers in parentheses are projections used for the July 2011 Monetary Policy Report. Source: Bank of Canada
  • 28.
    Table 2: Contributionsto average annual real GDP growth Percentage pointsa 2010 2011 2012 2013 Consumption 2.0 (2.0) 1.0 (1.3) 1.2 (1.6) 1.4 (1.1) Housing 0.7 (0.7) 0.1 (0.1) 0.0 (0.0) 0.1 (0.0) Government 1.2 (1.2) 0.3 (-0.1) -0.1 (-0.3) 0.3 (0.2) Business fixed investment 0.8 (0.8) 1.4 (1.6) 0.7 (1.1) 1.0 (0.7) Subtotal: Final domestic demand 4.7 (4.7) 2.8 (2.9) 1.8 (2.4) 2.8 (2.0) Exports 1.8 (1.8) 1.2 (1.3) 0.9 (1.1) 1.1 (1.1) Imports -4.0 (-4.0) -2.1 (-1.7) -0.7 (-0.8) -1.0 (-1.0) Subtotal: Net exports -2.1 (-2.1) -0.9 (-0.4) 0.2 (0.3) 0.1 (0.1) Inventories 0.6 (0.6) 0.2 (0.3) -0.1 (-0.1) 0.0 (0.0) GDP 3.2 (3.2) 2.1 (2.8) 1.9 (2.6) 2.9 (2.1) Memo items: 1.6 (1.6) 1.6 (1.8) 2.0 (2.0) 2.1 (2.1) Potential output Real gross domestic income (GDI) 5.0 (5.0) 2.8 (4.1) 1.1 (2.9) 3.6 (2.2) a. Figures in parentheses are from the base-case projection in the July 2011 Monetary Policy Report. Those for potential output are from Technical Box 2 in this Report.
  • 29.
    Table 3: Summaryof the base-case projection for Canadaa 2010 2011 2012 2013 Q4 Q1 Q2 Q3 Q4 Q1 Q2 Q3 Q4 Q1 Q2 Q3 Q4 Real GDP 3.1 3.6 -0.4 2.0 0.8 1.9 2.5 3.0 3.0 3.0 3.0 3.0 3.0 (quarter-over-quarter percentage change at annual rates) (3.1) (3.9) (1.5) (2.8) (2.9) (2.9) (2.6) (2.5) (2.1) (2.1) (2.1) (2.1) (2.1) Real GDP 3.3 2.9 2.2 2.1 1.5 1.1 1.8 2.1 2.6 2.9 3.0 3.0 2.9 (year-over-year percentage change) (3.3) (2.9) (2.7) (2.8) (2.8) (2.5) (2.8) (2.7) (2.5) (2.3) (2.1) (2.1) (2.1) Core inflation 1.6 1.3 1.6 1.9 2.0 1.8 1.7 1.7 1.6 1.8 1.9 1.9 2.0 (year-over-year percentage change) (1.6) (1.3) (1.7) (1.9) (2.0) (2.1) (2.0) (2.0) (2.0) (2.0) (2.0) (2.0) (2.0) Total CPI 2.3 2.6 3.4 3.0 2.7 1.9 1.0 1.2 1.5 1.8 1.9 1.9 2.0 (year-over-year percentage change) (2.3) (2.6) (3.4) (2.8) (2.6) (2.3) (1.9) (2.0) (2.0) (2.0) (2.0) (2.0) (2.0) Total CPI excluding the effect of the 1.9 2.1 2.9 3.0 2.6 1.9 1.0 1.2 1.5 1.8 1.9 1.9 2.0 HST and changes in other indirect taxes (year-over-year (1.9) (2.1) (2.9) (2.8) (2.5) (2.3) (1.9) (2.0) (2.0) (2.0) (2.0) (2.0) (2.0) percentage change) WTIb 85 94 103 90 85 87 87 87 88 88 88 88 88 (level) (85) (94) (103) (97) (98) (100) (101) (102) (102) (103) (103) (103) (103) a. Figures in parentheses are from the base-case projection in the July Monetary Policy Report. b. Assumptions for the price of West Texas Intermediate crude oil (US$ per barrel), based on an average of futures contracts over the two weeks ending 21 October 2011

Editor's Notes

  • #26ย The one bright spot for the forest industry is the growth in Chinese demand for softwood lumber over the past few years. This growth is the result of efforts by both the industry and the BC government to educate Chinese builders in the use of lumber for building construction and in working with Chinese authorities to change building codes.China is now the number two destination for BC forestry exports, which includes pulp & paper products, exceeding Japan for the first time.