SlideShare a Scribd company logo
Population: 10 million
         DOMINICAN REPUBLIC                                                                                                        Area: 48,072 sq km (18,696 sq miles)


                                                                  MAIN ECONOMIC INDICATORS
                                                              2000         2001        2002                   2003     2004     2005    2006      2007      2008     2009     2010
                  GDP ($US, billions)                         23.7          24.6       22.3                   20.2      21.6    33.6     35.3     41.0      45.6     46.7     50.1

                   GDP (% change)                              5.7          1.8         5.8                   -0.3      1.3      9.3     10.7      8.5       5.3      3.5      3.5

                GDP per capita ($US)                         2,982         3,053       2,728                  2,437    2,568    3,934   4,081     4,668     5,117    5,176    5,464

    Current account balance ($US, billions)                   -1.01        -0.74       -0.71                  1.03      1.04    -0.47    -1.28    -2.17     -4.51    -2.34    -3.06

     Current account balance (% of GDP)                       -4.3          -3.0       -3.2                    5.1      4.8     -1.4     -3.6      -5.3      -9.9     -5.0    -6.1

                 Inflation (% change)                          7.7          8.9         5.2                   27.5      51.5     4.2      7.6      6.1      10.6      1.5      6.5

                Unemployment+ (%)                              14            16         16                     17        18      11       10       16         -           -     -

                        GDP (% change)             Inflation (% change)                                                         GDP        Current account balance


         49.6                                                                                                  50.0

         39.6                                                                                                  40.0

                                                                                                               30.0

                                                                                               $US Billions
         29.6
     %
         19.6                                                                                                  20.0


          9.6                                                                                                  10.0

                                                                                                                0.0
         -0.4
                 2000 2001 2002 2003 2004 2005 2006 2007 2008 2009 2010                                                2000 2001 2002 2003 2004 2005 2006 2007 2008 2009 2010
                                                                                                               -10.0
                                                                      Source: IMF World Economic Outlook April 2010
+
 Source: The World Bank - http://databank.worldbank.org
*Numbers in italics represent estimates
Population: 10 million
      DOMINICAN REPUBLIC                                                                                         Area: 48,072 sq km (18,696 sq miles)


                                                     MAIN TRADE INDICATORS – GOODS
                                                                          2006                         2007                      2008                    2009
          Trade Balance ($US thousands)                                 -5,464,080                  -7,656,050             -10,768,422             -7,361,175
       Total Exported Value ($US thousands)                             6,790,320                    5,681,980              5,569,806               4,693,264
       Total Imported Value ($US thousands)                            12,254,400                   13,338,030              16,338,228             12,054,439

            Top 10 Markets by % of Total Exported Value (2009)                                   Top 10 Markets by % of Total Imported Value (2009)

United States of America                                               62%           United States of America                                               42%
                    Haiti            14%                                                                China              10%
            Netherlands         2%                                                                 Venezuela          5%
                   China        2%                                                                     Mexico        4%
                   Spain        2%                                                                  Colombia         4%
        United Kingdom          2%                                                       Trinidad and Tobago        3%
                 Belgium        2%                                                                      Brazil     2%
                   Japan       1%                                                                       Spain      2%
                Germany        1%                                                                    Germany       2%
                 Jamaica       1%                                                                  Costa Rica     2%


             Top 5 Exports by % of Total Exported Value (2009)                       Vehicles   Top 5 Imports by % of Total Imported Value (2009)
                                                                                   other than
                                                     Plastics and                    railway,
                                                   articles thereof,              tramway, 5%
  Optical, photo,                                                                                                                        Plastics and
                                                          7%                                   Mineral fuels,
    technical,                                                                                                                         articles thereof,
                                                    Tobacco and                               oils, distillation                              6%
     medical
                                                    manufactured                              products, 21%
  apparatus, 14%
                                                      tobacco
                                                   substitutes, 7%                                                                          Nuclear
                                                                                                                                           reactors,
                     Electrical,                 Articles of                                                                                boilers,
                     electronic                 apparel (not                                               Electrical,                   machinery, 8%
                    equipment,                knit or crochet),                                            electronic
                        10%                          8%                                                  equipment, 9%
                                                        Source: International Trade Centre – www.trademap.org
Population: 10 million
     DOMINICAN REPUBLIC                                                                                        Area: 48,072 sq km (18,696 sq miles)


                                                 MAIN TRADE INDICATORS – SERVICES
                                                                          2004               2005                     2006              2007            2008
           Trade Balance ($US thousands)                             2,290,700             2,456,800            2,985,000          3,020,900          3,092,600
        Total Exported Value ($US thousands)                         3,503,870             3,935,000            4,567,200          4,794,100          4,938,600
        Total Imported Value ($US thousands)                         1,213,170             1,478,200            1,582,200          1,773,200          1,846,000

             Top Exports by % of Total Exported Value (2008)                                  Top Imports by % of Total Imported Value (2008)

                          Travel                                    85%                           Transportation                                               63%

                 Transportation          8%                                                                  Travel               17%

                                                                                               Insurance services            6%
       Communications services       3%
                                                                                            Government services              5%
         Other business services    2%
                                                                                        Communications services          2%
           Government services      1%
                                                                                          Other business services        2%
              Insurance services    1%
                                                                                          Royalties & license fees       2%
               Financial services   0.3%                                                        Financial services      2%

Computer & information services     0.3%                                         Computer & information services        1%

                                                     Source: International Trade Centre – www.trademap.org

More Related Content

What's hot

045 Presentacion%20 Colombia%20 December%202009%20(Ingles)
045 Presentacion%20 Colombia%20 December%202009%20(Ingles)045 Presentacion%20 Colombia%20 December%202009%20(Ingles)
045 Presentacion%20 Colombia%20 December%202009%20(Ingles)amigueldiaz
 
Presentation jbs fixed income
Presentation jbs fixed incomePresentation jbs fixed income
Presentation jbs fixed incomeJBS RI
 
Roberto Coronado, Outlook for the El Paso-Juarez Region, Federal Reserve Bank...
Roberto Coronado, Outlook for the El Paso-Juarez Region, Federal Reserve Bank...Roberto Coronado, Outlook for the El Paso-Juarez Region, Federal Reserve Bank...
Roberto Coronado, Outlook for the El Paso-Juarez Region, Federal Reserve Bank...The Paso del Norte Group
 
Moz public invst-agriculture
Moz public invst-agricultureMoz public invst-agriculture
Moz public invst-agricultureIFPRI-Maputo
 
Lesson 8 presentation
Lesson 8 presentationLesson 8 presentation
Lesson 8 presentationrhernande128
 
Statistical profile
Statistical profileStatistical profile
Statistical profilecarrieriddle
 
09 11 10 Web 2.0 Weekly
09 11 10 Web 2.0 Weekly09 11 10 Web 2.0 Weekly
09 11 10 Web 2.0 WeeklyDavid Shore
 
Google student survey p4
Google student survey p4Google student survey p4
Google student survey p4liana1995
 
enterpriseSeattle Forecast 2012 - Ken Goldstein
enterpriseSeattle Forecast 2012 - Ken GoldsteinenterpriseSeattle Forecast 2012 - Ken Goldstein
enterpriseSeattle Forecast 2012 - Ken GoldsteinenterpriseSeattle
 
100804 apresentação de resultados 2 t10-inglês_sem script [modo de compatib...
100804   apresentação de resultados 2 t10-inglês_sem script [modo de compatib...100804   apresentação de resultados 2 t10-inglês_sem script [modo de compatib...
100804 apresentação de resultados 2 t10-inglês_sem script [modo de compatib...Multiplus
 
09 03 17 Web 2.0 Weekly
09 03 17 Web 2.0 Weekly09 03 17 Web 2.0 Weekly
09 03 17 Web 2.0 WeeklyDavid Shore
 
Presentacion invierta en colombia abril 2010
Presentacion invierta en colombia abril 2010Presentacion invierta en colombia abril 2010
Presentacion invierta en colombia abril 2010Mariano Dom
 
terex KeyBanc060508
terex KeyBanc060508terex KeyBanc060508
terex KeyBanc060508finance42
 

What's hot (18)

Trinidad & Tobago - Trade Profile [UWI's Shridath Ramphal Centre]
Trinidad & Tobago - Trade Profile [UWI's Shridath Ramphal Centre]Trinidad & Tobago - Trade Profile [UWI's Shridath Ramphal Centre]
Trinidad & Tobago - Trade Profile [UWI's Shridath Ramphal Centre]
 
St. Kitts & Nevis - Trade Profile [UWI's Shridath Ramphal Centre]
St. Kitts & Nevis -  Trade Profile [UWI's Shridath Ramphal Centre]St. Kitts & Nevis -  Trade Profile [UWI's Shridath Ramphal Centre]
St. Kitts & Nevis - Trade Profile [UWI's Shridath Ramphal Centre]
 
St. Lucia - Trade Profile [UWI's Shridath Ramphal Centre]
St. Lucia - Trade Profile [UWI's Shridath Ramphal Centre]St. Lucia - Trade Profile [UWI's Shridath Ramphal Centre]
St. Lucia - Trade Profile [UWI's Shridath Ramphal Centre]
 
Jamaica - Trade Profile [UWI's Shridath Ramphal Centre]
Jamaica -  Trade Profile [UWI's Shridath Ramphal Centre]Jamaica -  Trade Profile [UWI's Shridath Ramphal Centre]
Jamaica - Trade Profile [UWI's Shridath Ramphal Centre]
 
Suriname - Trade Profile [UWI's Shridath Ramphal Centre]
Suriname -  Trade Profile [UWI's Shridath Ramphal Centre]Suriname -  Trade Profile [UWI's Shridath Ramphal Centre]
Suriname - Trade Profile [UWI's Shridath Ramphal Centre]
 
045 Presentacion%20 Colombia%20 December%202009%20(Ingles)
045 Presentacion%20 Colombia%20 December%202009%20(Ingles)045 Presentacion%20 Colombia%20 December%202009%20(Ingles)
045 Presentacion%20 Colombia%20 December%202009%20(Ingles)
 
Presentation jbs fixed income
Presentation jbs fixed incomePresentation jbs fixed income
Presentation jbs fixed income
 
Roberto Coronado, Outlook for the El Paso-Juarez Region, Federal Reserve Bank...
Roberto Coronado, Outlook for the El Paso-Juarez Region, Federal Reserve Bank...Roberto Coronado, Outlook for the El Paso-Juarez Region, Federal Reserve Bank...
Roberto Coronado, Outlook for the El Paso-Juarez Region, Federal Reserve Bank...
 
Moz public invst-agriculture
Moz public invst-agricultureMoz public invst-agriculture
Moz public invst-agriculture
 
Lesson 8 presentation
Lesson 8 presentationLesson 8 presentation
Lesson 8 presentation
 
Statistical profile
Statistical profileStatistical profile
Statistical profile
 
09 11 10 Web 2.0 Weekly
09 11 10 Web 2.0 Weekly09 11 10 Web 2.0 Weekly
09 11 10 Web 2.0 Weekly
 
Google student survey p4
Google student survey p4Google student survey p4
Google student survey p4
 
enterpriseSeattle Forecast 2012 - Ken Goldstein
enterpriseSeattle Forecast 2012 - Ken GoldsteinenterpriseSeattle Forecast 2012 - Ken Goldstein
enterpriseSeattle Forecast 2012 - Ken Goldstein
 
100804 apresentação de resultados 2 t10-inglês_sem script [modo de compatib...
100804   apresentação de resultados 2 t10-inglês_sem script [modo de compatib...100804   apresentação de resultados 2 t10-inglês_sem script [modo de compatib...
100804 apresentação de resultados 2 t10-inglês_sem script [modo de compatib...
 
09 03 17 Web 2.0 Weekly
09 03 17 Web 2.0 Weekly09 03 17 Web 2.0 Weekly
09 03 17 Web 2.0 Weekly
 
Presentacion invierta en colombia abril 2010
Presentacion invierta en colombia abril 2010Presentacion invierta en colombia abril 2010
Presentacion invierta en colombia abril 2010
 
terex KeyBanc060508
terex KeyBanc060508terex KeyBanc060508
terex KeyBanc060508
 

Similar to Dominican Republic -Trade Profile UWI's Shridath Ramphal Centre

Perú ProinversióN
Perú ProinversióNPerú ProinversióN
Perú ProinversióNLuis
 
Economy of USA- An Current overview
Economy of USA- An Current overviewEconomy of USA- An Current overview
Economy of USA- An Current overviewRaj Kumar Singh
 
Profarma 4 q11
Profarma 4 q11Profarma 4 q11
Profarma 4 q11Profarma
 
Profarma 4Q10
Profarma 4Q10Profarma 4Q10
Profarma 4Q10Profarma
 
Profarma 4Q10
Profarma 4Q10Profarma 4Q10
Profarma 4Q10Profarma
 
2002* 2002 Farnborough Air Show Financial Results In Us Gaap
2002* 2002 Farnborough Air Show   Financial Results In Us Gaap2002* 2002 Farnborough Air Show   Financial Results In Us Gaap
2002* 2002 Farnborough Air Show Financial Results In Us GaapEmbraer RI
 
Sectoral Economic Development Strategy
Sectoral Economic Development StrategySectoral Economic Development Strategy
Sectoral Economic Development Strategyedunetwork
 
FY 2010 Results & Plan - F. Bertone
FY 2010 Results & Plan - F. BertoneFY 2010 Results & Plan - F. Bertone
FY 2010 Results & Plan - F. BertoneGruppo TIM
 
[Gleap] Agribank Report
[Gleap] Agribank Report[Gleap] Agribank Report
[Gleap] Agribank ReportKhiem Duong
 
Earnings Release 4 Q07
Earnings Release 4 Q07Earnings Release 4 Q07
Earnings Release 4 Q07Profarma
 
Earnings Release 4Q07 Presentation
Earnings Release 4Q07 PresentationEarnings Release 4Q07 Presentation
Earnings Release 4Q07 PresentationProfarma
 
2005 - 5th Us Analyst And Investor Meeting Financials
2005 - 5th Us Analyst And Investor Meeting   Financials2005 - 5th Us Analyst And Investor Meeting   Financials
2005 - 5th Us Analyst And Investor Meeting FinancialsEmbraer RI
 
Earnings Release 2 Q07
Earnings Release 2 Q07Earnings Release 2 Q07
Earnings Release 2 Q07Profarma
 
arnings Release 2Q07 Presentation
arnings Release 2Q07 Presentationarnings Release 2Q07 Presentation
arnings Release 2Q07 PresentationProfarma
 

Similar to Dominican Republic -Trade Profile UWI's Shridath Ramphal Centre (20)

Perú ProinversióN
Perú ProinversióNPerú ProinversióN
Perú ProinversióN
 
Proexport
ProexportProexport
Proexport
 
Ind aag
Ind aagInd aag
Ind aag
 
Economy of USA- An Current overview
Economy of USA- An Current overviewEconomy of USA- An Current overview
Economy of USA- An Current overview
 
Profarma 4 q11
Profarma 4 q11Profarma 4 q11
Profarma 4 q11
 
Profarma 4Q10
Profarma 4Q10Profarma 4Q10
Profarma 4Q10
 
Profarma 4Q10
Profarma 4Q10Profarma 4Q10
Profarma 4Q10
 
2002* 2002 Farnborough Air Show Financial Results In Us Gaap
2002* 2002 Farnborough Air Show   Financial Results In Us Gaap2002* 2002 Farnborough Air Show   Financial Results In Us Gaap
2002* 2002 Farnborough Air Show Financial Results In Us Gaap
 
Sectoral Economic Development Strategy
Sectoral Economic Development StrategySectoral Economic Development Strategy
Sectoral Economic Development Strategy
 
FY 2010 Results & Plan - F. Bertone
FY 2010 Results & Plan - F. BertoneFY 2010 Results & Plan - F. Bertone
FY 2010 Results & Plan - F. Bertone
 
Brazil
BrazilBrazil
Brazil
 
David Geisen
David GeisenDavid Geisen
David Geisen
 
[Gleap] Agribank Report
[Gleap] Agribank Report[Gleap] Agribank Report
[Gleap] Agribank Report
 
Earnings Release 4 Q07
Earnings Release 4 Q07Earnings Release 4 Q07
Earnings Release 4 Q07
 
Earnings Release 4Q07 Presentation
Earnings Release 4Q07 PresentationEarnings Release 4Q07 Presentation
Earnings Release 4Q07 Presentation
 
2005 - 5th Us Analyst And Investor Meeting Financials
2005 - 5th Us Analyst And Investor Meeting   Financials2005 - 5th Us Analyst And Investor Meeting   Financials
2005 - 5th Us Analyst And Investor Meeting Financials
 
Cs207 4
Cs207 4Cs207 4
Cs207 4
 
The real estate sector presentation
The real estate   sector presentationThe real estate   sector presentation
The real estate sector presentation
 
Earnings Release 2 Q07
Earnings Release 2 Q07Earnings Release 2 Q07
Earnings Release 2 Q07
 
arnings Release 2Q07 Presentation
arnings Release 2Q07 Presentationarnings Release 2Q07 Presentation
arnings Release 2Q07 Presentation
 

More from Office of Trade Negotiations (OTN), CARICOM Secretariat

More from Office of Trade Negotiations (OTN), CARICOM Secretariat (20)

WEF Global Competitiveness Report 2014-15
WEF Global Competitiveness Report 2014-15WEF Global Competitiveness Report 2014-15
WEF Global Competitiveness Report 2014-15
 
2014 Annual Report - World Trade Organization (WTO)
2014 Annual Report - World Trade Organization (WTO)2014 Annual Report - World Trade Organization (WTO)
2014 Annual Report - World Trade Organization (WTO)
 
the Association of Caribbean States (ACS): 1994-2014 - 20 Years Promoting Coo...
the Association of Caribbean States (ACS): 1994-2014 - 20 Years Promoting Coo...the Association of Caribbean States (ACS): 1994-2014 - 20 Years Promoting Coo...
the Association of Caribbean States (ACS): 1994-2014 - 20 Years Promoting Coo...
 
TTIP: The Economic Analysis Explained
TTIP: The Economic Analysis ExplainedTTIP: The Economic Analysis Explained
TTIP: The Economic Analysis Explained
 
2014 National Trade Estimate Report on Foreign Trade Barriers
2014 National Trade Estimate Report on Foreign Trade Barriers2014 National Trade Estimate Report on Foreign Trade Barriers
2014 National Trade Estimate Report on Foreign Trade Barriers
 
OTN - Private Sector Trade Note - Vol 2 2014 - CARICOM-Ghana Trade
OTN - Private Sector Trade Note - Vol 2 2014 - CARICOM-Ghana TradeOTN - Private Sector Trade Note - Vol 2 2014 - CARICOM-Ghana Trade
OTN - Private Sector Trade Note - Vol 2 2014 - CARICOM-Ghana Trade
 
2014-03-03 OTN Special Update (The Focus of the WTO MC9)
2014-03-03 OTN Special Update (The Focus of the WTO MC9)2014-03-03 OTN Special Update (The Focus of the WTO MC9)
2014-03-03 OTN Special Update (The Focus of the WTO MC9)
 
OTN Special Update - Economic and Trade Policies Related to Diet and Obesity ...
OTN Special Update - Economic and Trade Policies Related to Diet and Obesity ...OTN Special Update - Economic and Trade Policies Related to Diet and Obesity ...
OTN Special Update - Economic and Trade Policies Related to Diet and Obesity ...
 
WTO Trade Facilitation Agreement - A Business Guide for Developing Countries ...
WTO Trade Facilitation Agreement - A Business Guide for Developing Countries ...WTO Trade Facilitation Agreement - A Business Guide for Developing Countries ...
WTO Trade Facilitation Agreement - A Business Guide for Developing Countries ...
 
OTN - Private Sector Trade Note - vol 4 2013
OTN - Private Sector Trade Note - vol 4 2013OTN - Private Sector Trade Note - vol 4 2013
OTN - Private Sector Trade Note - vol 4 2013
 
The CARICOM Common External Tariff (CET) – The Tariff Structure
The CARICOM Common External Tariff (CET) – The Tariff StructureThe CARICOM Common External Tariff (CET) – The Tariff Structure
The CARICOM Common External Tariff (CET) – The Tariff Structure
 
Innovation for Economic Performance the Case of Latin American Firms
Innovation for Economic Performance the Case of Latin American FirmsInnovation for Economic Performance the Case of Latin American Firms
Innovation for Economic Performance the Case of Latin American Firms
 
Caribbean Community Regional Aid for Trade Strategy 2013–2015 Caribbean Commu...
Caribbean Community Regional Aid for Trade Strategy 2013–2015 Caribbean Commu...Caribbean Community Regional Aid for Trade Strategy 2013–2015 Caribbean Commu...
Caribbean Community Regional Aid for Trade Strategy 2013–2015 Caribbean Commu...
 
CARIFESTA XI -Travel Guide
CARIFESTA XI -Travel GuideCARIFESTA XI -Travel Guide
CARIFESTA XI -Travel Guide
 
Details of the Post Technical Advisor Investment and Private Sector Office of...
Details of the Post Technical Advisor Investment and Private Sector Office of...Details of the Post Technical Advisor Investment and Private Sector Office of...
Details of the Post Technical Advisor Investment and Private Sector Office of...
 
CARICOM View: 40 years of integration, come celebrate with us
CARICOM View:     40 years of integration, come celebrate with usCARICOM View:     40 years of integration, come celebrate with us
CARICOM View: 40 years of integration, come celebrate with us
 
OTN - Private Sector Trade Note - Vol 3 2013
OTN - Private Sector Trade Note - Vol 3 2013OTN - Private Sector Trade Note - Vol 3 2013
OTN - Private Sector Trade Note - Vol 3 2013
 
Aid for Trade: Case Study - Caribbean Aid for Trade (AfT) and Regional Integr...
Aid for Trade: Case Study - Caribbean Aid for Trade (AfT) and Regional Integr...Aid for Trade: Case Study - Caribbean Aid for Trade (AfT) and Regional Integr...
Aid for Trade: Case Study - Caribbean Aid for Trade (AfT) and Regional Integr...
 
OTN Special Update - Innovation - A New Frontier in Trade Multilateralism [20...
OTN Special Update - Innovation - A New Frontier in Trade Multilateralism [20...OTN Special Update - Innovation - A New Frontier in Trade Multilateralism [20...
OTN Special Update - Innovation - A New Frontier in Trade Multilateralism [20...
 
WTO Report - The Future of Trade: The Challenges of Convergence
WTO Report - The Future of Trade: The Challenges of ConvergenceWTO Report - The Future of Trade: The Challenges of Convergence
WTO Report - The Future of Trade: The Challenges of Convergence
 

Dominican Republic -Trade Profile UWI's Shridath Ramphal Centre

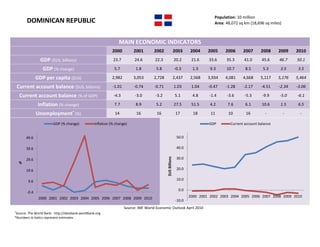
  • 1. Population: 10 million DOMINICAN REPUBLIC Area: 48,072 sq km (18,696 sq miles) MAIN ECONOMIC INDICATORS 2000 2001 2002 2003 2004 2005 2006 2007 2008 2009 2010 GDP ($US, billions) 23.7 24.6 22.3 20.2 21.6 33.6 35.3 41.0 45.6 46.7 50.1 GDP (% change) 5.7 1.8 5.8 -0.3 1.3 9.3 10.7 8.5 5.3 3.5 3.5 GDP per capita ($US) 2,982 3,053 2,728 2,437 2,568 3,934 4,081 4,668 5,117 5,176 5,464 Current account balance ($US, billions) -1.01 -0.74 -0.71 1.03 1.04 -0.47 -1.28 -2.17 -4.51 -2.34 -3.06 Current account balance (% of GDP) -4.3 -3.0 -3.2 5.1 4.8 -1.4 -3.6 -5.3 -9.9 -5.0 -6.1 Inflation (% change) 7.7 8.9 5.2 27.5 51.5 4.2 7.6 6.1 10.6 1.5 6.5 Unemployment+ (%) 14 16 16 17 18 11 10 16 - - - GDP (% change) Inflation (% change) GDP Current account balance 49.6 50.0 39.6 40.0 30.0 $US Billions 29.6 % 19.6 20.0 9.6 10.0 0.0 -0.4 2000 2001 2002 2003 2004 2005 2006 2007 2008 2009 2010 2000 2001 2002 2003 2004 2005 2006 2007 2008 2009 2010 -10.0 Source: IMF World Economic Outlook April 2010 + Source: The World Bank - http://databank.worldbank.org *Numbers in italics represent estimates
  • 2. Population: 10 million DOMINICAN REPUBLIC Area: 48,072 sq km (18,696 sq miles) MAIN TRADE INDICATORS – GOODS 2006 2007 2008 2009 Trade Balance ($US thousands) -5,464,080 -7,656,050 -10,768,422 -7,361,175 Total Exported Value ($US thousands) 6,790,320 5,681,980 5,569,806 4,693,264 Total Imported Value ($US thousands) 12,254,400 13,338,030 16,338,228 12,054,439 Top 10 Markets by % of Total Exported Value (2009) Top 10 Markets by % of Total Imported Value (2009) United States of America 62% United States of America 42% Haiti 14% China 10% Netherlands 2% Venezuela 5% China 2% Mexico 4% Spain 2% Colombia 4% United Kingdom 2% Trinidad and Tobago 3% Belgium 2% Brazil 2% Japan 1% Spain 2% Germany 1% Germany 2% Jamaica 1% Costa Rica 2% Top 5 Exports by % of Total Exported Value (2009) Vehicles Top 5 Imports by % of Total Imported Value (2009) other than Plastics and railway, articles thereof, tramway, 5% Optical, photo, Plastics and 7% Mineral fuels, technical, articles thereof, Tobacco and oils, distillation 6% medical manufactured products, 21% apparatus, 14% tobacco substitutes, 7% Nuclear reactors, Electrical, Articles of boilers, electronic apparel (not Electrical, machinery, 8% equipment, knit or crochet), electronic 10% 8% equipment, 9% Source: International Trade Centre – www.trademap.org
  • 3. Population: 10 million DOMINICAN REPUBLIC Area: 48,072 sq km (18,696 sq miles) MAIN TRADE INDICATORS – SERVICES 2004 2005 2006 2007 2008 Trade Balance ($US thousands) 2,290,700 2,456,800 2,985,000 3,020,900 3,092,600 Total Exported Value ($US thousands) 3,503,870 3,935,000 4,567,200 4,794,100 4,938,600 Total Imported Value ($US thousands) 1,213,170 1,478,200 1,582,200 1,773,200 1,846,000 Top Exports by % of Total Exported Value (2008) Top Imports by % of Total Imported Value (2008) Travel 85% Transportation 63% Transportation 8% Travel 17% Insurance services 6% Communications services 3% Government services 5% Other business services 2% Communications services 2% Government services 1% Other business services 2% Insurance services 1% Royalties & license fees 2% Financial services 0.3% Financial services 2% Computer & information services 0.3% Computer & information services 1% Source: International Trade Centre – www.trademap.org