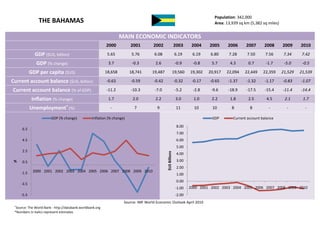
The document provides economic and trade indicators for The Bahamas from 2000-2010. It shows that the Bahamas' GDP grew between 2000-2008 but declined in 2009, while inflation has remained between 1-4.5% annually. The country runs a large current account deficit, between -11.2% to -18.9% of GDP. The top export partner is the US, while the top imports are from the US and include mineral fuels, vehicles, and electrical equipment. The trade deficit in goods widened over 2004-2008 but the services trade balance was positive.
Jtc200 worm gear screw lifter,20000kg rotating screw jack,20ton travelling nut screw jack,20 t 4 ft worm gear lift jack,200 kn worm screw lift assembly,20 tonnes cubical gearbox screw jack static load capacity 200 kn, high speed torque 146 n.m, low speed torque 48 n.m. lead screw (spindle) Tr70x10. high speed gear ratio 1/10, low speed gear ratio 1/40. upright or inverted translating screw, rotating screw and keyed screw configurations. precision positioning, self locking lead screw which support the loads and hold position without brake mechamism. hand wheel or hand crank manual operation, or single phase or three phases electric motor driven, gear motor driven or dc 24v gear reduction motor drives. thread end, clevis end, plain end, forked head and top plate (flange type) for lead screw (spindle) end types. customized various length stroke, under tension load, maximum 3000 mm stroke. single screw jack or multiple screw jacks system arrangements.
The Global Competitiveness Report 2014-2015, produced and published online by the World Economic Forum (WEF), assesses the competitiveness landscape of 144 economies based on a review of twelve broad factors that affect competitiveness. The twelve are the Institutional Environment; Infrastructure; Macroeconomic Environment; Health and Primary Education; Higher Education and Learning; Goods Market Efficiency; Labour Market Efficiency; Financial Market Development; Technological Readiness; Market Size; Business Sophistication; and Innovation. The report includes an assessment of the economies of Barbados, the Dominican Republic, Guyana, Haiti, Jamaica, and Trinidad and Tobago.
The 2014 Annual Report is split into three main sections. The first contains a message from the WTO Director-General. The second section provides a brief overview of 2013 and some background information on the WTO, while the third has more in-depth information.
The European Commission’s assessment of the likely benefits of the Transatlantic Trade and Investment Partnership
(TTIP) is based on analysis carried out by the Centre for Economic Policy Research, a leading
independent pan-European economic research organization. Given the significance of TTIP, this analysis
has been widely discussed in policy debates, in the press, on social media. The material provided in this
document attempts to answer some of the questions that have been raised in those contexts.
The Office of the United States Trade Representative (USTR) is responsible for the preparation of this report. U.S. Trade Representative Michael Froman gratefully acknowledges the contributions of all USTR staff to the writing and production of this report and notes, in particular, the contributions of Brittany Bauer, Colby Clark, and Michael Roberts. Thanks are extended to partner Executive Branch agencies, including the Environmental Protection Agency and the Departments of Agriculture, Commerce, Health and Human Services, Justice, Labor, State, and Treasury. In preparing the report, substantial information was solicited from U.S. Embassies around the world and from interested stakeholders. The draft of this report was circulated through the interagency Trade Policy Staff Committee. March 2014Wto2014 0918a
This guide helps businesses take advantage of the WTO Trade Facilitation Agreement. The agreement simplifies customs procedures, allowing businesses to become more competitive. This jargon-free guide explains the provisions with a focus on what businesses need to know to take advantage of the agreement. It will also help policy makers identify their needs for technical assistance to implement and monitor it. - See more at: http://www.intracen.org/wto-trade-facilitation-agreement-business-guide-for-developing-countries/#sthash.UA1o6V3G.dpuf
This Working Paper was published by United Nations University Maastricht Economic and social Research Institute on Innovation and Technology (UNU-MERIT). It seeks to provide insights about the main characteristics of innovative firms and to gather new evidence with regard to the nature of the innovation process in the Latin American and Caribbean region. This Paper analyses data from a number of CARICOM countries.
Details for persons who are interested in attending the Caribbean Festival of the Arts (CARIFESTA) scheduled for Suriname from 16-25 August 2013 under the theme “CULTURE FOR DEVELOPMENT, Celebrating our Diversity and Promoting the Central Role of Culture in Economic, Social and Human Development”
The Panel on Defining the Future of Trade was established in 2012. The Panel was mandated to: “….examine and analyse challenges to global trade opening in the 21st century” against the background of profound transformations occurring in the world economy, looking “at the drivers of today’s and tomorrow’s trade, […] at trade patterns and at what it means to open global trade in the 21st century, bearing in mind the role of trade in contributing to sustainable development, growth, jobs and poverty alleviation.” This is the Report of the Panel.
More from Office of Trade Negotiations (OTN), CARICOM Secretariat (20)
WTO Report - The Future of Trade: The Challenges of Convergence
The Bahamas - Trade Profile UWI's Shridath Ramphal Centre
1. Population: 342,000
THE BAHAMAS Area: 13,939 sq km (5,382 sq miles)
MAIN ECONOMIC INDICATORS
2000 2001 2002 2003 2004 2005 2006 2007 2008 2009 2010
GDP ($US, billion) 5.65 5.76 6.08 6.19 6.19 6.80 7.28 7.50 7.56 7.34 7.42
GDP (% change) 3.7 -0.3 2.6 -0.9 -0.8 5.7 4.3 0.7 -1.7 -5.0 -0.5
GDP per capita ($US) 18,658 18,741 19,487 19,560 19,302 20,917 22,094 22,449 22,359 21,529 21,539
Current account balance ($US, billion) -0.63 -0.59 -0.42 -0.32 -0.17 -0.65 -1.37 -1.32 -1.17 -0.83 -1.07
Current account balance (% of GDP) -11.2 -10.3 -7.0 -5.2 -2.8 -9.6 -18.9 -17.5 -15.4 -11.4 -14.4
Inflation (% change) 1.7 2.0 2.2 3.0 1.0 2.2 1.8 2.5 4.5 2.1 1.7
Unemployment+ (%) - 7 9 11 10 10 8 8 - - -
GDP (% change) Inflation (% change) GDP Current account balance
8.00
6.5
7.00
4.5 6.00
5.00
2.5
$US Billions
4.00
% 0.5 3.00
2.00
-1.5 2000 2001 2002 2003 2004 2005 2006 2007 2008 2009 2010
1.00
0.00
-3.5
-1.00 2000 2001 2002 2003 2004 2005 2006 2007 2008 2009 2010
-5.5 -2.00
Source: IMF World Economic Outlook April 2010
+
Source: The World Bank - http://databank.worldbank.org
*Numbers in italics represent estimates
2. Population: 342,000
THE BAHAMAS Area: 13,939 sq km (5,382 sq miles)
MAIN TRADE INDICATORS – GOODS
2004 2005 2006 2007 2008
Trade Balance ($US thousands) -1,574,828 -2,295,828 -2,474,890 -2,432,625 -2,528,440
Total Exported Value ($US thousands) 401,311 270,849 509,420 669,977 701,529
Total Imported Value ($US thousands) 1,976,139 2,566,677 2,984,310 3,102,602 3,229,969
Top 10 Markets by % of Total Exported Value (2008) Top 10 Markets by % of Total Imported Value (2008)
United States of America 70% United States of America 87%
Canada 5% Venezuela 5%
Germany 4% Netherland Antilles 2%
France 4% Trinidad and Tobago 1%
Netherlands 3% Japan 1%
Nigeria 2% United Kingdom 0.4%
Turks & Caicos Islands 2% Canada 0.4%
Mexico 1% Switzerland 0.4%
United Kingdom 1% France 0.3%
Argentina 1% Cuba 0.3%
Top 5 Exports by % of Total Exported Value (2008) Salt, sulphur, Works of art, Top 5 Imports by % of Total Imported Value (2008)
earth, stone, collectors
plaster, lime pieces and Vehicles other
Plastics and than railway,
and cement, antiques, 4%
articles thereof, tramway, 5%
Organic 6%
22%
chemicals, 11%
Electrical,
Mineral fuels, electronic
Fish, oils, distillation equipment, 5%
crustaceans, products, etc,
Nuclear
molluscs, 26%
Mineral fuels, reactors,
oils, distillation aquatic boilers,
products, etc, invertebrates machinery, etc,
20% nes, 12% 8%
Source: International Trade Centre – www.trademap.org
3. Population: 342,000
THE BAHAMAS Area: 13,939 sq km (5,382 sq miles)
MAIN TRADE INDICATORS – SERVICES
2004 2005 2006 2007 2008
Trade Balance ($US thousands) 1,012,780 1,224,490 825,210 1,019,730 1,190,625
Total Exported Value ($US thousands) 2,244,080 2,510,900 2,436,080 2,599,350 2,543,322
Total Imported Value ($US thousands) 1,231,300 1,286,410 1,610,870 1,579,620 1,352,697
Top Exports by % of Total Exported Value (2008) Top Imports by % of Total Imported Value (2008)
Other business services 33%
Travel 85%
Transportation 26%
Travel 23%
Other business services 12% Insurance services 8%
Government services 7%
Transportation 2% Construction services 2%
Royalties and license fees 1%
Personal, cultural & recreational services 0.1%
Government services 2%
Communications services 0.1%
Source: International Trade Centre – www.trademap.org