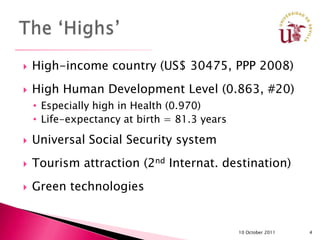
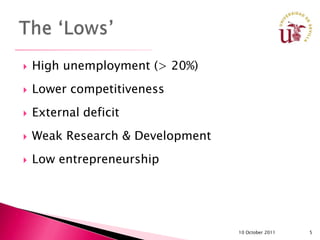
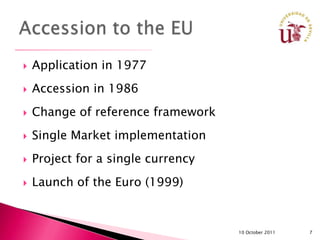
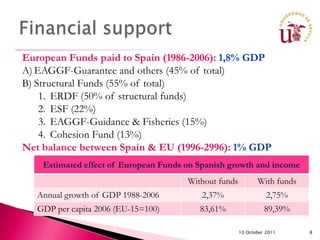
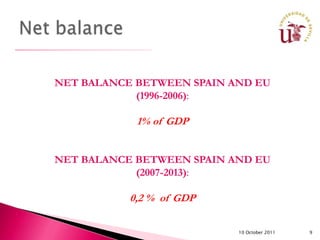
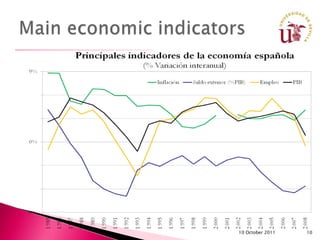
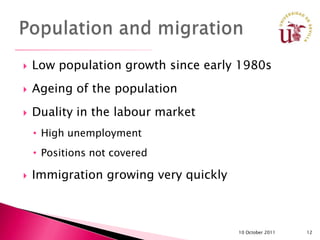
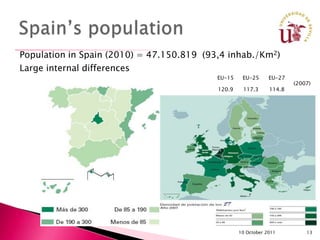
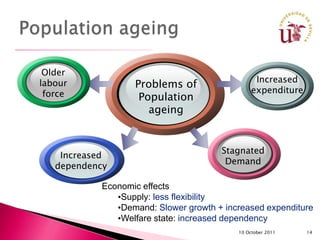
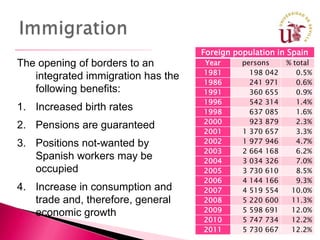
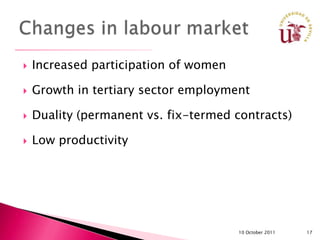
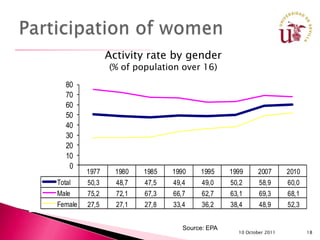
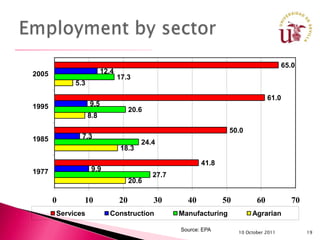
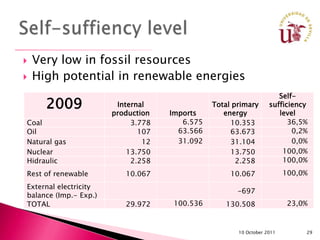
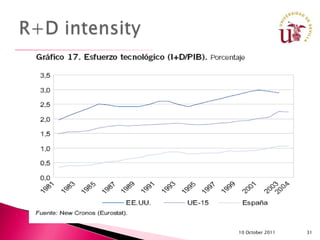
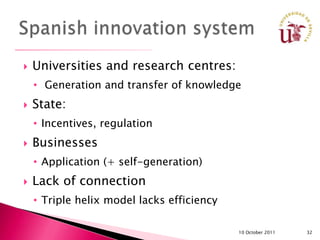
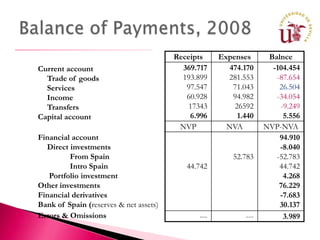
Francisco Liñán
Dept. Economia Aplicada I
   Universidad de Sevilla
   The ‘Highs’ and ‘Lows’ of the Spanish
    Economy
   Accession to the EU
   Population and migration
   Employment
   Tourism
   Energy resources

                                      10 October 2011   2
‘Highs’ and ‘Lows’ of
the Spanish Economy


                10 October 2011   3
   High-income country (US$ 30475, PPP 2008)
   High Human Development Level (0.863, #20)
    • Especially high in Health (0.970)
    • Life-expectancy at birth = 81.3 years

   Universal Social Security system
   Tourism attraction (2nd Internat. destination)
   Green technologies


                                              10 October 2011   4
   High unemployment (> 20%)
   Lower competitiveness
   External deficit
   Weak Research & Development
   Low entrepreneurship


                                  10 October 2011   5
Spain in the
European Union


             10 October 2011   6
   Application in 1977
   Accession in 1986
   Change of reference framework
   Single Market implementation
   Project for a single currency
   Launch of the Euro (1999)


                                    10 October 2011   7
European Funds paid to Spain (1986-2006): 1,8% GDP
A) EAGGF-Guarantee and others (45% of total)
B) Structural Funds (55% of total)
    1. ERDF (50% of structural funds)
    2. ESF (22%)
    3. EAGGF-Guidance & Fisheries (15%)
    4. Cohesion Fund (13%)
Net balance between Spain & EU (1996-2996): 1% GDP
    Estimated effect of European Funds on Spanish growth and income
                                       Without funds          With funds
   Annual growth of GDP 1988-2006          2,37%                  2,75%
   GDP per capita 2006 (EU-15=100)        83,61%                 89,39%

                                                       10 October 2011     8
NET BALANCE BETWEEN SPAIN AND EU
            (1996-2006):

            1% of GDP


NET BALANCE BETWEEN SPAIN AND EU
            (2007-2013):

           0,2 % of GDP

                           10 October 2011   9
10 October 2011   10
Population and
migration


                 10 October 2011   11
   Low population growth since early 1980s
   Ageing of the population
   Duality in the labour market
    • High unemployment
    • Positions not covered

   Immigration growing very quickly


                                       10 October 2011   12
Population in Spain (2010) = 47.150.819 (93,4 inhab./Km2)
Large internal differences
                                           EU-15    EU-25      EU-27
                                                                       (2007)
                                           120.9    117.3      114.8


                                                   10 October 2011         13
Older
                                                 Increased
labour             Problems of
 force                                          expenditure
                    Population
                      ageing


                                       Stagnated
    Increased
                                        Demand
   dependency

            Economic effects
               •Supply: less flexibility
               •Demand: Slower growth + increased expenditure
               •Welfare state: increased dependency
                                           10 October 2011    14
Foreign population in Spain
The opening of borders to an        Year      persons          % total
                                    1981         198 042          0.5%
   integrated immigration has the
                                    1986         241 971          0.6%
   following benefits:              1991         360 655          0.9%
                                    1996         542 314          1.4%
1. Increased birth rates            1998         637 085          1.6%
                                    2000         923 879          2.3%
2. Pensions are guaranteed
                                    2001      1 370 657           3.3%
3. Positions not-wanted by          2002      1 977 946           4.7%
                                    2003      2 664 168           6.2%
   Spanish workers may be           2004      3 034 326           7.0%
   occupied                         2005      3 730 610           8.5%
                                    2006      4 144 166           9.3%
4. Increase in consumption and      2007      4 519 554         10.0%
   trade and, therefore, general    2008      5 220 600         11.3%
   economic growth                  2009      5 598 691         12.0%
                                    2010      5 747 734         12.2%
                                    2011      5 730 667
                                             10 October 2011    12.2%15
Employment


             10 October 2011   16
   Increased participation of women

   Growth in tertiary sector employment

   Duality (permanent vs. fix-termed contracts)

   Low productivity


                                       10 October 2011   17
Activity rate by gender
                (% of population over 16)
  80
  70
  60
  50
  40
  30
  20
  10
   0
         1977     1980   1985   1990    1995     1999     2007       2010
Total    50,3     48,7   47,5   49,4     49,0    50,2      58,9      60,0
Male     75,2     72,1   67,3   66,7     62,7    63,1      69,3      68,1
Female   27,5     27,1   27,8   33,4     36,2    38,4      48,9      52,3


                                   Source: EPA
                                                   10 October 2011          18
65.0
2005                    12.4
                               17.3
            5.3

                                                                                 61.0
1995              9.5
                                    20.6
                  8.8

                                                                  50.0
1985          7.3
                                       24.4
                               18.3

                                                         41.8
1977               9.9
                                           27.7
                                    20.6

       0      10               20          30       40          50          60           70
       Services           Construction            Manufacturing           Agrarian

                                                  Source: EPA        10 October 2011          19
72.6
                     8.9
2010
                             14.1
              4.3


                                                                                            71.1
                      10.0
2009
                             14.7
              4.2


                                                                                        68.1
                           12.1
2008
                               15.8
              4.0


       0.0          10.0       20.0        30.0      40.0       50.0      60.0         70.0           80.0
             Services                 Construction          Manufacturing             Agrarian

                                                            Source: EPA          10 October 2011             20
80.0


70.0                                                74.6             75.1
                                           70.7
                            68.3
         66.7     66.0
60.0


50.0                                                  Permanent
                                                      Fix-term
40.0
         33.3     34.0
                           31.7
                                         29.3
30.0                                               25.4              24.9

20.0
       2005     2006     2007          2008       2009           2010

                                   Source: EPA
                                                   10 October 2011          21
10 October 2011   22
Tourism


          10 October 2011   23
Several different activities included

Approximation by Hostelry (% of total economy):
• Direct Effect: > 7% of GDP and employment
• Total Effect (direct + indirect): > 10% of GDP and
  employment
Contribution to the Balance of Payments
• Surplus in tourism activities
• Partly compensates the trade deficit
     • From a low of 33% to a high of 150%
     • 2010: 59% of the trade deficit

                                             10 October 2011   24
10 October 2011   25
10 October 2011   26
Energy


         10 October 2011   27
Consumption of primary energy by type of energy
                                              (ktep)
                                                   2000                   2007                    2009
Coal                                                  21.635                 20.236                   10.353
Oil                                                   64.663                 70.848                   63.673
Natural gas                                           15.223                 31.602                   31.104
Nuclear                                               16.211                 14.360                   13.750
Renewable energies                                     6.990                 10.228                   12.325
- Hidraulic                                            2.534                  2.341                    2.258
- Other renewable energies                             4.456                  7.887                   10.067
Electricity balance (imp.-exp.)                          382                   -495                     -687
Total                                              125.103                 146.779                 130.508

              Source: MICT (2010): La energía en España 2009, Madrid: Ministerio de Industria, Turismo y Comercio.


                                                                                    10 October 2011                  28
   Very low in fossil resources
   High potential in renewable energies
                                                                     Self-
      2009              Internal
                       production   Imports
                                               Total primary
                                                  energy
                                                                  sufficiency
                                                                     level
Coal                        3.778      6.575        10.353              36,5%
Oil                           107     63.566        63.673               0,2%
Natural gas                    12     31.092        31.104               0,0%
Nuclear                    13.750                   13.750            100,0%
Hidraulic                   2.258                     2.258           100,0%
Rest of renewable         10.067                    10.067              100,0%
External electricity
                                                      -697
balance (Imp.- Exp.)
TOTAL                     29.972     100.536      130.508                23,0%


                                                      10 October 2011        29
Innovation and
technology


                 10 October 2011   30
10 October 2011   31
   Universities and research centres:
    • Generation and transfer of knowledge
   State:
    • Incentives, regulation
   Businesses
    • Application (+ self-generation)
   Lack of connection
    • Triple helix model lacks efficiency

                                            10 October 2011   32
Balance of
Payments


             10 October 2011   33
Receipts    Expenses      Balnce
Current account                           369.717      474.170     -104.454
  Trade of goods                          193.899     281.553       -87.654
  Services                                 97.547       71.043       26.504
  Income                                   60.928       94.982      -34.054
  Transfers                                 17343       26592        -9.249
Capital account                             6.996        1.440        5.556
                                         NVP          NVA        NVP-NVA
Financial account                                                    94.910
  Direct investments                                                 -8.040
         From Spain                                     52.783      -52.783
         Intro Spain                       44.742                    44.742
   Portfolio investment                                               4.268
Other investments                                                    76.229
Financial derivatives                                                -7.683
Bank of Spain (reserves & net assets)                                30.137
Errors & Omissions                            ---          ---        3.989
10 October 2011   35
Inflation, Oil, technology, competitiveness, ….

                Trade Balance (Million €)


 5,000.0

 -5,000.0

-15,000.0

-25,000.0

-35,000.0

-45,000.0

-55,000.0

-65,000.0

                                            10 October 2011   36
   How to finance net borrowing requirements
                                               (% of GDP)

                              1994    1996    1998    2000       2002      2006
Financal account                1.1    -0.7     0.0      3.5         2.3     8.3
Spanish investment abroad      -1.2    -1.5   -10.6   -20.4         -7.2    -6.8
  Direct                       -0.8    -0.9    -3.2    -9.7         -2.8    -7.3
  Portfolio                    -0.4    -0.7    -7.4   -10.7         -4.4     0.5
Foreign investment in Spain    -2.3     1.5     4.9    17.1          8.5    21.4
  Direct                        1.9     1.1     2.0     6.7          3.2     1.6
  Portfolio                    -4.3     0.4     2.9    10.4          5.3    19.8
Other investment                4.7     3.5     3.4      7.7         0.4    -3.8
Bank of Spain                   0.0    -4.2     2.2     -1.1         0.5    -2.6


                                                       10 October 2011        37
Thank you very much

           Prof. Francisco Liñán
            University of Seville
                    flinan@us.es


                            10 October 2011   38

The Spanish Economy

  • 1.
    Francisco Liñán Dept. EconomiaAplicada I Universidad de Sevilla
  • 2.
    The ‘Highs’ and ‘Lows’ of the Spanish Economy  Accession to the EU  Population and migration  Employment  Tourism  Energy resources 10 October 2011 2
  • 3.
    ‘Highs’ and ‘Lows’of the Spanish Economy 10 October 2011 3
  • 4.
    High-income country (US$ 30475, PPP 2008)  High Human Development Level (0.863, #20) • Especially high in Health (0.970) • Life-expectancy at birth = 81.3 years  Universal Social Security system  Tourism attraction (2nd Internat. destination)  Green technologies 10 October 2011 4
  • 5.
    High unemployment (> 20%)  Lower competitiveness  External deficit  Weak Research & Development  Low entrepreneurship 10 October 2011 5
  • 6.
    Spain in the EuropeanUnion 10 October 2011 6
  • 7.
    Application in 1977  Accession in 1986  Change of reference framework  Single Market implementation  Project for a single currency  Launch of the Euro (1999) 10 October 2011 7
  • 8.
    European Funds paidto Spain (1986-2006): 1,8% GDP A) EAGGF-Guarantee and others (45% of total) B) Structural Funds (55% of total) 1. ERDF (50% of structural funds) 2. ESF (22%) 3. EAGGF-Guidance & Fisheries (15%) 4. Cohesion Fund (13%) Net balance between Spain & EU (1996-2996): 1% GDP Estimated effect of European Funds on Spanish growth and income Without funds With funds Annual growth of GDP 1988-2006 2,37% 2,75% GDP per capita 2006 (EU-15=100) 83,61% 89,39% 10 October 2011 8
  • 9.
    NET BALANCE BETWEENSPAIN AND EU (1996-2006): 1% of GDP NET BALANCE BETWEEN SPAIN AND EU (2007-2013): 0,2 % of GDP 10 October 2011 9
  • 10.
  • 11.
    Population and migration 10 October 2011 11
  • 12.
    Low population growth since early 1980s  Ageing of the population  Duality in the labour market • High unemployment • Positions not covered  Immigration growing very quickly 10 October 2011 12
  • 13.
    Population in Spain(2010) = 47.150.819 (93,4 inhab./Km2) Large internal differences EU-15 EU-25 EU-27 (2007) 120.9 117.3 114.8 10 October 2011 13
  • 14.
    Older Increased labour Problems of force expenditure Population ageing Stagnated Increased Demand dependency Economic effects •Supply: less flexibility •Demand: Slower growth + increased expenditure •Welfare state: increased dependency 10 October 2011 14
  • 15.
    Foreign population inSpain The opening of borders to an Year persons % total 1981 198 042 0.5% integrated immigration has the 1986 241 971 0.6% following benefits: 1991 360 655 0.9% 1996 542 314 1.4% 1. Increased birth rates 1998 637 085 1.6% 2000 923 879 2.3% 2. Pensions are guaranteed 2001 1 370 657 3.3% 3. Positions not-wanted by 2002 1 977 946 4.7% 2003 2 664 168 6.2% Spanish workers may be 2004 3 034 326 7.0% occupied 2005 3 730 610 8.5% 2006 4 144 166 9.3% 4. Increase in consumption and 2007 4 519 554 10.0% trade and, therefore, general 2008 5 220 600 11.3% economic growth 2009 5 598 691 12.0% 2010 5 747 734 12.2% 2011 5 730 667 10 October 2011 12.2%15
  • 16.
    Employment 10 October 2011 16
  • 17.
    Increased participation of women  Growth in tertiary sector employment  Duality (permanent vs. fix-termed contracts)  Low productivity 10 October 2011 17
  • 18.
    Activity rate bygender (% of population over 16) 80 70 60 50 40 30 20 10 0 1977 1980 1985 1990 1995 1999 2007 2010 Total 50,3 48,7 47,5 49,4 49,0 50,2 58,9 60,0 Male 75,2 72,1 67,3 66,7 62,7 63,1 69,3 68,1 Female 27,5 27,1 27,8 33,4 36,2 38,4 48,9 52,3 Source: EPA 10 October 2011 18
  • 19.
    65.0 2005 12.4 17.3 5.3 61.0 1995 9.5 20.6 8.8 50.0 1985 7.3 24.4 18.3 41.8 1977 9.9 27.7 20.6 0 10 20 30 40 50 60 70 Services Construction Manufacturing Agrarian Source: EPA 10 October 2011 19
  • 20.
    72.6 8.9 2010 14.1 4.3 71.1 10.0 2009 14.7 4.2 68.1 12.1 2008 15.8 4.0 0.0 10.0 20.0 30.0 40.0 50.0 60.0 70.0 80.0 Services Construction Manufacturing Agrarian Source: EPA 10 October 2011 20
  • 21.
    80.0 70.0 74.6 75.1 70.7 68.3 66.7 66.0 60.0 50.0 Permanent Fix-term 40.0 33.3 34.0 31.7 29.3 30.0 25.4 24.9 20.0 2005 2006 2007 2008 2009 2010 Source: EPA 10 October 2011 21
  • 22.
  • 23.
    Tourism 10 October 2011 23
  • 24.
    Several different activitiesincluded Approximation by Hostelry (% of total economy): • Direct Effect: > 7% of GDP and employment • Total Effect (direct + indirect): > 10% of GDP and employment Contribution to the Balance of Payments • Surplus in tourism activities • Partly compensates the trade deficit • From a low of 33% to a high of 150% • 2010: 59% of the trade deficit 10 October 2011 24
  • 25.
  • 26.
  • 27.
    Energy 10 October 2011 27
  • 28.
    Consumption of primaryenergy by type of energy (ktep) 2000 2007 2009 Coal 21.635 20.236 10.353 Oil 64.663 70.848 63.673 Natural gas 15.223 31.602 31.104 Nuclear 16.211 14.360 13.750 Renewable energies 6.990 10.228 12.325 - Hidraulic 2.534 2.341 2.258 - Other renewable energies 4.456 7.887 10.067 Electricity balance (imp.-exp.) 382 -495 -687 Total 125.103 146.779 130.508 Source: MICT (2010): La energía en España 2009, Madrid: Ministerio de Industria, Turismo y Comercio. 10 October 2011 28
  • 29.
    Very low in fossil resources  High potential in renewable energies Self- 2009 Internal production Imports Total primary energy sufficiency level Coal 3.778 6.575 10.353 36,5% Oil 107 63.566 63.673 0,2% Natural gas 12 31.092 31.104 0,0% Nuclear 13.750 13.750 100,0% Hidraulic 2.258 2.258 100,0% Rest of renewable 10.067 10.067 100,0% External electricity -697 balance (Imp.- Exp.) TOTAL 29.972 100.536 130.508 23,0% 10 October 2011 29
  • 30.
    Innovation and technology 10 October 2011 30
  • 31.
  • 32.
    Universities and research centres: • Generation and transfer of knowledge  State: • Incentives, regulation  Businesses • Application (+ self-generation)  Lack of connection • Triple helix model lacks efficiency 10 October 2011 32
  • 33.
    Balance of Payments 10 October 2011 33
  • 34.
    Receipts Expenses Balnce Current account 369.717 474.170 -104.454 Trade of goods 193.899 281.553 -87.654 Services 97.547 71.043 26.504 Income 60.928 94.982 -34.054 Transfers 17343 26592 -9.249 Capital account 6.996 1.440 5.556 NVP NVA NVP-NVA Financial account 94.910 Direct investments -8.040 From Spain 52.783 -52.783 Intro Spain 44.742 44.742 Portfolio investment 4.268 Other investments 76.229 Financial derivatives -7.683 Bank of Spain (reserves & net assets) 30.137 Errors & Omissions --- --- 3.989
  • 35.
  • 36.
    Inflation, Oil, technology,competitiveness, …. Trade Balance (Million €) 5,000.0 -5,000.0 -15,000.0 -25,000.0 -35,000.0 -45,000.0 -55,000.0 -65,000.0 10 October 2011 36
  • 37.
    How to finance net borrowing requirements (% of GDP) 1994 1996 1998 2000 2002 2006 Financal account 1.1 -0.7 0.0 3.5 2.3 8.3 Spanish investment abroad -1.2 -1.5 -10.6 -20.4 -7.2 -6.8 Direct -0.8 -0.9 -3.2 -9.7 -2.8 -7.3 Portfolio -0.4 -0.7 -7.4 -10.7 -4.4 0.5 Foreign investment in Spain -2.3 1.5 4.9 17.1 8.5 21.4 Direct 1.9 1.1 2.0 6.7 3.2 1.6 Portfolio -4.3 0.4 2.9 10.4 5.3 19.8 Other investment 4.7 3.5 3.4 7.7 0.4 -3.8 Bank of Spain 0.0 -4.2 2.2 -1.1 0.5 -2.6 10 October 2011 37
  • 38.
    Thank you verymuch Prof. Francisco Liñán University of Seville flinan@us.es 10 October 2011 38