Getting It Right: Turn Around Strategy for Managing School Change
•
0 likes•169 views

The document discusses strategies for turning around underperforming schools in South Africa. It provides data on learner enrollment, retention, and performance in primary and secondary grades from 1999-2010. Only 44% of learners who entered grade 1 in 1999 were retained through to grade 12 in 2010. The success rate of the education system, defined as the percentage of learners attaining what the system promises, is only 8.1%. While South Africa has achieved increasing access to education, the quality and success rates remain low, with most schools classified as dysfunctional, anti-functional, or under-performing.

Recommended
More Related Content
What's hot
What's hot (20)
Viewers also liked
Similar to Getting It Right: Turn Around Strategy for Managing School Change
Similar to Getting It Right: Turn Around Strategy for Managing School Change (20)
More from Education Moving Up Cc.
More from Education Moving Up Cc. (20)
Recently uploaded
Recently uploaded (20)
Getting It Right: Turn Around Strategy for Managing School Change
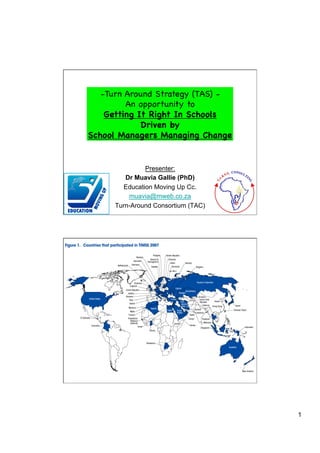
- 1. - Turn Around Strategy (TAS) - An opportunity to Getting It Right In Schools Driven by School Managers Managing Change Presenter: Dr Muavia Gallie (PhD) Education Moving Up Cc. muavia@mweb.co.za Turn-Around Consortium (TAC) TIMSS Participation Countries 2007 1
- 2. TIMSS Participation 1995 - 2007 TIMSS 2003 - Applying Maths 2
- 3. SACMEQ Countries Botswana Kenya Lesotho Malawi Mauritius Mozambique Namibia Seychelles South Africa Swaziland Tanzania Pupil Uganda reading Zambia sco re s Zanzibar Zimbabwe Source: SACMEQ Data, 2007 6 SACMEQ Results 6 7 6 2 5 2 2 12 13 11 12 15 15 13 14 4 3 1 1 7 12 4 11 13 9 14 13 1 2 3 4 9 10 9 8 5 4 6 5 3 1 5 3 10 11 8 9 14 14 12 15 11 7 10 10 8 8 15 7 3
- 4. MLA (Unesco/Unicef Education for All Campaign 1 Grade 4 1 2 2 3 6 3 2 5 4 9 8 5 4 4 6 5 3 7 6 7 8 12 1 9 7 11 10 11 12 11 10 9 12 8 10 1999-2010 + Ave Comparing Grades 1-12 from 1999 to 2010 1,350,000 1,300,000 1,250,000 1,200,000 1999 1,150,000 2000 1,100,000 2001 1,050,000 2002 1,000,000 2003 950,000 2004 900,000 2005 850,000 2006 800,000 2007 750,000 2008 700,000 2009 650,000 2010 600,000 Ave. 550,000 500,000 450,000 Grade 1 Grade 2 Grade 3 Grade 4 Grade 5 Grade 6 Grade 7 Grade 8 Grade 9 Grade 10 Grade 12 Grade 11 4
- 5. Musical Chairs Game Musical Chairs Game 24 1 23 2 22 3 21 4 20 5 19 6 18 7 17 8 16 9 15 10 14 11 13 12 12 13 11 10 9 8 7 6 5 4 3 2 1 Gr1 Gr2 Gr3 Gr4 Gr5 Gr6 Gr7 Gr8 Gr9 Gr10 Gr11 Gr12 5
- 6. Matrics 2010 started Gr1 in 1999 Drop in Learners Gr 1 (1999) - Gr12 (2010) 1,350,000 1,300,000 1,318,932 1,250,000 1,200,000 1,150,000 1,100,000 1,050,000 1,000,000 950,000 900,000 850,000 800,000 750,000 700,000 650,000 Only 44% retained! 600,000 579,384 550,000 Grade 1 Grade 12 Success rate = 8,1% • Success-rate of the system = 8,1% • Of every 12 learners starting Grade One, only 1 learner attains what the system is promising them - data 2005! 6
- 7. Access vs Success Short-Listing Employment Quantity Quality Whether you Pass! How you Pass! % Different Types of schools in SA Quality of Pass (Grades) 100% 90% 80% 70% 60% Quantity of Pass 50% 40% 20% 30% 20% 50% 10% 0% 20% -10% -20% 10% Anti- Dysfunctional Under- High- Functional Performing Performing 7
- 8. Thank You!! 8