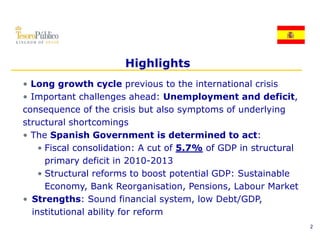
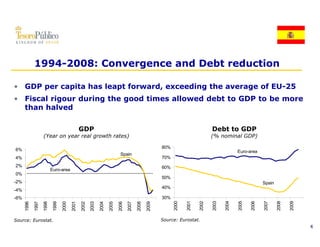
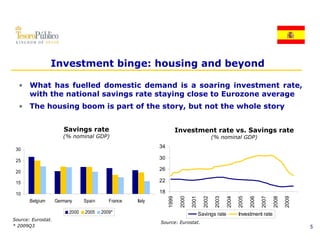
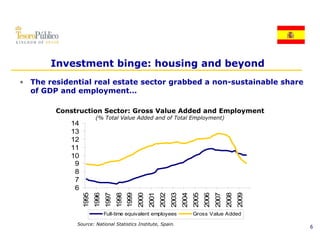
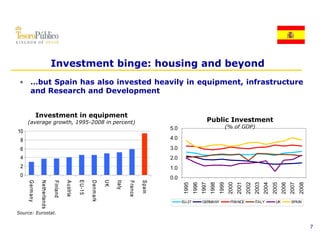
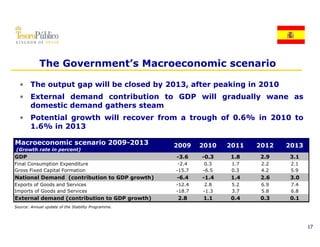
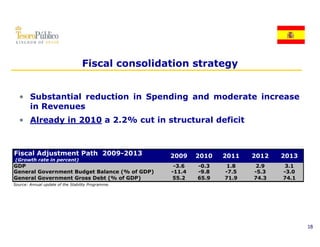
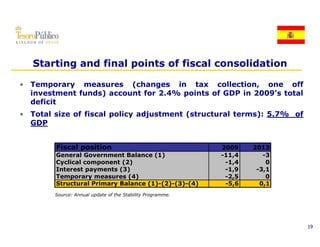
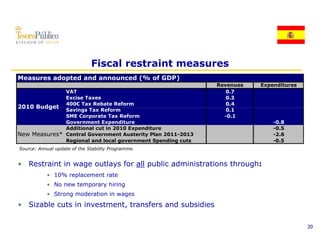
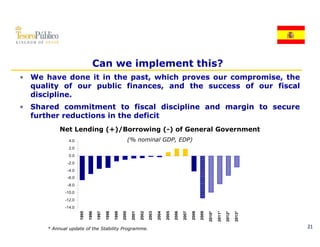
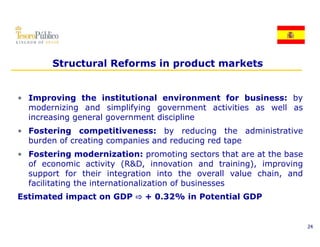
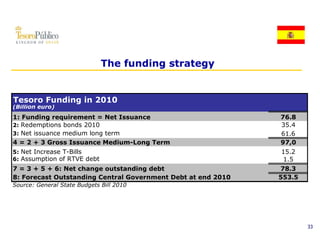
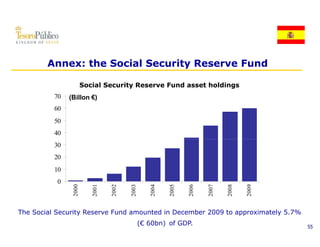
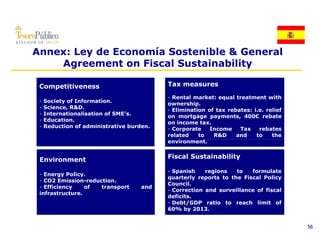
Kingdom of Spain

Economic Policy and 2010 Funding
            Strategy

    Secretary of State for the Economy
               February 2010
                      y
• Highlights

• The long growth cycle and the crisis

• Fi
  Fiscal consolidation and structural reform
       l      lid ti     d t    t   l   f

• Funding Strategy of the Kingdom of Spain
        g       gy           g        p


                  ~2009~
                                               1
Highlights
• Long growth cycle previous to the international crisis
• Important challenges ahead: Unemployment and deficit,
consequence of the crisis but also symptoms of underlying
structural shortcomings
• The Spanish Government is determined to act:
         p
    • Fiscal consolidation: A cut of 5.7% of GDP in structural
      primary deficit in 2010-2013
    •SStructural reforms to boost potential GDP: Sustainable
                l f           b          i l GDP S     i bl
      Economy, Bank Reorganisation, Pensions, Labour Market
• Strengths: Sound financial system, low Debt/GDP,
  institutional ability for reform
                                                                 2
• Highlights

• The long growth cycle and the crisis

• Fiscal consolidation and structural reform

• Funding Strategy of the Kingdom of Spain


                                               3
1994-2008: Convergence and Debt reduction

• GDP per capita has leapt forward, exceeding the average of EU-25
• Fiscal rigour during the good times allowed debt to GDP to be more
  than halved

                                                GDP                                                                                Debt to GDP
                    (Year on year real growth rates)                                                                               (% nominal GDP)

                                                                                                        80%
6%                                                                                                                                               Euro-area
                                                                              Spain
4%                                                                                                      70%
2%                                                                                                      60%
                           Euro-area
0%
                                                                                                        50%
-2%                                                                                                                                                            Spain
                                                                                                        40%
-4%
-6%                                                                                                     30%
                                                                                                                     2001
                                                                                                              2000
                                                                                                                 0


                                                                                                                            2002
                                                                                                                               2

                                                                                                                                   2003
                                                                                                                                      3

                                                                                                                                          2004
                                                                                                                                             4

                                                                                                                                                 2005
                                                                                                                                                    5

                                                                                                                                                        2006
                                                                                                                                                           6

                                                                                                                                                               2007
                                                                                                                                                                  7

                                                                                                                                                                       2008
                                                                                                                                                                          8

                                                                                                                                                                              2009
                                                                                                                                                                                 9
      1996

             1997

                    1998

                           1999

                                  2000

                                         2001

                                                2002

                                                       2003

                                                              2004

                                                                     2005

                                                                            2006

                                                                                   2007

                                                                                          2008

                                                                                                 2009


Source: Eurostat.                                                                                       Source: Eurostat.
                                                                                                                                                                                     4
Investment binge: housing and beyond

  • What has fuelled domestic demand is a soaring investment rate,
    with the national savings rate staying close to Eurozone average
  • The housing boom is part of the story, but not the whole story


                       Savings rate                                     Investment rate vs. Savings rate
                       (
                       (% nominal GDP)
                                     )                                                          (% nominal GDP)
                                                                                                    o   a G )
                                                            34
 30

 25
                                                            30

 20
                                                            26

 15                                                         22

 10                                                         18
                                                                   99

                                                                           00

                                                                                  01

                                                                                           02

                                                                                                   03

                                                                                                          04

                                                                                                                 05

                                                                                                                        06

                                                                                                                               07

                                                                                                                                      08

                                                                                                                                             09
       Belgium      Germany     Spain      France   Italy
                                                                 199

                                                                         200

                                                                                200

                                                                                         200

                                                                                                 200

                                                                                                        200

                                                                                                               200

                                                                                                                      200

                                                                                                                             200

                                                                                                                                    200

                                                                                                                                           200
                         2000   2005    2009*                                          Savings rate            Investment rate
Source: Eurostat.
                                                            Source: Eurostat.
* 2009Q3                                                                                                                                          5
Investment binge: housing and beyond
• The residential real estate sector grabbed a non-sustainable share
  of GDP and employment…

        Construction Sector: Gross Value Added and Employment
                         (% Total Value Added and of Total Employment)
            14
            13
            12
            11
            10
             9
             8
             7
             6
                  995
                         996
                                997


                                              999
                                                     000
                                                            001
                                                                   002
                                                                          003
                                                                                 004
                                                                                        005
                                                                                               006
                                                                                                      007


                                                                                                                    009
                                       998


                                                                                                             008
                 19
                        19
                               19
                                      19
                                             19
                                                    20
                                                           20
                                                                  20
                                                                         20
                                                                                20
                                                                                       20
                                                                                              20
                                                                                                     20
                                                                                                            20
                                                                                                                   20
                               Full-time equivalent employees                          Gross Value Added

             Source: National Statistics Institute, Spain.
                                                                                                                          6
Investment binge: housing and beyond
 • …but Spain has also invested heavily in equipment, infrastructure
   and Research and Development


                 Investment in equipment
     (average growth, 1995-2008 in percent)                                                                                        Public Investment
                                                                                                           5.0                                   (% of GDP)
10
 8                                                                                                         4.0
                                                                                                           40

 6                                                                                                         3.0
 4                                                                                                         2.0
 2                                                                                                         1.0
 0                                                                                                         0.0
                                                                            UK
                                                                            UK
                                                                            UK
                                                      E U -15
                                                      E U -15
                                                      E U -15


                                                                                 Italy
     G erm any
     G erm any
     G erm any

                  N etherlan
                  N etherlan
                  N etherlan


                                                                D enm ark
                                                                D enm ark
                                                                D enm ark


                                                                                                  S pain
                                                                                                  S pain
                                                                                                  S pain
                                           A ustria
                                 Finland


                                                                                         France
                                                                                         France
                                                                                         France


                                                                                                                 1995
                                                                                                                         1996
                                                                                                                                1997
                                                                                                                                       1998
                                                                                                                                              1999
                                                                                                                                                     2000
                                                                                                                                                            2001
                                                                                                                                                                   2002
                                                                                                                                                                          2003
                                                                                                                                                                                 2004
                                                                                                                                                                                        2005
                                                                                                                                                                                               2006
                                                                                                                                                                                                      2007
                                                                                                                                                                                                             2008
                                                                        k
                                                                        k
                                                                        k
             y
             y
             y


                                                                                                                 EU-27
                                                                                                                 EU 27          GERMANY               FRANCE              ITALY           UK           SPAIN
                           nds
                           nds
                           nds


Source: Eurostat.


                                                                                                                                                                                                                    7
Intensive in employment
   • Residential construction attracted low skilled labour, dragging
     productivity lower
   • Labour supply matched this demand with the help of immigration
     flows

                   Active population                                                   Labor productivity
       (Growth rates from 2005Q1 to 2009Q3)
                                                                                        ( e at e
                                                                                        (Relative to EU-27, PPP)
                                                                                                      U   ,    )
 12%                                                             107
 10%                                                             106
  8%                                                             105
                                                                 104
  6%
                                                                 103
  4%
                                                                 102
  2%                                                             101
  0%                                                             100
                    Germany
                          y


                                               Italy
                                                   y
                              Spain
                                  n


                                      France
                                           e
         Belgium
               m


                                                             m
                                                       Kingdom


                                                                        1999
                                                                               2000
                                                                                      2001
                                                                                             2002
                                                                                                    2003
                                                                                                           2004
                                                                                                                  2005
                                                                                                                         2006
                                                                                                                                2007
                                                                                                                                       2008
                                                                                                                                              2009
                                                        United


Source: Eurostat. Labor Force Survey.
                                                                 Source: Eurostat. Labor Force Survey.                                               8
Cost competitiveness
   • Loss of competitiveness has been moderate in the tradable sector
   • Nominal divergence stems from non-tradables (where the bulk of
     the adjustment is taking place)


               Unit labour cost index                                                                     Manufacturing ULC index
              (Relative to eurozone 1999=100)                                                             (Relative to eurozone 1999=100)
125                                                                                     140
120                                                                                     130
115                                                                                     120
110                                                                                     110
105                                                                                     100
100                                                                                      90
 95                                                                                      80      999
                                                                                                        000
                                                                                                               001
                                                                                                                       002
                                                                                                                              003
                                                                                                                                      004
                                                                                                                                             005
                                                                                                                                                    006
                                                                                                                                                           007
                                                                                                                                                                  008
                                                                                                                                                                         009
        999
                000
                       001
                               002
                                      003
                                              004
                                                     005
                                                            006
                                                                   007
                                                                          008
                                                                                 009


                                                                                                19
                                                                                                       20
                                                                                                              20
                                                                                                                      20
                                                                                                                             20
                                                                                                                                     20
                                                                                                                                            20
                                                                                                                                                   20
                                                                                                                                                          20
                                                                                                                                                                 20
                                                                                                                                                                        20
       19
               20
                      20
                              20
                                     20
                                             20
                                                    20
                                                           20
                                                                  20
                                                                         20
                                                                                20


                      Spain          Italy          Germany          France                                   Spain          Italy          Germany          France
Source: Eurostat.
                                                                                       Source: Eurostat                                                                        9
Exports show underlying improvement in supply
  • In spite of brisk                                     domestic              demand              and             waning          price
    competitiveness…
  • …Spain's market shares have outperformed most of peers


  Share in world merchandise exports                                          Share in world exports of services*
                       (Index 2000=100)                                 150                        (Index 2000=100)
120

110
                                                                        125
100

90                                                                      100

80
                                                                        75
70

60                                                                      50
  2000   2001   2002   2003   2004   2005   2006   2007   2008   2009         2000   2001   2002     2003    2004    2005   2006   2007     2008

            Spain       Germany        France      United States                        Spain      Germany      France      United States

Source: International Monetary Fund.                                          Source: World Trade Organisation.
                                                                              * Services other than transportation and travel.
                                                                                                                                                   10
Services Exports’ market share has increased
                   significantly
• Among others, services related to architecture, construction and
  engineering have more than doubled market share
                                             Share!of!service!exports!in!the!OCDE,!by!service

                                                                                                                                                                                          10
                                                                                                                                            2000
                                                                                                                                            2007
                                                                                                                                                                                          8


                                                                                                                                                                                          6


                                                                                                                                                                                          4


                                                                                                                                                                                          2


                                                                                                                                                                                          0
          otal!


                                      rism


                                                                                                                                                                                   ment
                                                                                                                     tion


                                                                                                                                                            Entertainm ent
                                                                                     Insurance


                                                                                                      cial
                  Transportation


                                                                                                                                      and


                                                                                                                                             Professional
                                                            ons


                                                                                                                                              services!to
                                                                  and!engineering
                                                                               al,


                                                                                                                     es
                                                                               n,
         To


                                                                                                 Financ
                                                 Communicatio


                                                                    construction


                                                                                                               service


                                                                                                                                                 Otherr
                                                                    Architectura


                                                                                                                            Royalties!a
                                                                                                                               patentss


                                                                                                                                                                             Governm
                                   Tour


                                                                                                             Informat
                      services


         Source: OECD.                                                                                                                                                                         11
FDI flows have increased significantly
• Outward FDI stock per capita has grown faster in Spain than in
  the Eurozone
• Remains a major destination of international investment

      Outward FDI stock per capita                        Top receivers of FDI in 2008
          relative to Eurozone                                                (Stock in millions of US $)
                                              2500000
  0.90
                                              2000000
  0.85
  0.80                                        1500000


  0.75                                        1000000

  0.70                                        500000

  0.65                                             0


                                                                                                                                Germany


                                                                                                                                                      UK


                                                                                                                                                                    US
                                                                                                Belgium


                                                                                                                                          Hong Kong
                                                                               China

                                                                                       Canada


                                                                                                                                                           France
                                                        Italy


                                                                                                                     herlands
                                                                                                          Spain
                                                                   tzerland
  0.60
         2002 2003 2004 2005 2006 2007 2008


                                                                                                                  Neth

                                                                                                                                G
                                                                Swit


Source: World Investment Report 2009
                                                    Source: World Investment Report 2009
                                                                                                                                                                         12
The crisis prompts an abrupt adjustment
 • Rapid downsizing of residential sector: output, L (mainly in
   temporary contracts)
 • Ripple effects on employment in other sectors

               Unemployment rate
20                     (In percent)
                                                                     Sectoral employment
16                                                                        (total number)
                                                                       july 2008     sept 2009        dif        %
                                                    Total              19.382.121      17.935.095   -1.447.026       (100)
12
                                                      Construction       2.361.177      1.752.157    -609.021    (42,1)
                                                      Industry           2.731.068      2.377.211    -353.857
                                                                                                      353.857    (24,5)
 8                                                    Services         13.150.027      12.599.061    -550.966    (38,1)

                                                    Sources: Eurostat. Labor Force Survey.
 4
     2005    2006       2007       2008    2009
            Spain        Euro area (16 countries)
Sources: Eurostat. Labor Force Survey.
                                                                                                                        13
Changes in sectoral and external balances
     • Large swing in private sector balance: plummeting Investment and
       soaring Savings
     • Government Deficit jumps, but 2.5 points of GDP are one-off
     • Current Account deficit has halved in 2009
                                                        Sectoral balances
                                                           (% of GDP)

                                                         Public Sector Balance
                            8                                                            6,5
                            6                            Private Sector
                            4             1,9
                            2
                        %   0
                           -2
                           -4
                           -6                                   -4,1
                                                                       -5,0
                           -8
                          -10
                          -12                   -11,0                            -11,4
                          -14
                                           2007                   2008            2009
Source: National Statistics Institute, Spain.                                                  14
• Hi hli ht
  Highlights

• The long growth cycle and the crisis

• Fiscal consolidation and structural reform

• Funding Strategy of the Kingdom of Spain


                                               15
Policy Strategy for Sustainable Growth

• Prudent Macroeconomic Scenario 2010-2013
• Agreement on Fiscal Consolidation to bring the deficit
   g                                       g
  back to 3% in 2013
• Structural Reforms:
     • Structural Reforms in the goods markets
     • Public Pensions System
     • Labour Market
     • Banking sector Restructuring


                                                           16
The Government’s Macroeconomic scenario

  • The output gap will be closed by 2013, after peaking in 2010
  • External demand contribution to GDP will gradually wane as
    do est c de a d gat e s stea
    domestic demand gathers steam
  • Potential growth will recover from a trough of 0.6% in 2010 to
    1.6% in 2013

Macroeconomic scenario 2009-2013                    2009    2010   2011   2012   2013
(Growth rate in percent)
GDP                                                 -3.6    -0.3   1.8    2.9    3.1
Final Consumption Expenditure                        -2.4    0.3    1.7    2.2    2.1
Gross Fixed Capital Formation                       -15.7
                                                     15 7   -6.5
                                                             65     0.3
                                                                    03     4.2
                                                                           42     5.9
                                                                                  59
National Demand (contribution to GDP growth)        -6.4    -1.4   1.4    2.6    3.0
Exports of Goods and Services                       -12.4   2.8     5.2    6.9    7.4
Imports of Goods and Services                       -18.7   -1.3    3.7    5.8    6.8
External demand (contribution to GDP growth)        2.8     1.1    0.4    0.3    0.1
Source: Annual update of the Stability Programme.


                                                                                        17
Fiscal consolidation strategy


  • Substantial reduction in Spending and moderate increase
    in Revenues
  • Already in 2010 a 2.2% cut in structural deficit


Fiscal Adjustment Path 2009-2013                    2009    2010   2011   2012   2013
(Growth rate in percent)
GDP                                                  -3.6   -0.3    1.8    2.9    3.1
General Government Budget Balance (% of GDP)
G     lG         tB d tB l            f             -11.4
                                                     11 4   -9.8
                                                             98    -7.5
                                                                    75    -5.3
                                                                           53    -3.0
                                                                                  30
General Government Gross Debt (% of GDP)            55.2    65.9   71.9   74.3   74.1
Source: Annual update of the Stability Programme.


                                                                                        18
Starting and final points of fiscal consolidation

• Temporary measures (changes in tax collection, one off
  investment funds) account for 2.4% points of GDP in 2009’s total
  deficit
• Total size of fiscal policy adjustment (structural terms): 5.7% of
  GDP


        Fiscal position                                     2009    2013
        General Government Balance (1)                      -11,4      -3
        Cyclical component (2)                               -1,4       0
        Interest payments (3)                                -1 9
                                                              1,9    -3 1
                                                                      3,1
        Temporary measures (4)                               -2,5       0
        Structural Primary Balance (1)-(2)-(3)-(4)           -5,6     0,1
        Source: Annual update of the Stability Programme.


                                                                            19
Fiscal restraint measures
Measures adopted and announced (% of GDP)
                                                            Revenues   Expenditures
              VAT                                              0.7
              Excise Taxes                                     0.3
              400€ Tax Rebate Reform                           0.4
2010 Budget
              Savings Tax Reform                               0.1
              SME Corporate Tax Reform                        -0.1
              Government Expenditure                                       -0.8
              Additional cut in 2010 Expenditure                           -0.5
New Measures* Central Government Austerity Plan 2011-2013                  -2.6
              Regional and local government Spending cuts
              R i     l   dl     l         tS    di    t                   -0.5
                                                                            05
Source: Annual update of the Stability Programme.


• Restraint in wage outlays for all public administrations through:
           • 10% replacement rate
           • No new temporary hiring
           • Strong moderation in wages
• Sizable cuts in investment, transfers and subsidies

                                                                                      20
Can we implement this?
• We have done it in the past which proves our compromise the
                         past,                 compromise,
  quality of our public finances, and the success of our fiscal
  discipline.
• Shared commitment to fiscal discipline and margin to secure
  further reductions in the deficit
           Net Lending (+)/Borrowing (-) of General Government
               4.0                                             (% nominal GDP EDP)
                                                                          GDP,
               2.0
               0.0
              -2.0
               40
              -4.0
              -6.0
              -8.0
             -10.0
             -12.0
             -14.0
                     1995

                            1996

                                   1997

                                          1998

                                                 1999

                                                        2000

                                                                2001

                                                                       2002

                                                                              2003

                                                                                     2004

                                                                                            2005

                                                                                                   2006

                                                                                                          2007

                                                                                                                 2008

                                                                                                                        2009

                                                                                                                               2010*

                                                                                                                                       2011*

                                                                                                                                               2012*

                                                                                                                                                       2013*
      * Annual update of the Stability Programme.                                                                                                              21
Debt dynamics

• Even after the impact of strong stabilisation policies, Spain's Debt
  to GDP is significantly lower that the Eurozone average

        Gross Debt-to-GDP (%)                                                      Gross Debt-to-GDP (%)
                  2000-2010                                                                    2010F
90                                                                 125.0
           France                                                  112.5
80         Germany                                                                Eurozone
           Spain                                                   100.0
                                                                               Average: 84.0%
70                                                                  87.5
                                                                    75.0
60                                                          65 9
                                                            65.9
                                                                    62.5
                                                                    62 5
                                                                    50.0
50                                                   55.2
                                                                    37.5
40                                                                  25.0
                                              39.7
                                                                    12.5
30                                                                   0.0
     2000 2001 2002 2003 2004 2005 2006 2007 2008 2009 2010                Spain    Ireland   France   Germany   Italy   UK   USA


 Sources: European Commission, Annual update of the Stability Programme and International Monetary Fund.
                                                                                                                                    22
Lowest interest burden within affordable limits
         Ratio of interests to GDP of General Government
                               (% nominal GDP, EDP)
    13

    11

     9

     7

     5

     3

     1


          *

          *
        95


        98


        03

        04


        06


        08
        96

        97


        99

        00

        01

        02


        05


        07


       09

       10
     19

     19

     19

     19

     19

     20

     20

     20

     20

     20

     20

     20

     20

     20

     20

     20
              Spain       Germany         France        Belgium       Italy   UK

     Source: European Commission.
     * European Economic Forecast Autumn 2009, European Commission.
                                                                                   23
Structural Reforms in product markets


• Improving the institutional environment for business: by
  modernizing and simplifying government activities as well as
  increasing general government discipline
• Fostering competitiveness: by reducing the administrative
  burden of creating companies and reducing red tape
• Fostering modernization: promoting sectors that are at the base
  of economic activity (R&D, innovation and training), improving
  support f  for their integration into the overall value chain, and
                  h                        h        ll l   h       d
  facilitating the internationalization of businesses
Estimated impact on GDP ! + 0.32% in Potential GDP


                                                                       24
Residential Real Estate Sector

• Phasing out fiscal incentives for housing ownership from
  2011 (deduction of mortgage payments)
• Removing barriers to the development of the rental market:
  • Same fiscal treatment than ownership
  • C
    Creation of REITS
        ti    f
  • Legal changes to strengthen certainty for landlords
• Tax Incentives for refurbishment provide some support
                                   p              pp


                                                               25
26
Preventive financial support measures


                                             reorganisation
                                              enhancement
                                                 Capital

                                                  and
                                                stimulus
                                                 Credit
                                                  Liquidity enhancement
                                        9
                                        b
                                        n
                                        €
                                         c
                                        Ea
                                        xp
                                        ti
                                        I
                                        et
                                        n
                                        na
                                        d
                                        M
                                        dl
                                        e
                                        &
                                        e-
                                        p
                                        A
                                        d
                                        e4
                                         2
                                         H
                                        n8
                                        b
                                        37
                                         D
                                         i
                                        d
                                        a
                                        0S
                                         e
                                         g
                                        e2
                                         b
                                        nb
                                         e
                                         h
                                        n0
                                         n
                                        k
                                        Jn
                                         c
                                         f
                                        t€
                                        iq
                                        uo
                                         a
                                         b
                                         R
                                         ,
                                        n€
                                         n
                                         c
                                         u
                                        fn
                                         i
                                        g
                                        ed
                                         t
                                         1
                                         a
                                        us
                                         a
                                         g
                                         o
                                         9
                                         l
                                        nk
                                         €
                                         r
                                        a
                                        2u
                                         t
                                         ,
                                         .
                                         i
                                        do
                                        r
                                        0a
                                         i
                                         3
                                        it
                                         s
                                         u
                                        m
                                        1r
                                         e
                                         p
                                         y


m


m
 O
 O
 R
 B


 R
 A
 A


 B
 n


 n
iC
 g


 2
l0
 0
 8

 2
 0
 0
 9
 n


 u

 o
 n


 o
 a


 a
 g

 e


 u
 n


 n
 a


ia

 a


 d


 g
 e
 e
 k


in
C
 F


 F
 F


 z
 e
 s


u

u
d
                                        ni
                                         h


 s
u

e


n
h

n


n
q


d


 (


 -


 )
 r
                                         n


a
 r


e


e

e
y


 t
 t
L


s


s
iI


c
 f
 i


 i
r


t


t

 i
t


 l
 i


t
i
                                        0a
                                         r
                                         h
                                         b
                                        gn
                                         a
                                         d
                                        on
                                        .n
                                         a
                                         c
                                         r
                                         c
                                         t
                                        f€
                                         f
                                         s
                                         o
                                        ai
                                         e
                                         1
                                        Bu
                                         e
                                         l
                                        nn
                                         5
                                        s
                                        ue
                                         n
                                         d
                                         l
                                        d2
                                         g
                                         0
                                        u
                                        td
                                         a
                                         0
                                        pi
                                         o
                                         t
                                        m0
                                         b
                                        e
                                        mf
                                         n
                                         u
                                         e
                                        a7
                                         o
                                        r
                                        au
                                         g
                                         t
                                         r
                                        nn
                                        v
                                        rn
                                         .
                                         a
                                        ad
                                         d
                                        il
                                        k
                                        gs
                                        s
                                        ei
                                        e
                                        o
                                        tn
                                        m
                                        r
                                        sg
                                        e
                                        n
                                        oa
                                        t
                                        pu
                                        et
                                        nh
                                         o
                                         r
                                         i
                                         z
                                         e
The financial system remains resilient


• Main source of perceived vulnerability regards losses
  stemming from lending to real estate developers
        i   f     l di         l        d    l
• Bank of Spain stress test: Operating income over 3
  years is able to absorb losses of 40% of the portfolio
  of lending to real estate developers.
• Extreme assumptions of stress test: PD of 40%(3
  times th peak of 1993) and LGD of 100 % (hi hl
  ti    the    k f         d      f        (highly
  implausible)


                                                           27
FROB: a tool for restructuring the banking sector
Rationale for the initiative                  Governance

- Overcoming fragmentation         in   the   - Independent management.
savings and banks sector.
                                              - Strong accountability to Parliament
                                                                         Parliament.
- Achievement of economies of scale to
digest low interest margins and real          - Authorized by DG Competition.
estate impact.


 Asset Operations                             Funding

 - Support to integration processes subject   - Public-private mix of capital (9 bn€).
 to conditions set by the banking
 supervisor.                                  - Agency-like     funding       programme
                                              coordinated     with    the       sovereign
 - Instrumented    through  convertible       programme.
 preference shares with market-oriented
 remuneration.


                                                                                            28
Pension System Reform

Proposed Measures:
  • A progressive increase in the retirement age (to 67
    years)
  • Strengthening relationship between contributions and benefits
  • A more flexible relationship between complementary social
                               p            p        y
    security and the public system
  • Possible adjustment of other parameters of the current system


Expected Results: Sustainability of the pension system


                                                                    29
Labour Market Reform

• Five main guidelines:


  • St bilit in employment, by reducing market segmentation
    Stability i    l     t b     d i       k t       t ti
  • Reform of Collective Bargaining system
  • Incentives for young workers’ employment and education
                         workers
  • Promotion of the integration of women in the labour market
  • Worker intermediation and greater control of temporary
    occupational disability claims


                                                                 30
• Highlights

• The long growth cycle and the crisis

• Fiscal consolidation and structural reform

• Funding Strategy of the Kingdom of Spain


                                               31
Highlights of Funding Strategy
• Significant reduction in net funding requirements and
persistence of sound risk metrics
• Liquidity transparency and predictability will continue
   Liquidity,
as guiding principles for the execution of our auction program
• As for syndications, timing is dictated by the limit size of the
line to be replaced (16.5 bn for longer tenors) and market
conditions.
• Innovations for 2010: 18 month T bills reappear Euro
                            18-month T-bills reappear,
inflation linker still a project
• Maintain our stable and diversified investor base


                                                                     32
The funding strategy


Tesoro Funding in 2010
(Billion euro)
1: Funding requirement = Net Issuance                         76.8
2: Redemptions bonds 2010                                     35.4
3: Net issuance medium long term                              61.6
4 = 2 + 3 Gross Issuance Medium-Long Term                     97,0
5: Net Increase T-Bills                                       15.2
6: Assumption of RTVE debt                                    1.5
7 = 3 + 5 + 6: Net change outstanding debt                    78.3
8: Forecast Outstanding Central Government Debt at end 2010   553.5
Source: General State Budgets Bill 2010


                                                                      33
Funding programme in perspective

• Cut in Net Issuance: lower cash deficit and no exceptional
  increase in net financial assets

                       Funding Programme. 2010 vs. 2009
            140                       (Net issuance in billion Euro)
            120          116.7
                                                                                2009     2010

            100
                                                                               82.3
                                   76.8
            80
                                                                                       61.6
            60

            40                                             34.4
                                                           34 4

            20                                                    15.2

             0
                    Total N t I
                    T t l Net Issuance                Letras del Tesoro net M di
                                                      L t    d lT         t Medium & long term
                                                                                      l   t
                                                              issues           net issues*
              (*) Includes foreign currency issues.

              Source: Dirección General del Tesoro y Política Financiera.                        34
Short-term funding

• Net issuance in 2009 in line with initial announcement: 34.4 bn€.
  Gross issuance breakdown:
  • 3-month Letras: 19.7 bn€
  • 6-month Letras: 31.6 bn€
  • 12-month Letras: 58.0 bn€
    12 month


• Innovations in 2010:
  • Calendar change: 3- and 6-month Letras auction 4th Tuesday
  • 18-month T-bills relaunched: auction 3rd Tuesday


                                                                      35
Medium- and long-term funding
• Gross issuance: 2009 overshooting (ca. 25 bn €) due to higher than
  expected impact of the crisis
• Auction procedures unchanged: Quarterly calendar + potential off-
  the-run lines announced Friday prior to the auction
• Limit size per line: increased to 16.5 bn € for longer lines
• Bonos del Estado:
   • New 5-year benchmark in March
   • Current 3-year benchmark B 2.30% 04/2013 issued until 15 bn €
• Obli
  Obligaciones d l E t d
         i     del Estado:
   • New 10 year O 4.00% 04/2020 (5 bn €) successfully syndicated in
     January
   • Next syndication a 15 year line, to replace the matured O 4.80% Jan-
     2024), expected for February depending on market conditions
                                                                            36
Diversification of funding sources
• Recent foreign currency issuance:
  • Eurobond 2.75% March 2012 ($ 1.0 billion)
  • Eurobond 2 00% October 2012 ($ 2 5 billion)
             2.00%                 2.5
  • Tesoro Público is open to additional foreign currency issuance

• Floating Rate Note 3-Month EURIBOR-10 bps, October 2012
                        3 Month EURIBOR 10
  (€ 3.0 billion). Possible retapping in 2010

• Projects:
  • European inflation-linked issues (HICP-ex tobacco)
  • Schuldschein loans


                                                                     37
Main features of Treasury funding strategy
  600                                 Spanish debt portfolio                                                        554
                                                     (€ billion)
  500                                                                                                        475


  400                                                                                                 358
                                                                                319 312 307
  300
          229
  200

  100

   0
           995
                  996
                         997
                                998
                                       999
                                              000
                                                     001
                                                            002
                                                                   003
                                                                          004
                                                                                 005
                                                                                         006
                                                                                                007
                                                                                                       008
                                                                                                              009
                                                                                                                    2010 (f)
          19
                 19
                        19
                               19
                                      19
                                             20
                                                    20
                                                           20
                                                                  20
                                                                         20
                                                                                20
                                                                                        20
                                                                                               20
                                                                                                      20
                                                                                                             20
                                                                                                                       0
             Foreign Currency                       Other          Letras              Bonos y Obligaciones
        Source: Dirección General del Tesoro y Política Financiera.                                                            38
-75
                                                   -50
                                                         -25
                                                          25
                                                               0
                                                                   25
                                                                        50
                                                                             75
                                                                                  100
                                                                                        125
                                                                                              150
                                   Sep-0
                                       07
                                   Oct-0
                                       07
                                   Nov-0
                                       07
                                   Dec-0
                                       07
                                   Jan-0
                                       08


Source: Bloomberg.
                                   Feb-0
                                       08
                                   Mar-0
                                       08
                                   Apr-08


                     Germany
                                   May-0
                                       08
                                   Jun-008
                                    Jul-0
                                        08


                     Italy
                                   Aug-08
                                   Sep-008
                                   Oct-008
                                   Nov-0
                                       08


                     France
                                   Dec-0
                                       08
                                                                                              (in bps)


                                   Jan-0
                                       09
                                   Feb-0
                                       09
                                   Mar-0
                                       09
                                   Apr-09


                     Belgium
                                   May-009
                                   Jun-009
                                    Jul-0
                                        09
                                   Aug-09
                                   Sep-0
                                       09
                     Netherlands


                                   Oct-0
                                       09
                                   Nov-0
                                       09
                                   Dec-0
                                       09
                                   Jan-10
                                                                                                     Spread of the Spanish 10-year bond vs. main European peers
                                                                                                                                                                  Recent widening might be an opportunity


                                   Feb-10
  39
-75
                                                   -50
                                                         -25
                                                          25
                                                               0
                                                                   25
                                                                        50
                                                                             75
                                                                                  100
                                                                                        125
                                                                                              150
                                                                                                     S
                                   Sep-0
                                       07
                                   Oct-0
                                       07
                                   Nov-0
                                       07
                                   Dec-0
                                       07
                                   Jan-008


Source: Bloomberg.
                                   Feb-008
                                   Mar-008
                                                                                                     Spread of th S


                                   Apr-0
                                       08


                     Germany
                                   May-008
                                   Jun-008
                                    Jul-0
                                        08
                                                                                                                      i h5


                     Italy
                                   Aug-0
                                       08
                                   Sep-0
                                       08
                                   Oct-0
                                       08
                                   Nov-0
                                       08
                                   Dec-0
                                       08


                     France
                                                                                              (in bps)
                                                                                                                                 b d


                                   Jan-0
                                       09
                                   Feb-0
                                       09
                                   Mar-0
                                       09
                                   Apr-0
                                       09


                     Belgium
                                   May-0
                                       09
                                   Jun-009
                                                                                                                                            i E


                                    Jul-0
                                        09
                                   Aug-0
                                       09
                                   Sep-0
                                       09
                     Netherlands


                                   Oct-0
                                       09
                                   Nov-0
                                       09
                                   Dec-0
                                       09
                                   Jan-1
                                       10
                                                                                                          d f the Spanish 5-year bond vs. main European peers
                                                                                                                                                                Cheapening concentrated in the front end


                                   Feb-1
                                       10
 40
An atractive market to invest in


Attractive prices     Liquid instruments


Solid and efficient   Diversified investor
  infrastructure              base


                                             41
Increase in market liquidity
                                                                                    Average outstanding size: 13 5 b €
                                                                                    A           t t di    i   13.5 bn
                                                                                    Target for average outstanding <10 years: 15 bn €
  20
                                                                                    Target for average outstanding >10 years: 15 bn €
  18                                                                                On-the-run bonds                      4.10%
                                                                                                                                                                                                                          6.00%
        3.25%   5.40%                                                                                                           4.40%
  16        4.10%
            4 10%                                              3.90%
                                                               3 90%                        4.20%
                                                                                            4 20%                         3.30%      3.15%
                                                                                                                                     3 15%                      5.50%
                                                                                                                                                                5 50%                        4.30%
                                                                                                                                                                                             4 30%                                           4.20%
                                    5.35%                                6.15%                                  4.75%                                                              4.60%                        4.80%
  14                                              5.00%                                                                                               3.80%                                                                         5.75%
                                                                                                      4.25%                                                                                                                                            4.90%
                                             2.75%
  12                                                                              2.30%

  10
    8
    6                                                                                                                                                                                                 4.00%                                                     4.70%
    4
    2
    0
         Jul-10


                           Jul-11


                                                      Jul-12


                                                                                             Jul-13


                                                                                                                 Jul-14


                                                                                                                                                                 Jul-17
                                                                                                                                                                          Jul-18
                                                                                                                                                                                    Jul-19


                                                                                                                                                                                                                                    Jul-32


                                                                                                                                                                                                                                                       Jul-40
                                                                                                                                                                                                                                                                Jul-41
                                                                            -13


                                                                                                          -14


                                                                                                                                       -15
                                                                                                                                                -16
                                                                                                                                                          -17


                                                                                                                                                                                                                    -24
                                                                                                                                                                                                                              -29


                                                                                                                                                                                                                                                 -37
                     -11


                                       -11
                                                -12


                                                                   -12


                                                                                      -13


                                                                                                                              -14


                                                                                                                                                                                                -19
                                                                                                                                                                                                          -20
                                                                         Jan-


                                                                                                       Jan-


                                                                                                                                    Jan-
                                                                                                                                             Jan-
                                                                                                                                                       Jan-


                                                                                                                                                                                                                 Jan-
                                                                                                                                                                                                                           Jan-


                                                                                                                                                                                                                                              Jan-
                  Apr-


                                    Oct-
                                             Apr-


                                                                Oct-


                                                                                   Apr-


                                                                                                                           Oct-


                                                                                                                                                                                             Oct-
                                                                                                                                                                                                       Apr-
Source: Dirección General del Tesoro y Política Financiera.
                                                                                                                                                                                                                                                                         42
Low Debt Refinancing Risk…
           Redemption profile of Bonos & Obligaciones
         (Million Euros)
50.000

45.000

40.000

35.000

30.000
30 000

25.000

20.000

15.000

10.000

 5.000

    0
          2010 2011 2012 2013 2014 2015 2016 2017 2018 2019 2020- 2024 2029 2032 2037 2040 2041
                                                            2023
  Source: Dirección General del Tesoro y Política Financiera.                                     43
Low Debt Refinancing Risk…


           Central Government Debt refinancing risk
                           (in % of the total portfolio)
      50
                42
      40

      30
                                          24
(%)


                      20     21                  22     21
      20                                                                      18   18

      10                                                                7

       0
               1 year or less              1 to 3 years                 3 to 5 years
                               31.12.1995       31.12.1999           31.01.2010

       Source: Dirección General del Tesoro y Política Financiera.


                                                                                        44
…Thanks to relatively high duration and average life
                   to maturity…
             Duration & Average Life to Maturity of the Portfolio
                                 (Letras, Bonos and Obligaciones)
       8.0
                                             (in years)

                                                                            6.69
                                                                            6 69             6.78
                                                                                             6 78
                 5.52
       6.0

                                                                            4.79
                                                                                             4.77
       4.0
                 4.16
                                                                                  Average life
                                                                            France             6,24
       2.0                                                                  Netherlands        6,88
                                                                            Belgium            5,94
                                                                            Italy              7,07


       0.0
              2000 2001 2002 2003 2004 2005 2006 2007 2008 2009 2010
                                             Duration        Average life
             Source: Dirección General del Tesoro y Política Financiera.                              45
…while achieving lower Funding Costs
                           Average Funding Costs
                                      (in percent)
  6.0
  5.5
  5.0
  4.5                                                              4.32

  4.0
  3.5                                                           3.81                 3.49
  3.0
  2.5
                                                                                     2.27
  2.0
  1.5
  1.0
         2000 2001 2002 2003 2004 2005 2006 2007 2008 2009 2010
                 Average cost of Debt outstanding         Average cost at issuance

 Source: Dirección General del Tesoro y Política Financiera.
                                                                                            46
Reliance on foreign funding relatively moderate

                         External public sector debt in 2009
    100                                                (% of GDP)
     90
     80
     70
     60
     50
     40
     30
     20
     10
      0
                                Italy


                                                                                                                                 Argentina
                                                                                   Germany
             Greece


                                        Austria


                                                           Ireland
                                                  France


                                                                                             Finland


                                                                                                               United
                                                                                                       Spain
                      Belgium


                                                                                                                                                      Kingdom
                                                                        herlands


                                                                                                                        States


                                                                                                                                             United
                                                                                   G


                                                                                                                                                      K
                                                                     Neth


                                                                                                                                 A
          Source: OECD.
                                                                                                                                                                47
Banks financing of government debt in line with
              Eurozone average

           Holdings of government debt November 2009
                                                  (% of bank assets)
      25

      20

      15

      10

       5

       0


                                                                                                        ermany


                                                                                                                            ortugal
                       Belgium


                                                                               Ireland


                                                                                                                                      Finland
             lovakia


                                 Greece


                                                           France

                                                                    Eur area
                                          Italy


                                                                                             erlands
                                                   Spain


                                                                                                                 Austria
                                                                      ro


                                                                                                                           Po
                                                           F


                                                                                                                                      F
                                 G


                                                                                                                 A
                                                                                         Nethe

                                                                                                       Ge
                       B
            Sl


       Source: Citi.
                                                                                                                                                48
Spanish Banks’ funding from ECB around
          Eurozone average

                    Recourse to ECB funding
                        (% of total bank assets)
  10%
   8%
   6%
   4%
   2%
   0%
                       IRL

                             IT


                                                              FI
          NL


                                                 GR

                                                         AU


                                                                   FR
                                           PO
                 GE


                                  ESP


                                                                        BE
                                  jul-08
                                  jul 08        oct-09
                                                oct 09

    Source: Deutsche Bank.
                                                                             49
Stable and diversified investor base
                               Government Bonds by Holder
                              (Term investment, % of total portfolio)
100%
                                                                             Spanish official
90%                                                                          institutions
        33.37%
80%                                                                          Non residents
70%                                                                 43.94%
60%                                                                          Households &
                                                                             Non financ.
50%
                                                                             Pension & Mutual
40%                                                                          Funds
30%                                                                          Insurance
20%                                                                          Companies

10%                                                                          Credit Institutions

 0%
       1999 2000 2001 2002 2003 2004 2005 2006 2007 2008 2009

 Source: Dirección General del Tesoro y Política Financiera.
                                                                                                   50
Stable and diversified investor base
                                       Letras del Tesoro by Holder
                                   (Term investment, % of total portfolio)
100%
                                                                                              Spanish Official
90%                                                                                           Institutions
80%                                                                                           Non-Residents
70%

60%                                                                                           Households & Non
                                                                                              financ.
50%
                                                                                              Pension and Mutual
40%                                                                                           Funds
        48.97%
30%                                                                                           Insurance companies
                                                                                     35.57%
20%

10%                                                                                           Credit Institutions

 0%
        1999     2000   2001    2002    2003    2004    2005    2006   2007   2008   2009

       Source: Dirección General del Tesoro y Política Financiera.
                                                                                                                    51
Stable and diversified investor base
                                     Government Bonds by Holder
                                    (Term investment, % of total portfolio)
30%


25%


20%


15%


10%


5%


0%
         France       Japan       Germany        Italy     BENELUX     Rest of EU   Asia, Afica   America   Rest of
                                                                                    and others              Europe
                                                   2006    2007     2008   2009
      Source: Dirección General del Tesoro y Política Financiera.
                                                                                                                      52
Top Primary Dealers in 2009

    Bonos y Obligaciones
          Barclays
            BBVA
           Calyon
          Santander
       Société Générale
       S iété Gé é l


           Letras
            BBVA
          Santander
       Société Générale


                              53
Thank you for your attention
José Manuel Campa Fernández– Secretary of State for the Economy
                  Fernández


Soledad Núñez – Directora General del Tesoro y Política Financiera
DirectorTesoro@tesoro.meh.es

Gonzalo García Andrés – S bdi
G     l G   í A d é     Subdirector G
                                t General d Gestión y Financiación de la Deuda Pública
                                        l de G tió    Fi    i ió d l D d Públi
ggarcía@tesoro.meh.es

José Ramón Martínez
jrmartinez@tesoro.meh.es

Rosa Moral
rmmoral@tesoro.meh.es

Leandro Navarro
lnavarro@tesoro.meh.es

Pablo de Ramón-Laca
pramonlaca@tesoro.meh.es
                                                                        For more information please contact:
Ignacio Vicente                                          Phone: 34 91 209 95 29/30/31/32 - Fax:34 91 209 97 10
ivicente@tesoro.meh.es
ivicente@tesoro meh es                                                                        Reuters: TESORO
                                                                                              Bloomberg: TESO
Rocío Chico                                                                            Internet: www.tesoro.es
mrchico@tesoro.meh.es
                                                                                                            54
Annex: the Social Security Reserve Fund

                       Social Security Reserve Fund asset holdings
          70   (Billon €)
          60
          50
          40
          30
          20
          10
           0
                2000


                          2001


                                 2002


                                        2003


                                                  2004


                                                         2005


                                                                2006


                                                                       2007


                                                                              2008


                                                                                     2009
The Social Security Reserve Fund amounted in December 2009 to approximately 5.7%
                                               (€ 60bn) of GDP.                             55
Annex: Ley de Economía Sostenible & General
    Agreement on Fiscal Sustainability

 Competitiveness                           Tax measures
                                           - Rental market: equal treatment with
 -   Society of Information.               ownership.
 -   Science, R&D.
     Science R&D                           - Elimination of tax rebates: i
                                              li i   i     f      b      i.e. relief
                                                                                li f
 -   Internationalisation of SME’s.        on mortgage payments, 400€ rebate
 -   Education.                            on income tax.
 -   Reduction of administrative burden.   - Corporate    Income    Tax     rebates
                                           related     to    R&D   and     to   the
                                           environment.


 Environment                               Fiscal Sustainability

                                           - Spanish    regions   to   formulate
 - Energy Policy.
                                           quarterly reports to the Fiscal Policy
 - CO2 Emission-reduction.
                                           Council.
 - Efficiency    of  transport       and
                                           - Correction and surveillance of fiscal
 infrastructure.
                                           deficits.
                                           - D bt/GDP ratio t
                                             Debt/GDP     ti  to reach li it of
                                                                      h limit    f
                                           60% by 2013.


                                                                                       56

Tesoro

  • 1.
    Kingdom of Spain EconomicPolicy and 2010 Funding Strategy Secretary of State for the Economy February 2010 y
  • 2.
    • Highlights • Thelong growth cycle and the crisis • Fi Fiscal consolidation and structural reform l lid ti d t t l f • Funding Strategy of the Kingdom of Spain g gy g p ~2009~ 1
  • 3.
    Highlights • Long growthcycle previous to the international crisis • Important challenges ahead: Unemployment and deficit, consequence of the crisis but also symptoms of underlying structural shortcomings • The Spanish Government is determined to act: p • Fiscal consolidation: A cut of 5.7% of GDP in structural primary deficit in 2010-2013 •SStructural reforms to boost potential GDP: Sustainable l f b i l GDP S i bl Economy, Bank Reorganisation, Pensions, Labour Market • Strengths: Sound financial system, low Debt/GDP, institutional ability for reform 2
  • 4.
    • Highlights • Thelong growth cycle and the crisis • Fiscal consolidation and structural reform • Funding Strategy of the Kingdom of Spain 3
  • 5.
    1994-2008: Convergence andDebt reduction • GDP per capita has leapt forward, exceeding the average of EU-25 • Fiscal rigour during the good times allowed debt to GDP to be more than halved GDP Debt to GDP (Year on year real growth rates) (% nominal GDP) 80% 6% Euro-area Spain 4% 70% 2% 60% Euro-area 0% 50% -2% Spain 40% -4% -6% 30% 2001 2000 0 2002 2 2003 3 2004 4 2005 5 2006 6 2007 7 2008 8 2009 9 1996 1997 1998 1999 2000 2001 2002 2003 2004 2005 2006 2007 2008 2009 Source: Eurostat. Source: Eurostat. 4
  • 6.
    Investment binge: housingand beyond • What has fuelled domestic demand is a soaring investment rate, with the national savings rate staying close to Eurozone average • The housing boom is part of the story, but not the whole story Savings rate Investment rate vs. Savings rate ( (% nominal GDP) ) (% nominal GDP) o a G ) 34 30 25 30 20 26 15 22 10 18 99 00 01 02 03 04 05 06 07 08 09 Belgium Germany Spain France Italy 199 200 200 200 200 200 200 200 200 200 200 2000 2005 2009* Savings rate Investment rate Source: Eurostat. Source: Eurostat. * 2009Q3 5
  • 7.
    Investment binge: housingand beyond • The residential real estate sector grabbed a non-sustainable share of GDP and employment… Construction Sector: Gross Value Added and Employment (% Total Value Added and of Total Employment) 14 13 12 11 10 9 8 7 6 995 996 997 999 000 001 002 003 004 005 006 007 009 998 008 19 19 19 19 19 20 20 20 20 20 20 20 20 20 20 Full-time equivalent employees Gross Value Added Source: National Statistics Institute, Spain. 6
  • 8.
    Investment binge: housingand beyond • …but Spain has also invested heavily in equipment, infrastructure and Research and Development Investment in equipment (average growth, 1995-2008 in percent) Public Investment 5.0 (% of GDP) 10 8 4.0 40 6 3.0 4 2.0 2 1.0 0 0.0 UK UK UK E U -15 E U -15 E U -15 Italy G erm any G erm any G erm any N etherlan N etherlan N etherlan D enm ark D enm ark D enm ark S pain S pain S pain A ustria Finland France France France 1995 1996 1997 1998 1999 2000 2001 2002 2003 2004 2005 2006 2007 2008 k k k y y y EU-27 EU 27 GERMANY FRANCE ITALY UK SPAIN nds nds nds Source: Eurostat. 7
  • 9.
    Intensive in employment • Residential construction attracted low skilled labour, dragging productivity lower • Labour supply matched this demand with the help of immigration flows Active population Labor productivity (Growth rates from 2005Q1 to 2009Q3) ( e at e (Relative to EU-27, PPP) U , ) 12% 107 10% 106 8% 105 104 6% 103 4% 102 2% 101 0% 100 Germany y Italy y Spain n France e Belgium m m Kingdom 1999 2000 2001 2002 2003 2004 2005 2006 2007 2008 2009 United Source: Eurostat. Labor Force Survey. Source: Eurostat. Labor Force Survey. 8
  • 10.
    Cost competitiveness • Loss of competitiveness has been moderate in the tradable sector • Nominal divergence stems from non-tradables (where the bulk of the adjustment is taking place) Unit labour cost index Manufacturing ULC index (Relative to eurozone 1999=100) (Relative to eurozone 1999=100) 125 140 120 130 115 120 110 110 105 100 100 90 95 80 999 000 001 002 003 004 005 006 007 008 009 999 000 001 002 003 004 005 006 007 008 009 19 20 20 20 20 20 20 20 20 20 20 19 20 20 20 20 20 20 20 20 20 20 Spain Italy Germany France Spain Italy Germany France Source: Eurostat. Source: Eurostat 9
  • 11.
    Exports show underlyingimprovement in supply • In spite of brisk domestic demand and waning price competitiveness… • …Spain's market shares have outperformed most of peers Share in world merchandise exports Share in world exports of services* (Index 2000=100) 150 (Index 2000=100) 120 110 125 100 90 100 80 75 70 60 50 2000 2001 2002 2003 2004 2005 2006 2007 2008 2009 2000 2001 2002 2003 2004 2005 2006 2007 2008 Spain Germany France United States Spain Germany France United States Source: International Monetary Fund. Source: World Trade Organisation. * Services other than transportation and travel. 10
  • 12.
    Services Exports’ marketshare has increased significantly • Among others, services related to architecture, construction and engineering have more than doubled market share Share!of!service!exports!in!the!OCDE,!by!service 10 2000 2007 8 6 4 2 0 otal! rism ment tion Entertainm ent Insurance cial Transportation and Professional ons services!to and!engineering al, es n, To Financ Communicatio construction service Otherr Architectura Royalties!a patentss Governm Tour Informat services Source: OECD. 11
  • 13.
    FDI flows haveincreased significantly • Outward FDI stock per capita has grown faster in Spain than in the Eurozone • Remains a major destination of international investment Outward FDI stock per capita Top receivers of FDI in 2008 relative to Eurozone (Stock in millions of US $) 2500000 0.90 2000000 0.85 0.80 1500000 0.75 1000000 0.70 500000 0.65 0 Germany UK US Belgium Hong Kong China Canada France Italy herlands Spain tzerland 0.60 2002 2003 2004 2005 2006 2007 2008 Neth G Swit Source: World Investment Report 2009 Source: World Investment Report 2009 12
  • 14.
    The crisis promptsan abrupt adjustment • Rapid downsizing of residential sector: output, L (mainly in temporary contracts) • Ripple effects on employment in other sectors Unemployment rate 20 (In percent) Sectoral employment 16 (total number) july 2008 sept 2009 dif % Total 19.382.121 17.935.095 -1.447.026 (100) 12 Construction 2.361.177 1.752.157 -609.021 (42,1) Industry 2.731.068 2.377.211 -353.857 353.857 (24,5) 8 Services 13.150.027 12.599.061 -550.966 (38,1) Sources: Eurostat. Labor Force Survey. 4 2005 2006 2007 2008 2009 Spain Euro area (16 countries) Sources: Eurostat. Labor Force Survey. 13
  • 15.
    Changes in sectoraland external balances • Large swing in private sector balance: plummeting Investment and soaring Savings • Government Deficit jumps, but 2.5 points of GDP are one-off • Current Account deficit has halved in 2009 Sectoral balances (% of GDP) Public Sector Balance 8 6,5 6 Private Sector 4 1,9 2 % 0 -2 -4 -6 -4,1 -5,0 -8 -10 -12 -11,0 -11,4 -14 2007 2008 2009 Source: National Statistics Institute, Spain. 14
  • 16.
    • Hi hliht Highlights • The long growth cycle and the crisis • Fiscal consolidation and structural reform • Funding Strategy of the Kingdom of Spain 15
  • 17.
    Policy Strategy forSustainable Growth • Prudent Macroeconomic Scenario 2010-2013 • Agreement on Fiscal Consolidation to bring the deficit g g back to 3% in 2013 • Structural Reforms: • Structural Reforms in the goods markets • Public Pensions System • Labour Market • Banking sector Restructuring 16
  • 18.
    The Government’s Macroeconomicscenario • The output gap will be closed by 2013, after peaking in 2010 • External demand contribution to GDP will gradually wane as do est c de a d gat e s stea domestic demand gathers steam • Potential growth will recover from a trough of 0.6% in 2010 to 1.6% in 2013 Macroeconomic scenario 2009-2013 2009 2010 2011 2012 2013 (Growth rate in percent) GDP -3.6 -0.3 1.8 2.9 3.1 Final Consumption Expenditure -2.4 0.3 1.7 2.2 2.1 Gross Fixed Capital Formation -15.7 15 7 -6.5 65 0.3 03 4.2 42 5.9 59 National Demand (contribution to GDP growth) -6.4 -1.4 1.4 2.6 3.0 Exports of Goods and Services -12.4 2.8 5.2 6.9 7.4 Imports of Goods and Services -18.7 -1.3 3.7 5.8 6.8 External demand (contribution to GDP growth) 2.8 1.1 0.4 0.3 0.1 Source: Annual update of the Stability Programme. 17
  • 19.
    Fiscal consolidation strategy • Substantial reduction in Spending and moderate increase in Revenues • Already in 2010 a 2.2% cut in structural deficit Fiscal Adjustment Path 2009-2013 2009 2010 2011 2012 2013 (Growth rate in percent) GDP -3.6 -0.3 1.8 2.9 3.1 General Government Budget Balance (% of GDP) G lG tB d tB l f -11.4 11 4 -9.8 98 -7.5 75 -5.3 53 -3.0 30 General Government Gross Debt (% of GDP) 55.2 65.9 71.9 74.3 74.1 Source: Annual update of the Stability Programme. 18
  • 20.
    Starting and finalpoints of fiscal consolidation • Temporary measures (changes in tax collection, one off investment funds) account for 2.4% points of GDP in 2009’s total deficit • Total size of fiscal policy adjustment (structural terms): 5.7% of GDP Fiscal position 2009 2013 General Government Balance (1) -11,4 -3 Cyclical component (2) -1,4 0 Interest payments (3) -1 9 1,9 -3 1 3,1 Temporary measures (4) -2,5 0 Structural Primary Balance (1)-(2)-(3)-(4) -5,6 0,1 Source: Annual update of the Stability Programme. 19
  • 21.
    Fiscal restraint measures Measuresadopted and announced (% of GDP) Revenues Expenditures VAT 0.7 Excise Taxes 0.3 400€ Tax Rebate Reform 0.4 2010 Budget Savings Tax Reform 0.1 SME Corporate Tax Reform -0.1 Government Expenditure -0.8 Additional cut in 2010 Expenditure -0.5 New Measures* Central Government Austerity Plan 2011-2013 -2.6 Regional and local government Spending cuts R i l dl l tS di t -0.5 05 Source: Annual update of the Stability Programme. • Restraint in wage outlays for all public administrations through: • 10% replacement rate • No new temporary hiring • Strong moderation in wages • Sizable cuts in investment, transfers and subsidies 20
  • 22.
    Can we implementthis? • We have done it in the past which proves our compromise the past, compromise, quality of our public finances, and the success of our fiscal discipline. • Shared commitment to fiscal discipline and margin to secure further reductions in the deficit Net Lending (+)/Borrowing (-) of General Government 4.0 (% nominal GDP EDP) GDP, 2.0 0.0 -2.0 40 -4.0 -6.0 -8.0 -10.0 -12.0 -14.0 1995 1996 1997 1998 1999 2000 2001 2002 2003 2004 2005 2006 2007 2008 2009 2010* 2011* 2012* 2013* * Annual update of the Stability Programme. 21
  • 23.
    Debt dynamics • Evenafter the impact of strong stabilisation policies, Spain's Debt to GDP is significantly lower that the Eurozone average Gross Debt-to-GDP (%) Gross Debt-to-GDP (%) 2000-2010 2010F 90 125.0 France 112.5 80 Germany Eurozone Spain 100.0 Average: 84.0% 70 87.5 75.0 60 65 9 65.9 62.5 62 5 50.0 50 55.2 37.5 40 25.0 39.7 12.5 30 0.0 2000 2001 2002 2003 2004 2005 2006 2007 2008 2009 2010 Spain Ireland France Germany Italy UK USA Sources: European Commission, Annual update of the Stability Programme and International Monetary Fund. 22
  • 24.
    Lowest interest burdenwithin affordable limits Ratio of interests to GDP of General Government (% nominal GDP, EDP) 13 11 9 7 5 3 1 * * 95 98 03 04 06 08 96 97 99 00 01 02 05 07 09 10 19 19 19 19 19 20 20 20 20 20 20 20 20 20 20 20 Spain Germany France Belgium Italy UK Source: European Commission. * European Economic Forecast Autumn 2009, European Commission. 23
  • 25.
    Structural Reforms inproduct markets • Improving the institutional environment for business: by modernizing and simplifying government activities as well as increasing general government discipline • Fostering competitiveness: by reducing the administrative burden of creating companies and reducing red tape • Fostering modernization: promoting sectors that are at the base of economic activity (R&D, innovation and training), improving support f for their integration into the overall value chain, and h h ll l h d facilitating the internationalization of businesses Estimated impact on GDP ! + 0.32% in Potential GDP 24
  • 26.
    Residential Real EstateSector • Phasing out fiscal incentives for housing ownership from 2011 (deduction of mortgage payments) • Removing barriers to the development of the rental market: • Same fiscal treatment than ownership • C Creation of REITS ti f • Legal changes to strengthen certainty for landlords • Tax Incentives for refurbishment provide some support p pp 25
  • 27.
    26 Preventive financial supportmeasures reorganisation enhancement Capital and stimulus Credit Liquidity enhancement 9 b n € c Ea xp ti I et n na d M dl e & e- p A d e4 2 H n8 b 37 D i d a 0S e g e2 b nb e h n0 n k Jn c f t€ iq uo a b R , n€ n c u fn i g ed t 1 a us a g o 9 l nk € r a 2u t , . i do r 0a i 3 it s u m 1r e p y m m O O R B R A A B n n iC g 2 l0 0 8 2 0 0 9 n u o n o a a g e u n n a ia a d g e e k in C F F F z e s u u d ni h s u e n h n n q d ( - ) r n a r e e e y t t L s s iI c f i i r t t i t l i t i 0a r h b gn a d on .n a c r c t f€ f s o ai e 1 Bu e l nn 5 s ue n d l d2 g 0 u td a 0 pi o t m0 b e mf n u e a7 o r au g t r nn v rn . a ad d il k gs s ei e o tn m r sg e n oa t pu et nh o r i z e
  • 28.
    The financial systemremains resilient • Main source of perceived vulnerability regards losses stemming from lending to real estate developers i f l di l d l • Bank of Spain stress test: Operating income over 3 years is able to absorb losses of 40% of the portfolio of lending to real estate developers. • Extreme assumptions of stress test: PD of 40%(3 times th peak of 1993) and LGD of 100 % (hi hl ti the k f d f (highly implausible) 27
  • 29.
    FROB: a toolfor restructuring the banking sector Rationale for the initiative Governance - Overcoming fragmentation in the - Independent management. savings and banks sector. - Strong accountability to Parliament Parliament. - Achievement of economies of scale to digest low interest margins and real - Authorized by DG Competition. estate impact. Asset Operations Funding - Support to integration processes subject - Public-private mix of capital (9 bn€). to conditions set by the banking supervisor. - Agency-like funding programme coordinated with the sovereign - Instrumented through convertible programme. preference shares with market-oriented remuneration. 28
  • 30.
    Pension System Reform ProposedMeasures: • A progressive increase in the retirement age (to 67 years) • Strengthening relationship between contributions and benefits • A more flexible relationship between complementary social p p y security and the public system • Possible adjustment of other parameters of the current system Expected Results: Sustainability of the pension system 29
  • 31.
    Labour Market Reform •Five main guidelines: • St bilit in employment, by reducing market segmentation Stability i l t b d i k t t ti • Reform of Collective Bargaining system • Incentives for young workers’ employment and education workers • Promotion of the integration of women in the labour market • Worker intermediation and greater control of temporary occupational disability claims 30
  • 32.
    • Highlights • Thelong growth cycle and the crisis • Fiscal consolidation and structural reform • Funding Strategy of the Kingdom of Spain 31
  • 33.
    Highlights of FundingStrategy • Significant reduction in net funding requirements and persistence of sound risk metrics • Liquidity transparency and predictability will continue Liquidity, as guiding principles for the execution of our auction program • As for syndications, timing is dictated by the limit size of the line to be replaced (16.5 bn for longer tenors) and market conditions. • Innovations for 2010: 18 month T bills reappear Euro 18-month T-bills reappear, inflation linker still a project • Maintain our stable and diversified investor base 32
  • 34.
    The funding strategy TesoroFunding in 2010 (Billion euro) 1: Funding requirement = Net Issuance 76.8 2: Redemptions bonds 2010 35.4 3: Net issuance medium long term 61.6 4 = 2 + 3 Gross Issuance Medium-Long Term 97,0 5: Net Increase T-Bills 15.2 6: Assumption of RTVE debt 1.5 7 = 3 + 5 + 6: Net change outstanding debt 78.3 8: Forecast Outstanding Central Government Debt at end 2010 553.5 Source: General State Budgets Bill 2010 33
  • 35.
    Funding programme inperspective • Cut in Net Issuance: lower cash deficit and no exceptional increase in net financial assets Funding Programme. 2010 vs. 2009 140 (Net issuance in billion Euro) 120 116.7 2009 2010 100 82.3 76.8 80 61.6 60 40 34.4 34 4 20 15.2 0 Total N t I T t l Net Issuance Letras del Tesoro net M di L t d lT t Medium & long term l t issues net issues* (*) Includes foreign currency issues. Source: Dirección General del Tesoro y Política Financiera. 34
  • 36.
    Short-term funding • Netissuance in 2009 in line with initial announcement: 34.4 bn€. Gross issuance breakdown: • 3-month Letras: 19.7 bn€ • 6-month Letras: 31.6 bn€ • 12-month Letras: 58.0 bn€ 12 month • Innovations in 2010: • Calendar change: 3- and 6-month Letras auction 4th Tuesday • 18-month T-bills relaunched: auction 3rd Tuesday 35
  • 37.
    Medium- and long-termfunding • Gross issuance: 2009 overshooting (ca. 25 bn €) due to higher than expected impact of the crisis • Auction procedures unchanged: Quarterly calendar + potential off- the-run lines announced Friday prior to the auction • Limit size per line: increased to 16.5 bn € for longer lines • Bonos del Estado: • New 5-year benchmark in March • Current 3-year benchmark B 2.30% 04/2013 issued until 15 bn € • Obli Obligaciones d l E t d i del Estado: • New 10 year O 4.00% 04/2020 (5 bn €) successfully syndicated in January • Next syndication a 15 year line, to replace the matured O 4.80% Jan- 2024), expected for February depending on market conditions 36
  • 38.
    Diversification of fundingsources • Recent foreign currency issuance: • Eurobond 2.75% March 2012 ($ 1.0 billion) • Eurobond 2 00% October 2012 ($ 2 5 billion) 2.00% 2.5 • Tesoro Público is open to additional foreign currency issuance • Floating Rate Note 3-Month EURIBOR-10 bps, October 2012 3 Month EURIBOR 10 (€ 3.0 billion). Possible retapping in 2010 • Projects: • European inflation-linked issues (HICP-ex tobacco) • Schuldschein loans 37
  • 39.
    Main features ofTreasury funding strategy 600 Spanish debt portfolio 554 (€ billion) 500 475 400 358 319 312 307 300 229 200 100 0 995 996 997 998 999 000 001 002 003 004 005 006 007 008 009 2010 (f) 19 19 19 19 19 20 20 20 20 20 20 20 20 20 20 0 Foreign Currency Other Letras Bonos y Obligaciones Source: Dirección General del Tesoro y Política Financiera. 38
  • 40.
    -75 -50 -25 25 0 25 50 75 100 125 150 Sep-0 07 Oct-0 07 Nov-0 07 Dec-0 07 Jan-0 08 Source: Bloomberg. Feb-0 08 Mar-0 08 Apr-08 Germany May-0 08 Jun-008 Jul-0 08 Italy Aug-08 Sep-008 Oct-008 Nov-0 08 France Dec-0 08 (in bps) Jan-0 09 Feb-0 09 Mar-0 09 Apr-09 Belgium May-009 Jun-009 Jul-0 09 Aug-09 Sep-0 09 Netherlands Oct-0 09 Nov-0 09 Dec-0 09 Jan-10 Spread of the Spanish 10-year bond vs. main European peers Recent widening might be an opportunity Feb-10 39
  • 41.
    -75 -50 -25 25 0 25 50 75 100 125 150 S Sep-0 07 Oct-0 07 Nov-0 07 Dec-0 07 Jan-008 Source: Bloomberg. Feb-008 Mar-008 Spread of th S Apr-0 08 Germany May-008 Jun-008 Jul-0 08 i h5 Italy Aug-0 08 Sep-0 08 Oct-0 08 Nov-0 08 Dec-0 08 France (in bps) b d Jan-0 09 Feb-0 09 Mar-0 09 Apr-0 09 Belgium May-0 09 Jun-009 i E Jul-0 09 Aug-0 09 Sep-0 09 Netherlands Oct-0 09 Nov-0 09 Dec-0 09 Jan-1 10 d f the Spanish 5-year bond vs. main European peers Cheapening concentrated in the front end Feb-1 10 40
  • 42.
    An atractive marketto invest in Attractive prices Liquid instruments Solid and efficient Diversified investor infrastructure base 41
  • 43.
    Increase in marketliquidity Average outstanding size: 13 5 b € A t t di i 13.5 bn Target for average outstanding <10 years: 15 bn € 20 Target for average outstanding >10 years: 15 bn € 18 On-the-run bonds 4.10% 6.00% 3.25% 5.40% 4.40% 16 4.10% 4 10% 3.90% 3 90% 4.20% 4 20% 3.30% 3.15% 3 15% 5.50% 5 50% 4.30% 4 30% 4.20% 5.35% 6.15% 4.75% 4.60% 4.80% 14 5.00% 3.80% 5.75% 4.25% 4.90% 2.75% 12 2.30% 10 8 6 4.00% 4.70% 4 2 0 Jul-10 Jul-11 Jul-12 Jul-13 Jul-14 Jul-17 Jul-18 Jul-19 Jul-32 Jul-40 Jul-41 -13 -14 -15 -16 -17 -24 -29 -37 -11 -11 -12 -12 -13 -14 -19 -20 Jan- Jan- Jan- Jan- Jan- Jan- Jan- Jan- Apr- Oct- Apr- Oct- Apr- Oct- Oct- Apr- Source: Dirección General del Tesoro y Política Financiera. 42
  • 44.
    Low Debt RefinancingRisk… Redemption profile of Bonos & Obligaciones (Million Euros) 50.000 45.000 40.000 35.000 30.000 30 000 25.000 20.000 15.000 10.000 5.000 0 2010 2011 2012 2013 2014 2015 2016 2017 2018 2019 2020- 2024 2029 2032 2037 2040 2041 2023 Source: Dirección General del Tesoro y Política Financiera. 43
  • 45.
    Low Debt RefinancingRisk… Central Government Debt refinancing risk (in % of the total portfolio) 50 42 40 30 24 (%) 20 21 22 21 20 18 18 10 7 0 1 year or less 1 to 3 years 3 to 5 years 31.12.1995 31.12.1999 31.01.2010 Source: Dirección General del Tesoro y Política Financiera. 44
  • 46.
    …Thanks to relativelyhigh duration and average life to maturity… Duration & Average Life to Maturity of the Portfolio (Letras, Bonos and Obligaciones) 8.0 (in years) 6.69 6 69 6.78 6 78 5.52 6.0 4.79 4.77 4.0 4.16 Average life France 6,24 2.0 Netherlands 6,88 Belgium 5,94 Italy 7,07 0.0 2000 2001 2002 2003 2004 2005 2006 2007 2008 2009 2010 Duration Average life Source: Dirección General del Tesoro y Política Financiera. 45
  • 47.
    …while achieving lowerFunding Costs Average Funding Costs (in percent) 6.0 5.5 5.0 4.5 4.32 4.0 3.5 3.81 3.49 3.0 2.5 2.27 2.0 1.5 1.0 2000 2001 2002 2003 2004 2005 2006 2007 2008 2009 2010 Average cost of Debt outstanding Average cost at issuance Source: Dirección General del Tesoro y Política Financiera. 46
  • 48.
    Reliance on foreignfunding relatively moderate External public sector debt in 2009 100 (% of GDP) 90 80 70 60 50 40 30 20 10 0 Italy Argentina Germany Greece Austria Ireland France Finland United Spain Belgium Kingdom herlands States United G K Neth A Source: OECD. 47
  • 49.
    Banks financing ofgovernment debt in line with Eurozone average Holdings of government debt November 2009 (% of bank assets) 25 20 15 10 5 0 ermany ortugal Belgium Ireland Finland lovakia Greece France Eur area Italy erlands Spain Austria ro Po F F G A Nethe Ge B Sl Source: Citi. 48
  • 50.
    Spanish Banks’ fundingfrom ECB around Eurozone average Recourse to ECB funding (% of total bank assets) 10% 8% 6% 4% 2% 0% IRL IT FI NL GR AU FR PO GE ESP BE jul-08 jul 08 oct-09 oct 09 Source: Deutsche Bank. 49
  • 51.
    Stable and diversifiedinvestor base Government Bonds by Holder (Term investment, % of total portfolio) 100% Spanish official 90% institutions 33.37% 80% Non residents 70% 43.94% 60% Households & Non financ. 50% Pension & Mutual 40% Funds 30% Insurance 20% Companies 10% Credit Institutions 0% 1999 2000 2001 2002 2003 2004 2005 2006 2007 2008 2009 Source: Dirección General del Tesoro y Política Financiera. 50
  • 52.
    Stable and diversifiedinvestor base Letras del Tesoro by Holder (Term investment, % of total portfolio) 100% Spanish Official 90% Institutions 80% Non-Residents 70% 60% Households & Non financ. 50% Pension and Mutual 40% Funds 48.97% 30% Insurance companies 35.57% 20% 10% Credit Institutions 0% 1999 2000 2001 2002 2003 2004 2005 2006 2007 2008 2009 Source: Dirección General del Tesoro y Política Financiera. 51
  • 53.
    Stable and diversifiedinvestor base Government Bonds by Holder (Term investment, % of total portfolio) 30% 25% 20% 15% 10% 5% 0% France Japan Germany Italy BENELUX Rest of EU Asia, Afica America Rest of and others Europe 2006 2007 2008 2009 Source: Dirección General del Tesoro y Política Financiera. 52
  • 54.
    Top Primary Dealersin 2009 Bonos y Obligaciones Barclays BBVA Calyon Santander Société Générale S iété Gé é l Letras BBVA Santander Société Générale 53
  • 55.
    Thank you foryour attention José Manuel Campa Fernández– Secretary of State for the Economy Fernández Soledad Núñez – Directora General del Tesoro y Política Financiera DirectorTesoro@tesoro.meh.es Gonzalo García Andrés – S bdi G l G í A d é Subdirector G t General d Gestión y Financiación de la Deuda Pública l de G tió Fi i ió d l D d Públi ggarcía@tesoro.meh.es José Ramón Martínez jrmartinez@tesoro.meh.es Rosa Moral rmmoral@tesoro.meh.es Leandro Navarro lnavarro@tesoro.meh.es Pablo de Ramón-Laca pramonlaca@tesoro.meh.es For more information please contact: Ignacio Vicente Phone: 34 91 209 95 29/30/31/32 - Fax:34 91 209 97 10 ivicente@tesoro.meh.es ivicente@tesoro meh es Reuters: TESORO Bloomberg: TESO Rocío Chico Internet: www.tesoro.es mrchico@tesoro.meh.es 54
  • 56.
    Annex: the SocialSecurity Reserve Fund Social Security Reserve Fund asset holdings 70 (Billon €) 60 50 40 30 20 10 0 2000 2001 2002 2003 2004 2005 2006 2007 2008 2009 The Social Security Reserve Fund amounted in December 2009 to approximately 5.7% (€ 60bn) of GDP. 55
  • 57.
    Annex: Ley deEconomía Sostenible & General Agreement on Fiscal Sustainability Competitiveness Tax measures - Rental market: equal treatment with - Society of Information. ownership. - Science, R&D. Science R&D - Elimination of tax rebates: i li i i f b i.e. relief li f - Internationalisation of SME’s. on mortgage payments, 400€ rebate - Education. on income tax. - Reduction of administrative burden. - Corporate Income Tax rebates related to R&D and to the environment. Environment Fiscal Sustainability - Spanish regions to formulate - Energy Policy. quarterly reports to the Fiscal Policy - CO2 Emission-reduction. Council. - Efficiency of transport and - Correction and surveillance of fiscal infrastructure. deficits. - D bt/GDP ratio t Debt/GDP ti to reach li it of h limit f 60% by 2013. 56