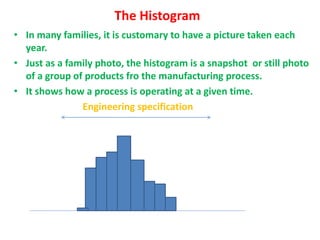
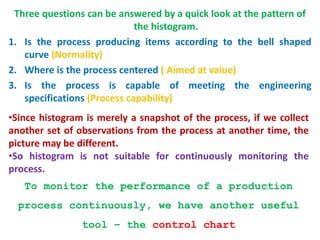
STATISTICAL QUALITY CONTROL
Dr. Mathachan Pathiyil
Nirmala College
Muvattupuzha
2011
The most important word in
Statistical Quality control is Quality
The quality of a product is satisfactory when it is able to satisfy the
stated and implied needs of the customer.
• Customer or consumer is a person or organization that use the
product.
• Quality doesn’t mean merely the goodness or fitness of a
finished product. It is a relative term and is used generally with
reference to the end use of the product.
• Since a product is manufactured for the use of a customer, the
requirements of the customer dictates the quality of the
product.
Quality is to be planned, achieved, controlled and
improved continuously.
• Distinct meanings of quality
- Quality of Design
- Quality of Conformance
Quality of design refers to the differences in the
specifications for products which have the same use.
Eg.: Different brands of razor blades may differ in their
specifications w.r.to the steel used, sharpness, corrosiveness,
price etc., though they serve the same functional purpose.
Quality of design thus refers to the method of
construction, processing, material used, style factors,
safety factors etc.
• Quality of conformance refers to the ability of the
production process to maintain the specified quality of
design in the long run.
In other words, Quality of conformance may be
considered as the measure of truthfulness with which
the product conforms to the design specifications.
•Quality control is a name given to the collection of
techniques and devices used to manage, monitor and
control all the steps in the production of a product of
desired quality.
It is a powerful statistical technique for effective
diagnosis of lack of quality (or lack of conformity to
settled standards)in any of the materials, processes,
machines or end products.
Aims or Objectives of SQC
• To improve the company's income by manufacturing products
more acceptable to the customers, providing long life, greater
usefulness, maintainability etc.
• To reduce company’s cost through reduction of the losses due to
defects(non conformities), ie. to achieve lower scrap, rework,
customer returns etc.
• To produce optimum quality at minimum cost.
• To ensure satisfaction of consumers with products to build
goodwill, confidence, reputation of manufacturers.
• Judging conformity of the products to the stated standards and
taking suitable action where there are non conformities.
• Developing quality consciousness in the organization.
• Provide a running commentary on the performance of machines
and operations in the production process.
Quality Characteristics
• When quality is considered, it is specified by one or
more characteristics and can be studied independently
or jointly.
• The quality may be
• Technological
(Strength, Hardness, Diameter, Life length etc.)
• Psychological
(Taste, Beauty, odour etc.)
• Ethical
(Honesty, Integrity, Incorruptibility etc.)
• Contractual
(Guarantee, Safety, Provisions etc.)
The quality characteristics observed in industry may be
generally classified into any of the following categories
• Directly measurable (Variable)
( Thickness, life length, temperature, tensile strength etc.,
producing continuous data)
• Non-measurable (Attributes)
(Cracks, Breakages, Assembly defects, Air bubbles etc.,
producing discrete data)
Causes of Variation
• Once the design of quality has been specified, the whole
production process will be adjusted to manufacture the
product according to the specifications.
• At this stage, the problem of conformance ( producing items
that conforms to the design specifications) starts.
• The problem arise from the fact that every manufacturing
process exhibits variability.
• Variation in the quality of manufactured product in the
repetitive process in industry is inherent and unavoidable.
Variation may be due to
tool wear, machine vibrations, loose bearings, faulty
fixtures, humidity, poor ventilation, poor quality of
raw materials, carelessness of labours, inexperienced
operators, weather, voltage fluctuations, poor
maintenance, measuring errors etc.
•The variations affecting a production process are broadly
classified as being due to two causes
– Chance causes (common causes/random causes)
- Assignable causes(non random causes or special causes)
Chance causes
• Minor causes that behaves in a random manner.
•The variation due to these causes is beyond the control of
human hand
• Cannot be prevented or eliminated under any circumstances
• Many in number
• Each contribute a little to the variation
• Are continuously active in the process and are built in as a
part of the process.
The natural or inherent variability of the process is the cumulative
effect of these uncontrollable chance causes.
The range of such variations (called allowable variation) is known as
natural tolerance of the production process.
•Assignable causes
Generally few in number
Each has a significant effect in the variation of the
output of the process.
Can be detected
Can be eliminated from the process
Such variations are termed as preventable variation.
Natural or
Inherent or
Allowable
Variation
Un natural or
External or
Preventable
Variation
Total Variation in
the production
process
The main purpose of Statistical Quality Control is to derive
statistical techniques which would help us in separating the
assignable causes of variation from the chance causes of variation,
thus enabling to take actions whenever assignable causes are
present in the production process.
• The elimination of assignable causes is described as bringing a
process under control.
• A production process is said to be under statistical control
( or simply under control), if it is governed by chance causes
only, in the absence of assignable causes of variation.
Process behavior in an out of control state
Process behavior in an in control state
Elimination of assignable causes brings
the process to a state of control
In any production process, our main aim is to control and maintain
the quality of the manufactured product during production so that it
conforms to the specified quality standards. The methods used for
this are called process control techniques and is generally achieved
through the technique of control charts developed by W. A.
Shewhart.
By product control we mean controlling the quality of the product
after its production by critical examination at strategic points
and this is mainly achieved by using Sampling inspection Plans
proposed by Dodge and Roming.
Product control aims at guaranteeing a certain quality level to the
consumer regardless of what quality level is maintained by the
producer.
In short, process control techniques aims to ensure that
all the produced items are conforming to the specified
quality standards and product control techniques
attempts to ensure that the products marketed doesn't
contain a large number of unsatisfactory items.
Basic principles of SQC
• In a production process, we are trying constantly to make
products that meet the customers requirements.
• We are also trying to make each items or products as much like
as the others as possible.
• For this we must keep control of our operations.
• Just like a doctor use temperature, pulse rate, blood pressure
readings, sugar levels, cholesterol levels etc. to keep track of the
patients condition, we use control charts to monitor the
condition of our production process .
• When properly used, control charts will tell us three things,
- When we are doing some thing we should not
- When we are not doing something we should
- When we are doing things right
Generally, control charts will indicate how well our job is. They will
provide us with STOP and GO signals.
The ideas and techniques of statistical process control
are based on the following six principles.
1. No two things are exactly alike( ie. Variability is inherent in all
production processes.
2. Variation in a product or process can be measured.
3. Things vary according to a definite pattern
4. Whenever things of the same kind are measured, a large group
of the measurements cluster around the middle ( normal curve
assumption)
5. It is possible to determine the shape of the distribution curve for
products manufactured by any process.
6. Variation due to assignable causes tend to distort the normal
distribution curve.
Statistical methods give us a way to picturise and
control quality through use of Histograms and
Control charts
The Histogram
• In many families, it is customary to have a picture taken each
year.
• Just as a family photo, the histogram is a snapshot or still photo
of a group of products fro the manufacturing process.
• It shows how a process is operating at a given time.
Engineering specification
Three questions can be answered by a quick look at the pattern of
the histogram.
1. Is the process producing items according to the bell shaped
curve (Normality)
2. Where is the process centered ( Aimed at value)
3. Is the process is capable of meeting the engineering
specifications (Process capability)
•Since histogram is merely a snapshot of the process, if we collect
another set of observations from the process at another time, the
picture may be different.
•So histogram is not suitable for continuously monitoring the
process.
To monitor the performance of a production
process continuously, we have another useful
tool – the control chart

STATISTICAL-QUALITY-CONTROL-ppt-3-2 (1).ppt

  • 1.
    STATISTICAL QUALITY CONTROL Dr.Mathachan Pathiyil Nirmala College Muvattupuzha 2011
  • 2.
    The most importantword in Statistical Quality control is Quality The quality of a product is satisfactory when it is able to satisfy the stated and implied needs of the customer. • Customer or consumer is a person or organization that use the product. • Quality doesn’t mean merely the goodness or fitness of a finished product. It is a relative term and is used generally with reference to the end use of the product. • Since a product is manufactured for the use of a customer, the requirements of the customer dictates the quality of the product. Quality is to be planned, achieved, controlled and improved continuously.
  • 3.
    • Distinct meaningsof quality - Quality of Design - Quality of Conformance Quality of design refers to the differences in the specifications for products which have the same use. Eg.: Different brands of razor blades may differ in their specifications w.r.to the steel used, sharpness, corrosiveness, price etc., though they serve the same functional purpose. Quality of design thus refers to the method of construction, processing, material used, style factors, safety factors etc.
  • 4.
    • Quality ofconformance refers to the ability of the production process to maintain the specified quality of design in the long run. In other words, Quality of conformance may be considered as the measure of truthfulness with which the product conforms to the design specifications.
  • 5.
    •Quality control isa name given to the collection of techniques and devices used to manage, monitor and control all the steps in the production of a product of desired quality. It is a powerful statistical technique for effective diagnosis of lack of quality (or lack of conformity to settled standards)in any of the materials, processes, machines or end products.
  • 6.
    Aims or Objectivesof SQC • To improve the company's income by manufacturing products more acceptable to the customers, providing long life, greater usefulness, maintainability etc. • To reduce company’s cost through reduction of the losses due to defects(non conformities), ie. to achieve lower scrap, rework, customer returns etc. • To produce optimum quality at minimum cost. • To ensure satisfaction of consumers with products to build goodwill, confidence, reputation of manufacturers. • Judging conformity of the products to the stated standards and taking suitable action where there are non conformities. • Developing quality consciousness in the organization. • Provide a running commentary on the performance of machines and operations in the production process.
  • 7.
    Quality Characteristics • Whenquality is considered, it is specified by one or more characteristics and can be studied independently or jointly. • The quality may be • Technological (Strength, Hardness, Diameter, Life length etc.) • Psychological (Taste, Beauty, odour etc.) • Ethical (Honesty, Integrity, Incorruptibility etc.) • Contractual (Guarantee, Safety, Provisions etc.)
  • 8.
    The quality characteristicsobserved in industry may be generally classified into any of the following categories • Directly measurable (Variable) ( Thickness, life length, temperature, tensile strength etc., producing continuous data) • Non-measurable (Attributes) (Cracks, Breakages, Assembly defects, Air bubbles etc., producing discrete data)
  • 9.
    Causes of Variation •Once the design of quality has been specified, the whole production process will be adjusted to manufacture the product according to the specifications. • At this stage, the problem of conformance ( producing items that conforms to the design specifications) starts. • The problem arise from the fact that every manufacturing process exhibits variability. • Variation in the quality of manufactured product in the repetitive process in industry is inherent and unavoidable. Variation may be due to tool wear, machine vibrations, loose bearings, faulty fixtures, humidity, poor ventilation, poor quality of raw materials, carelessness of labours, inexperienced operators, weather, voltage fluctuations, poor maintenance, measuring errors etc.
  • 10.
    •The variations affectinga production process are broadly classified as being due to two causes – Chance causes (common causes/random causes) - Assignable causes(non random causes or special causes) Chance causes • Minor causes that behaves in a random manner. •The variation due to these causes is beyond the control of human hand • Cannot be prevented or eliminated under any circumstances • Many in number • Each contribute a little to the variation • Are continuously active in the process and are built in as a part of the process. The natural or inherent variability of the process is the cumulative effect of these uncontrollable chance causes. The range of such variations (called allowable variation) is known as natural tolerance of the production process.
  • 11.
    •Assignable causes Generally fewin number Each has a significant effect in the variation of the output of the process. Can be detected Can be eliminated from the process Such variations are termed as preventable variation. Natural or Inherent or Allowable Variation Un natural or External or Preventable Variation Total Variation in the production process
  • 12.
    The main purposeof Statistical Quality Control is to derive statistical techniques which would help us in separating the assignable causes of variation from the chance causes of variation, thus enabling to take actions whenever assignable causes are present in the production process. • The elimination of assignable causes is described as bringing a process under control. • A production process is said to be under statistical control ( or simply under control), if it is governed by chance causes only, in the absence of assignable causes of variation.
  • 13.
    Process behavior inan out of control state Process behavior in an in control state Elimination of assignable causes brings the process to a state of control
  • 14.
    In any productionprocess, our main aim is to control and maintain the quality of the manufactured product during production so that it conforms to the specified quality standards. The methods used for this are called process control techniques and is generally achieved through the technique of control charts developed by W. A. Shewhart. By product control we mean controlling the quality of the product after its production by critical examination at strategic points and this is mainly achieved by using Sampling inspection Plans proposed by Dodge and Roming. Product control aims at guaranteeing a certain quality level to the consumer regardless of what quality level is maintained by the producer. In short, process control techniques aims to ensure that all the produced items are conforming to the specified quality standards and product control techniques attempts to ensure that the products marketed doesn't contain a large number of unsatisfactory items.
  • 15.
    Basic principles ofSQC • In a production process, we are trying constantly to make products that meet the customers requirements. • We are also trying to make each items or products as much like as the others as possible. • For this we must keep control of our operations. • Just like a doctor use temperature, pulse rate, blood pressure readings, sugar levels, cholesterol levels etc. to keep track of the patients condition, we use control charts to monitor the condition of our production process . • When properly used, control charts will tell us three things, - When we are doing some thing we should not - When we are not doing something we should - When we are doing things right Generally, control charts will indicate how well our job is. They will provide us with STOP and GO signals.
  • 16.
    The ideas andtechniques of statistical process control are based on the following six principles. 1. No two things are exactly alike( ie. Variability is inherent in all production processes. 2. Variation in a product or process can be measured. 3. Things vary according to a definite pattern 4. Whenever things of the same kind are measured, a large group of the measurements cluster around the middle ( normal curve assumption) 5. It is possible to determine the shape of the distribution curve for products manufactured by any process. 6. Variation due to assignable causes tend to distort the normal distribution curve. Statistical methods give us a way to picturise and control quality through use of Histograms and Control charts
  • 17.
    The Histogram • Inmany families, it is customary to have a picture taken each year. • Just as a family photo, the histogram is a snapshot or still photo of a group of products fro the manufacturing process. • It shows how a process is operating at a given time. Engineering specification
  • 18.
    Three questions canbe answered by a quick look at the pattern of the histogram. 1. Is the process producing items according to the bell shaped curve (Normality) 2. Where is the process centered ( Aimed at value) 3. Is the process is capable of meeting the engineering specifications (Process capability) •Since histogram is merely a snapshot of the process, if we collect another set of observations from the process at another time, the picture may be different. •So histogram is not suitable for continuously monitoring the process. To monitor the performance of a production process continuously, we have another useful tool – the control chart