
Recommended
Recommended
More Related Content
Similar to SABAS.PPT
Similar to SABAS.PPT (20)
Recently uploaded
Recently uploaded (20)
SABAS.PPT
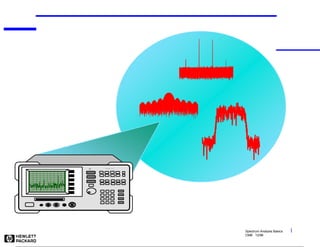
- 1. Spectrum Analysis Basics CMB 12/96 1 8563A SPECTRUM ANALYZER 9 kHz - 26.5 GHz
- 2. Spectrum Analysis Basics CMB 12/96 2 Spectrum Analysis Basics CMB 12/96 Agenda Overview: What is spectrum analysis? What measurements do we make? Theory of Operation: Spectrum analyzer hardware Specifications: Which are important and why? Features Making the analyzer more effective Summary
- 3. Spectrum Analysis Basics CMB 12/96 3 Agenda Overview Theory of Operation Specifications Features Summary
- 4. Spectrum Analysis Basics CMB 12/96 4 Overview What is Spectrum Analysis? 8563A SPECTRUM ANALYZER 9 kHz - 26.5 GHz
- 5. Spectrum Analysis Basics CMB 12/96 5 Overview Types of Tests Made Modulation Distortion Noise
- 6. Spectrum Analysis Basics CMB 12/96 6 Overview Frequency versus Time Domain Amplitude (power) Time domain Measurements Frequency Domain Measurements
- 7. Spectrum Analysis Basics CMB 12/96 7 Overview Different Types of Analyzers Parallel filters measured simultaneously CRT shows full spectral display A f f1 f2 Fourier Analyzer
- 8. Spectrum Analysis Basics CMB 12/96 8 Overview Different Types of Analyzers A f f1 f2 Filter 'sweeps' over range of interest CRT shows full spectral display Swept Analyzer
- 9. Spectrum Analysis Basics CMB 12/96 9 Agenda Overview Theory of Operation Specifications Features Summary
- 10. Spectrum Analysis Basics CMB 12/96 10 Theory of Operation Spectrum Analyzer Block Diagram Pre-Selector Or Low Pass Filter Crystal Reference Log Amp RF input attenuator mixer IF filter detector video filter local oscillator sweep generator IF gain Input signal CRT display
- 11. Spectrum Analysis Basics CMB 12/96 11 Theory of Operation Mixer MIXER fsig LO f fsig LO f LO f fsig - LO f fsig + RF LO IF input
- 12. Spectrum Analysis Basics CMB 12/96 12 Theory of Operation IF Filter IF FILTER Display Input Spectrum IF Bandwidth (RBW)
- 13. Spectrum Analysis Basics CMB 12/96 13 Theory of Operation Detector DETECTOR Negative detection: smallest value in bin displayed Positive detection: largest value in bin displayed Sample detection: last value in bin displayed "bins" amplitude
- 14. Spectrum Analysis Basics CMB 12/96 14 Theory of Operation Video Filter VIDEO FILTER
- 15. Spectrum Analysis Basics CMB 12/96 15 Theory of Operation Other Components CRT DISPLAY SWEEP GEN LO IF GAIN frequency RF INPUT ATTENUATOR
- 16. Spectrum Analysis Basics CMB 12/96 16 Theory of Operation How it all works together 3.6 (GHz) (GHz) 0 3 6 1 2 4 5 0 3 1 2 3 6 4 5 3.6 (GHz) 0 3 1 2 f IF Signal Range LO Range f s sweep generator LO CRT display input mixer IF filter detector A f f LO f s f s f s f LO - f s f LO + f LO 3.6 6.5 6.5
- 17. Spectrum Analysis Basics CMB 12/96 17 Theory of Operation Front Panel Operation 8563A SPECTRUM ANALYZER 9 kHz - 26.5 GHz RF Input Numeric keypad Control functions (RBW, sweep time, VBW) Primary functions (Frequency, Amplitude, Span) Softkeys
- 18. Spectrum Analysis Basics CMB 12/96 18 Agenda Overview Theory of Operation Specifications Features Summary
- 19. Spectrum Analysis Basics CMB 12/96 19 Specifications 8563A SPECTRUM ANALYZER 9 kHz - 26.5 GHz Frequency Range Accuracy, Frequency & Amplitude Resolution Sensitivity Distortion Dynamic Range
- 20. Spectrum Analysis Basics CMB 12/96 20 Specifications Frequency Range Measuring harmonics 50 GHz and beyond! Low frequencies for baseband and IF
- 21. Spectrum Analysis Basics CMB 12/96 21 Specifications Accuracy Absolute Amplitude in dBm Relative Amplitude in dB Relative Frequency Frequency
- 22. Spectrum Analysis Basics CMB 12/96 22 Specifications Accuracy: Frequency Readout Accuracy Typical datasheet specification: Spans < 2 MHz: (freq. readout x freq. ref. Accuracy + 1% of frequency span + 15% of resolution bandwidth + 10 Hz "residual error")
- 23. Spectrum Analysis Basics CMB 12/96 23 Specifications Accuracy: Frequency Readout Accuracy Example Single Marker Example: 1% of 400 kHz span 15% of 3 kHz RBW 10 Hz residual error + _ 2 GHz 400 kHz span 3 kHz RBW Calculation: (2x10 Hz) x (1.3x10 /yr.ref.error) 9 - 7 = = = = 260 Hz 4000 Hz 450 Hz 10 Hz 4720 Hz Total =
- 24. Spectrum Analysis Basics CMB 12/96 24 Specifications Accuracy: Relative Amplitude Accuracy Display fidelity Frequency response RF Input attenuator Reference level Resolution bandwidth CRT scaling
- 25. Spectrum Analysis Basics CMB 12/96 25 Specifications Accuracy: Relative Amplitude Accuracy - Display Fidelity Applies when signals are not placed at the same reference amplitude Display fidelity includes –Log amplifier or linear fidelity –Detector linearity –Digitizing circuit linearity Technique for best accuracy
- 26. Spectrum Analysis Basics CMB 12/96 26 Specifications Accuracy: Relative Amplitude Accuracy - Freq. Response - 1 dB +1 dB 0 BAND 1 Specification: ± 1 dB Signals in the Same Harmonic Band
- 27. Spectrum Analysis Basics CMB 12/96 27 Specifications Accuracy: Relative Amplitude Accuracy RF Input attenuator Reference level Resolution bandwidth CRT scaling
- 28. Spectrum Analysis Basics CMB 12/96 28 Specifications Accuracy: Absolute Amplitude Accuracy Calibrator accuracy Frequency response Reference level uncertainty
- 29. Spectrum Analysis Basics CMB 12/96 29 Specifications Accuracy: Other Sources of Uncertainty Mismatch Compression due to overload Distortion products Amplitudes below the log amplifier range Signals near noise Noise causing amplitude variations Two signals incompletely resolved (RF input port not exactly 50 ohms) (high-level input signal)
- 30. Spectrum Analysis Basics CMB 12/96 30 Specifications Resolution Resolution Bandwidth Residual FM Noise Sidebands What Determines Resolution? RBW Type and Selectivity
- 31. Spectrum Analysis Basics CMB 12/96 31 Specifications Resolution: Resolution Bandwidth 3 dB 3 dB BW LO Mixer IF Filter/ Resolution Bandwidth Filter (RBW) Sweep Detector Input Spectrum Display RBW
- 32. Spectrum Analysis Basics CMB 12/96 32 Specifications Resolution: Resolution Bandwidth 3 dB 10 kHz 10 kHz RBW
- 33. Spectrum Analysis Basics CMB 12/96 33 Specifications Resolution: RBW Type and Selectivity 3 dB 60 dB 60 dB BW 60 dB BW 3 dB BW 3 dB BW Selectivity =
- 34. Spectrum Analysis Basics CMB 12/96 34 Specifications Resolution: RBW Type and Selectivity 10 kHz RBW = 10 kHz RBW = 1 kHz Selectivity 15:1 10 kHz distortion products 60 dB BW = 15 kHz 7.5 kHz 3 dB 60 dB
- 35. Spectrum Analysis Basics CMB 12/96 35 Specifications Resolution: Residual FM Residual FM "Smears" the Signal
- 36. Spectrum Analysis Basics CMB 12/96 36 Specifications Resolution: Noise Sidebands Noise Sidebands can prevent resolution of unequal signals Phase Noise
- 37. Spectrum Analysis Basics CMB 12/96 37 Specifications Resolution: RBW Determines Measurement Time Penalty For Sweeping Too Fast Is An Uncalibrated Display Swept too fast
- 38. Spectrum Analysis Basics CMB 12/96 38 Specifications Resolution: Digital Resolution Bandwidths DIGITAL FILTER ANALOG FILTER SPAN 3 kHz RES BW 100 Hz Typical Selectivity Analog 15:1 Digital 5:1
- 39. Spectrum Analysis Basics CMB 12/96 39 Specifications Sensitivity/DANL Sweep LO Mixer RF Input RES BW Filter Detector A Spectrum Analyzer Generates and Amplifies Noise Just Like Any Active Circuit
- 40. Spectrum Analysis Basics CMB 12/96 40 Specifications Sensitivity/DANL 10 dB Attenuation = 10 dB Attenuation = 20 dB signal level Effective Level of Displayed Noise is a Function of RF Input Attenuation Signal-To-Noise Ratio Decreases as RF Input Attenuation is Increased
- 41. Spectrum Analysis Basics CMB 12/96 41 Specifications Sensitivity/DANL: IF Filter (RBW) Decreased BW = Decreased Noise 100 kHz RBW 10 kHz RBW 1 kHz RBW 10 dB 10 dB Displayed Noise is a Function of IF Filter Bandwidth
- 42. Spectrum Analysis Basics CMB 12/96 42 Specifications Sensitivity/DANL: VBW Video BW Smoothes Noise for Easier Identification of Low Level Signals
- 43. Spectrum Analysis Basics CMB 12/96 43 Specifications Sensitivity/DANL Signal Equals Noise Sensitivity is the Smallest Signal That Can Be Measured 2.2 dB
- 44. Spectrum Analysis Basics CMB 12/96 44 Specifications Sensitivity/DANL Narrowest Resolution BW Minimum RF Input Attenuation Sufficient Video Filtering (Video BW < .01 Res BW) For Best Sensitivity Use:
- 45. Spectrum Analysis Basics CMB 12/96 45 Specifications Distortion Frequency Translated Signals Signal To Be Measured Resultant Mixer Generated Distortion Mixers Generate Distortion
- 46. Spectrum Analysis Basics CMB 12/96 46 Specifications Distortion Two-Toned Intermod Harmonic Distortion Most Influential Distortion is the Second and Third Order < -50 dBc < -50 dBc < -40 dBc
- 47. Spectrum Analysis Basics CMB 12/96 47 Specifications Distortion Distortion Products Increase as a Function of Fundamental's Power Second Order: 2 dB/dB of Fundamental Third Order: 3 dB/dB of Fundamental 3 f 2f 3f Power in dB 2 f f 2f - f 1 2 1 2 Power in dB 3 3 2 1 2f - f Two-Toned Intermod Harmonic Distortion Third-order distortion Second-order distortion
- 48. Spectrum Analysis Basics CMB 12/96 48 Specifications Distortion Relative Amplitude Distortion Changes with Input Power Level f 2f 3f 1 dB 3 dB 2 dB 21 dB 20 dB 1 dB
- 49. Spectrum Analysis Basics CMB 12/96 49 Specifications Distortion Distortion is a Function of Mixer Level POWER AT MIXER = INPUT - ATTENUATOR SETTING dBm DISTORTION, dBc 0 -20 -40 -60 -80 -100 -60 -30 0 +30 . TOI Second Order Third Order
- 50. Spectrum Analysis Basics CMB 12/96 50 Specifications Distortion Distortion Test: Is it Internally or Externally Generated? IF GAIN No change in amplitude = distortion is part of input signal (external) Change Input Attn by 10 dB 1 Watch Signal on Screen: 2 Change in amplitude = at least some of the distortion is being generated inside the analyzer (internal) RF INPUT ATTENUATOR
- 51. Spectrum Analysis Basics CMB 12/96 51 Specifications Dynamic Range Dynamic Range
- 52. Spectrum Analysis Basics CMB 12/96 52 Specifications Dynamic Range POWER AT MIXER = INPUT - ATTENUATOR SETTING dBm SIGNAL-TO-NOISE RATIO, dBc 0 -20 -40 -60 -80 -100 -60 -30 0 +30 . Displayed Noise in a 1 kHz RBW Displayed Noise in a 100 Hz RBW Signal-to-Noise Ratio Can Be Graphed
- 53. Spectrum Analysis Basics CMB 12/96 53 Specifications Dynamic Range Dynamic Range Can Be Presented Graphically POWER AT MIXER = INPUT - ATTENUATOR SETTING dBm SIGNAL-TO-NOISE RATIO, dBc -20 -40 -60 -80 -100 -60 -30 0 +30 . . TOI Optimum Mixer Levels Maximum 2nd Order Dynamic Range Maximum 3rd Order Dynamic Range SOI
- 54. Spectrum Analysis Basics CMB 12/96 54 Specifications Dynamic Range Where TOI = Mixer Level - dBc/2 SOI = Mixer Level - dBc Optimum Mixer Level = DANL - MDR Attenuation = Signal - Optimum Mixer Level MDR = 2/3 (DANL - TOI) 3 MDR = 1/2 (DANL - SOI) 2 Calculated Maximum Dynamic Range
- 55. Spectrum Analysis Basics CMB 12/96 55 Specifications Dynamic Range Where TOI = (-30) - (-70)/2 = + 5 dBm 3 MDR = 2/3 [(-115) - (+5)] = -80 dBc (1 kHz RBW) Example Calculation Optimum Mixer Level = (-115) - (-80) = -35 dBm Attenuation = (0) - (-35) = +35 dBm
- 56. Spectrum Analysis Basics CMB 12/96 56 Specifications Dynamic Range Noise Sidebands Dynamic Range Limited By Noise Sidebands dBc/Hz Displayed Average Noise Level Dynamic Range Compression/Noise Limited By 100 kHz to 1 MHz Dynamic Range for Spur Search Depends on Closeness to Carrier
- 57. Spectrum Analysis Basics CMB 12/96 57 Specifications Dynamic Range Actual Dynamic Range is the Minimum of: Noise sidebands at the offset frequency Maximum dynamic range calculation Calculated from: distortion sensitivity
- 58. Spectrum Analysis Basics CMB 12/96 58 Specifications Dynamic Range +30 dBm -115 dBm (1 kHz BW & 0 dB ATTENUATION) MAXIMUM POWER LEVEL CRT-DISPLAY RANGE 80 dB -10 dBm -35 dBm -45 dBm INCREASING BANDWIDTH OR ATTENUATION SECOND-ORDER DISTORTION MIXER COMPRESSION THIRD-ORDER DISTORTION SIGNAL/NOISE RANGE 105 dB RANGE 145 dB MEASUREMENT MINIMUM NOISE FLOOR 70 dB RANGE DISTORTION 80 dB RANGE DISTORTION 0 dBc NOISE SIDEBANDS 60 dBc/1kHz SIGNAL /3rd ORDER SIGNAL/ 2nd ORDER SIGNAL/NOISE SIDEBANDS
- 59. Spectrum Analysis Basics CMB 12/96 59 Agenda Overview Theory of Operation Specifications Features Summary
- 60. Spectrum Analysis Basics CMB 12/96 60 Features 8563A SPECTRUM ANALYZER 9 kHz - 26.5 GHz Basic Operation remote operation markers limit lines Noise Measurements noise marker averaging Modulation Measurements time domain FFT AM/FM detector time-gating Stimulus Response Measurements tracking generator
- 61. Spectrum Analysis Basics CMB 12/96 61 Features Basic Operation: Remote Operation, Markers & Limit Lines 8563A SPECTRUM ANALYZER 9 kHz - 26.5 GHz MARKER 1.025 MHz -54.04 dB
- 62. Spectrum Analysis Basics CMB 12/96 62 Features Modulation Measurements: Time Domain LIN MARKER 10 msec 1.000 X CENTER 100 MHz SPAN 0 Hz RES BW 1 MHz VBW 3 MHz SWP 50 msec
- 63. Spectrum Analysis Basics CMB 12/96 63 Features Modulation Measurements: FFT LIN CENTER 100 MHz SPAN 0 Hz MARKER 1 kHz -26 dBc 10 dB/ CENTER 100 MHz SPAN 10 kHz MARKER 1 kHz -26 dBc Swept Frequency Domain FFT Frequency Domain
- 64. Spectrum Analysis Basics CMB 12/96 64 Features Modulation Measurements: FFT SPAN 50 kHz CENTER 100 MHz
- 65. Spectrum Analysis Basics CMB 12/96 65 Features Modulation Measurements: AM/FM Detector with Speakers 8563A SPECTRUM ANALYZER 9 kHz - 26.5 GHz
- 66. Spectrum Analysis Basics CMB 12/96 66 Features Modulation Measurements: Time-Gating 1 2 3 4 5 0 1 3 4 5 6 0 1 2 Time Frequency Amplitude Timeslot Channel Number Time Division Multiple Access (TDMA) user #1
- 67. Spectrum Analysis Basics CMB 12/96 67 Features Modulation Measurements: Time-Gating Envelope Detector Video Filter GATE Time-Gated Measurements in the Frequency Domain Frequency time "time gating" gate delay gate length
- 68. Spectrum Analysis Basics CMB 12/96 68 Features Noise Measurements: Noise Marker & Video Averaging 8563A SPECTRUM ANALYZER 9 kHz - 26.5 GHz 1.025 MHz MKR -135.75 dBm/Hz AVG 10
- 69. Spectrum Analysis Basics CMB 12/96 69 Features Stimulus Response: Tracking Generator DUT Source Receiver IF LO CRT Display Tracking Generator Tracking RF in Spectrum Analyzer TG out Adjust DUT
- 70. Spectrum Analysis Basics CMB 12/96 70 Agenda Overview Theory of Operation Specifications Features Summary