Download as PDF, PPTX

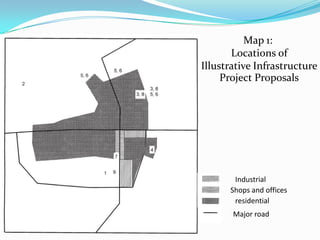


The document outlines a project proposal aimed at urban development, emphasizing infrastructure needs like new industrial areas, water treatment facilities, and schools in response to population growth and economic changes. It details methods to analyze urban trends, physical conditions for development, and the needs of local residents while identifying opportunities and constraints for growth. Additionally, it discusses the importance of collaboration with local organizations and authorities in planning future urban expansions and addressing social and economic policies.