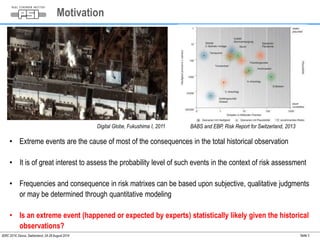
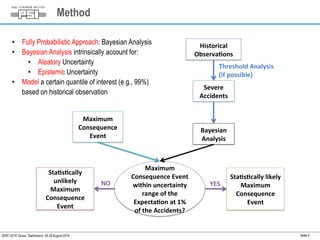
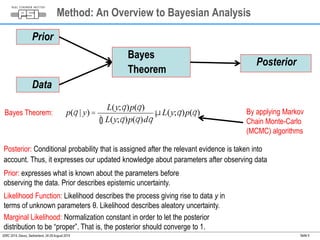
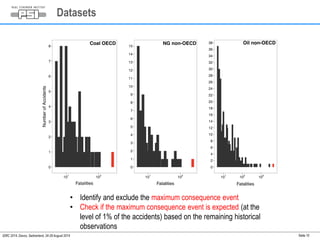
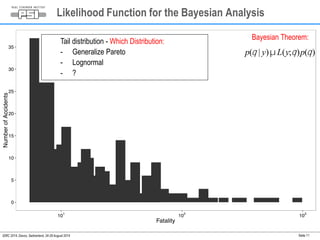
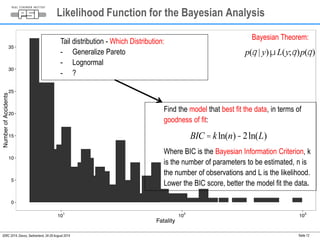
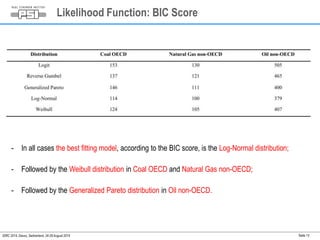
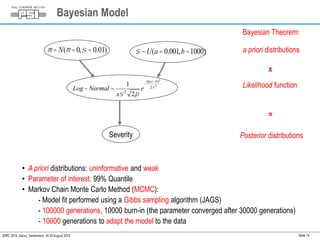
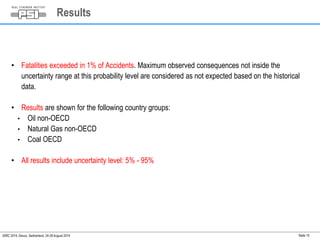
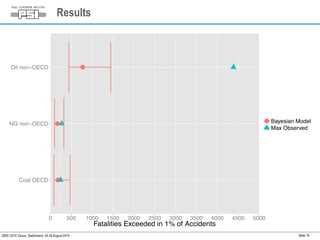
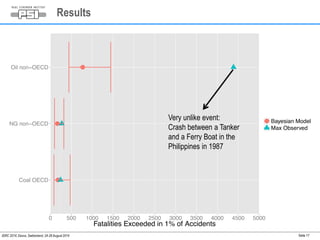
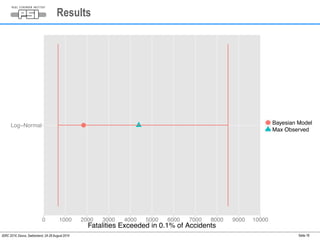
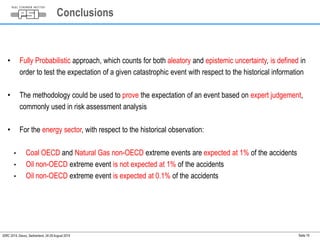
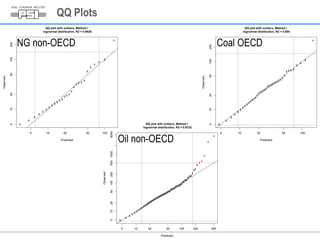
Wir schaffen Wissen – heute für morgen 
Paul Scherrer Institut 
Matteo Spada and Peter Burgherr 
Towards Extreme Consequence Accidents in Energy 
Sector: Are they expected based on historical 
observations? 
IDRC 2014, Davos, Switzerland, 24-28 August 2014
• Motivation 
• Method 
• Application to the Energy Sector: 
• ENSAD database 
• Likelihood Function 
• Bayesian Model 
• Results 
• Conclusions 
Outline 
IDRC 2014, Davos, Switzerland, 24-28 August 2014 Seite 2
Motivation 
Digital Globe, Fukushima I, 2011 BABS and EBP, Risk Report for Switzerland, 2013 
• Extreme events are the cause of most of the consequences in the total historical observation 
• It is of great interest to assess the probability level of such events in the context of risk assessment 
• Frequencies and consequence in risk matrixes can be based upon subjective, qualitative judgments 
or may be determined through quantitative modeling 
• Is an extreme event (happened or expected by experts) statistically likely given the historical 
observations? 
IDRC 2014, Davos, Switzerland, 24-28 August 2014 Seite 3
Method 
Historical	 
Observa ons	 
Threshold	Analysis		 
(if	possible)	 
Severe	 
Accidents	 
Bayesian	 
Analysis	 
• Fully Probabilistic Approach: Bayesian Analysis 
• Bayesian Analysis intrinsically account for: 
• Aleatory Uncertainty 
• Epistemic Uncertainty 
• Model a certain quantile of interest (e.g., 99%) 
based on historical observation 
Maximum		 
Consequence	 
Event	 
Maximum	 
Consequence	Event	 
within	uncertainty	 
NO	 YES	 
range	of	the	 
Expecta on	at	1%	 
of	the	Accidents?	 
Sta s cally	likely	 
Maximum	 
Consequence	 
Event	 
Sta s cally	 
unlikely	 
Maximum	 
Consequence	 
Event	 
IDRC 2014, Davos, Switzerland, 24-28 August 2014 Seite 4
μL(y;q )p(q ) By applying Markov 
Chain Monte-Carlo 
(MCMC) algorithms 
Seite 5 
Method: An Overview to Bayesian Analysis 
Prior 
Bayes 
Theorem 
Posterior 
Data 
Bayes Theorem: 
p(q | y) = 
L(y;q )p(q ) 
ò L(y;q )p(q )dq 
Posterior: Conditional probability that is assigned after the relevant evidence is taken into 
account. Thus, it expresses our updated knowledge about parameters after observing data 
Prior: expresses what is known about the parameters before 
observing the data. Prior describes epistemic uncertainty. 
Likelihood Function: Likelihood describes the process giving rise to data y in 
terms of unknown parameters θ. Likelihood describes aleatory uncertainty. 
Marginal Likelihood: Normalization constant in order to let the posterior 
distribution to be “proper”. That is, the posterior should converge to 1. 
IDRC 2014, Davos, Switzerland, 24-28 August 2014
Coal mine explosion Deepwater Horizon (US) 
LNG facility (Algeria) 
Gas Refinery pipeline Tapped oil pipeline (Nigeria) 
Seite 6 
Test the Method: Accidents in the Energy Sector 
IDRC 2014, Davos, Switzerland, 24-28 August 2014
ENSAD database 
Seite 7 
ENergy related Severe Accident Database (ENSAD) 
- Comprehensive, worldwide coverage of energy-related severe accidents, 1970-2008 covered 
- Covers entire energy chains (the risk to society and environment occur not only during the actual 
energy generation) 
- Updated from a variety of sources 
Coal (incl. Lignite) 
Exploration 
Mining & Preparation 
Transport 
Conversion 
Transport 
Power/Heating Plant 
Waste Treatment & Disposal 
Natural Gas 
Exploration 
Extraction & Processing 
Transport 
Power/Heating Plant 
Oil 
Exploration 
Extraction 
Transport 
Refining 
Transport 
Power/Heating Plant 
Waste Treatment & Disposal 
IDRC 2014, Davos, Switzerland, 24-28 August 2014
ENSAD database 
Seite 8 
ENergy related Severe Accident Database (ENSAD) 
- Comprehensive, worldwide coverage of energy-related severe accidents, 1970-2008 covered 
- Covers entire energy chains (the risk to society and environment occur not only during the actual 
energy generation) 
- Updated from a variety of sources 
- ENSAD definition of severe accidents: ≥5 fatalities, ≥10 injured, ≥5 Mio $, etc. 
Risk description Impact Category ENSAD severity threshold Consequence indicator 
Human health Fatalities 
Injuries 
≥ 5 
≥ 10 
Fatalities per GWeyr 
Injured per GWeyr 
Societal Evacuees 
Food consumption ban 
≥ 200 
yes 
Evacuees per GWeyr 
Nominal scale 
Environmental Release of hydrocarbons 
Land/water contamination 
≥ 10’000 t 
≥ 25 km2 
Ton per GWeyr 
km2 per GWeyr 
Economic Economic loss ≥ 5 Mio USD (2000) USD per GWeyr 
IDRC 2014, Davos, Switzerland, 24-28 August 2014
Datasets 
IDRC 2014, Davos, Switzerland, 24-28 August 2014 Seite 9
Datasets 
Seite 10 
• Identify and exclude the maximum consequence event 
• Check if the maximum consequence event is expected (at the 
level of 1% of the accidents) based on the remaining historical 
observations 
IDRC 2014, Davos, Switzerland, 24-28 August 2014
Likelihood Function for the Bayesian Analysis 
Bayesian Theorem: 
Seite 11 
Tail distribution - Which Distribution: 
- Generalize Pareto 
- Lognormal 
- ? 
IDRC 2014, Davos, Switzerland, 24-28 August 2014 
p(q | y)μL(y;q )p(q )
Likelihood Function for the Bayesian Analysis 
Bayesian Theorem: 
Find the model that best fit the data, in terms of 
goodness of fit: 
Where BIC is the Bayesian Information Criterion, k 
is the number of parameters to be estimated, n is 
the number of observations and L is the likelihood. 
Lower the BIC score, better the model fit the data. 
Seite 12 
Tail distribution - Which Distribution: 
- Generalize Pareto 
- Lognormal 
- ? 
BIC = k ln(n)-2ln(L) 
IDRC 2014, Davos, Switzerland, 24-28 August 2014 
p(q | y)μL(y;q )p(q )
Seite 13 
Likelihood Function: BIC Score 
- In all cases the best fitting model, according to the BIC score, is the Log-Normal distribution; 
- Followed by the Weibull distribution in Coal OECD and Natural Gas non-OECD; 
- Followed by the Generalized Pareto distribution in Oil non-OECD. 
IDRC 2014, Davos, Switzerland, 24-28 August 2014
Bayesian Model 
Bayesian Theorem: 
Seite 14 
m = N(m = 0,s = 0.01) s ~U(a = 0.001,b =1000) 
Log - Normal = 
1 
xs 2 2p 
Severity 
e 
- 
(ln x-m )2 
2s 2 
• A priori distributions: uninformative and weak 
• Parameter of interest: 99% Quantile 
• Markov Chain Monte Carlo Method (MCMC): 
x 
= 
- Model fit performed using a Gibbs sampling algorithm (JAGS) 
- 100000 generations, 10000 burn-in (the parameter converged after 30000 generations) 
- 10000 generations to adapt the model to the data 
IDRC 2014, Davos, Switzerland, 24-28 August 2014 
a priori distributions 
Likelihood function 
Posterior distributions
Results 
Seite 15 
• Fatalities exceeded in 1% of Accidents. Maximum observed consequences not inside the 
uncertainty range at this probability level are considered as not expected based on the historical 
data. 
• Results are shown for the following country groups: 
• Oil non-OECD 
• Natural Gas non-OECD 
• Coal OECD 
• All results include uncertainty level: 5% - 95% 
IDRC 2014, Davos, Switzerland, 24-28 August 2014
Results 
IDRC 2014, Davos, Switzerland, 24-28 August 2014 Seite 16
Results 
Very unlike event: 
Crash between a Tanker 
and a Ferry Boat in the 
Philippines in 1987 
IDRC 2014, Davos, Switzerland, 24-28 August 2014 Seite 17
Results 
IDRC 2014, Davos, Switzerland, 24-28 August 2014 Seite 18
Conclusions 
• Fully Probabilistic approach, which counts for both aleatory and epistemic uncertainty, is defined in 
order to test the expectation of a given catastrophic event with respect to the historical information 
• The methodology could be used to prove the expectation of an event based on expert judgement, 
commonly used in risk assessment analysis 
• For the energy sector, with respect to the historical observation: 
• Coal OECD and Natural Gas non-OECD extreme events are expected at 1% of the accidents 
• Oil non-OECD extreme event is not expected at 1% of the accidents 
• Oil non-OECD extreme event is expected at 0.1% of the accidents 
IDRC 2014, Davos, Switzerland, 24-28 August 2014 Seite 19
Thank You! Questions? 
matteo.spada@psi.ch 
www.psi.ch/ta/mspada 
IDRC 2014, Davos, Switzerland, 24-28 August 2014 Seite 20
Seite 21 
Backup Slides
QQ Plots 
5 10 20 50 100 
5 10 20 50 100 200 
QQ plot with outliers, Method I 
lognormal distribution, R2 = 0.9526 
Predicted 
Observed 
NG non-OECD 
5 10 20 50 100 
5 10 20 50 100 200 
QQ plot with outliers, Method I 
lognormal distribution, R2 = 0.984 
Predicted 
Observed 
Coal OECD 
5 10 20 50 100 200 500 
5 10 20 50 100 200 500 1000 5000 
QQ plot with outliers, Method I 
lognormal distribution, R2 = 0.9722 
Predicted 
Observed 
Oil non-OECD
Marginal Likelihood: MCMC with Gibbs Sampler 
• The Gibbs sampler is a generic method to sample from a high dimensional distribution. 
• Consider two parameters of interest: θ1 and θ2 
• Target: p(θ1, θ2 | y) 
• Suppose we can sample from p(θ1 | θ2,y) and p(θ2 |θ1,y). 
• Starting at the point (θ1(0) , θ2(0)) in parameter space, generate a random walk, a sequence (θ1(k), 
θ2(k)) as follows: 
For k=1,...,n, define θ1(k) ~p(θ1 | θ2(k-1),y), θ2(k) ~ p (θ2 | θ1( k ) , y ) 
• The values at the (k+1)th step depend only on the values at the k-th step and are independent of 
previous values. 
• The Markov chain will in general tend to a stationary distribution, and the stationary distribution will be 
the desired p(θ1, θ2 | y)
Convergence – 1 - Autocorrelation 
NG non-OECD Coal OECD 
Oil non-OECD
Convergence – 2 
NG non-OECD Coal OECD 
Oil non-OECD

Spada_IDRC_Presentation

  • 1.
    Wir schaffen Wissen– heute für morgen Paul Scherrer Institut Matteo Spada and Peter Burgherr Towards Extreme Consequence Accidents in Energy Sector: Are they expected based on historical observations? IDRC 2014, Davos, Switzerland, 24-28 August 2014
  • 2.
    • Motivation •Method • Application to the Energy Sector: • ENSAD database • Likelihood Function • Bayesian Model • Results • Conclusions Outline IDRC 2014, Davos, Switzerland, 24-28 August 2014 Seite 2
  • 3.
    Motivation Digital Globe,Fukushima I, 2011 BABS and EBP, Risk Report for Switzerland, 2013 • Extreme events are the cause of most of the consequences in the total historical observation • It is of great interest to assess the probability level of such events in the context of risk assessment • Frequencies and consequence in risk matrixes can be based upon subjective, qualitative judgments or may be determined through quantitative modeling • Is an extreme event (happened or expected by experts) statistically likely given the historical observations? IDRC 2014, Davos, Switzerland, 24-28 August 2014 Seite 3
  • 4.
    Method Historical Observaons Threshold Analysis (if possible) Severe Accidents Bayesian Analysis • Fully Probabilistic Approach: Bayesian Analysis • Bayesian Analysis intrinsically account for: • Aleatory Uncertainty • Epistemic Uncertainty • Model a certain quantile of interest (e.g., 99%) based on historical observation Maximum Consequence Event Maximum Consequence Event within uncertainty NO YES range of the Expecta on at 1% of the Accidents? Sta s cally likely Maximum Consequence Event Sta s cally unlikely Maximum Consequence Event IDRC 2014, Davos, Switzerland, 24-28 August 2014 Seite 4
  • 5.
    μL(y;q )p(q )By applying Markov Chain Monte-Carlo (MCMC) algorithms Seite 5 Method: An Overview to Bayesian Analysis Prior Bayes Theorem Posterior Data Bayes Theorem: p(q | y) = L(y;q )p(q ) ò L(y;q )p(q )dq Posterior: Conditional probability that is assigned after the relevant evidence is taken into account. Thus, it expresses our updated knowledge about parameters after observing data Prior: expresses what is known about the parameters before observing the data. Prior describes epistemic uncertainty. Likelihood Function: Likelihood describes the process giving rise to data y in terms of unknown parameters θ. Likelihood describes aleatory uncertainty. Marginal Likelihood: Normalization constant in order to let the posterior distribution to be “proper”. That is, the posterior should converge to 1. IDRC 2014, Davos, Switzerland, 24-28 August 2014
  • 6.
    Coal mine explosionDeepwater Horizon (US) LNG facility (Algeria) Gas Refinery pipeline Tapped oil pipeline (Nigeria) Seite 6 Test the Method: Accidents in the Energy Sector IDRC 2014, Davos, Switzerland, 24-28 August 2014
  • 7.
    ENSAD database Seite7 ENergy related Severe Accident Database (ENSAD) - Comprehensive, worldwide coverage of energy-related severe accidents, 1970-2008 covered - Covers entire energy chains (the risk to society and environment occur not only during the actual energy generation) - Updated from a variety of sources Coal (incl. Lignite) Exploration Mining & Preparation Transport Conversion Transport Power/Heating Plant Waste Treatment & Disposal Natural Gas Exploration Extraction & Processing Transport Power/Heating Plant Oil Exploration Extraction Transport Refining Transport Power/Heating Plant Waste Treatment & Disposal IDRC 2014, Davos, Switzerland, 24-28 August 2014
  • 8.
    ENSAD database Seite8 ENergy related Severe Accident Database (ENSAD) - Comprehensive, worldwide coverage of energy-related severe accidents, 1970-2008 covered - Covers entire energy chains (the risk to society and environment occur not only during the actual energy generation) - Updated from a variety of sources - ENSAD definition of severe accidents: ≥5 fatalities, ≥10 injured, ≥5 Mio $, etc. Risk description Impact Category ENSAD severity threshold Consequence indicator Human health Fatalities Injuries ≥ 5 ≥ 10 Fatalities per GWeyr Injured per GWeyr Societal Evacuees Food consumption ban ≥ 200 yes Evacuees per GWeyr Nominal scale Environmental Release of hydrocarbons Land/water contamination ≥ 10’000 t ≥ 25 km2 Ton per GWeyr km2 per GWeyr Economic Economic loss ≥ 5 Mio USD (2000) USD per GWeyr IDRC 2014, Davos, Switzerland, 24-28 August 2014
  • 9.
    Datasets IDRC 2014,Davos, Switzerland, 24-28 August 2014 Seite 9
  • 10.
    Datasets Seite 10 • Identify and exclude the maximum consequence event • Check if the maximum consequence event is expected (at the level of 1% of the accidents) based on the remaining historical observations IDRC 2014, Davos, Switzerland, 24-28 August 2014
  • 11.
    Likelihood Function forthe Bayesian Analysis Bayesian Theorem: Seite 11 Tail distribution - Which Distribution: - Generalize Pareto - Lognormal - ? IDRC 2014, Davos, Switzerland, 24-28 August 2014 p(q | y)μL(y;q )p(q )
  • 12.
    Likelihood Function forthe Bayesian Analysis Bayesian Theorem: Find the model that best fit the data, in terms of goodness of fit: Where BIC is the Bayesian Information Criterion, k is the number of parameters to be estimated, n is the number of observations and L is the likelihood. Lower the BIC score, better the model fit the data. Seite 12 Tail distribution - Which Distribution: - Generalize Pareto - Lognormal - ? BIC = k ln(n)-2ln(L) IDRC 2014, Davos, Switzerland, 24-28 August 2014 p(q | y)μL(y;q )p(q )
  • 13.
    Seite 13 LikelihoodFunction: BIC Score - In all cases the best fitting model, according to the BIC score, is the Log-Normal distribution; - Followed by the Weibull distribution in Coal OECD and Natural Gas non-OECD; - Followed by the Generalized Pareto distribution in Oil non-OECD. IDRC 2014, Davos, Switzerland, 24-28 August 2014
  • 14.
    Bayesian Model BayesianTheorem: Seite 14 m = N(m = 0,s = 0.01) s ~U(a = 0.001,b =1000) Log - Normal = 1 xs 2 2p Severity e - (ln x-m )2 2s 2 • A priori distributions: uninformative and weak • Parameter of interest: 99% Quantile • Markov Chain Monte Carlo Method (MCMC): x = - Model fit performed using a Gibbs sampling algorithm (JAGS) - 100000 generations, 10000 burn-in (the parameter converged after 30000 generations) - 10000 generations to adapt the model to the data IDRC 2014, Davos, Switzerland, 24-28 August 2014 a priori distributions Likelihood function Posterior distributions
  • 15.
    Results Seite 15 • Fatalities exceeded in 1% of Accidents. Maximum observed consequences not inside the uncertainty range at this probability level are considered as not expected based on the historical data. • Results are shown for the following country groups: • Oil non-OECD • Natural Gas non-OECD • Coal OECD • All results include uncertainty level: 5% - 95% IDRC 2014, Davos, Switzerland, 24-28 August 2014
  • 16.
    Results IDRC 2014,Davos, Switzerland, 24-28 August 2014 Seite 16
  • 17.
    Results Very unlikeevent: Crash between a Tanker and a Ferry Boat in the Philippines in 1987 IDRC 2014, Davos, Switzerland, 24-28 August 2014 Seite 17
  • 18.
    Results IDRC 2014,Davos, Switzerland, 24-28 August 2014 Seite 18
  • 19.
    Conclusions • FullyProbabilistic approach, which counts for both aleatory and epistemic uncertainty, is defined in order to test the expectation of a given catastrophic event with respect to the historical information • The methodology could be used to prove the expectation of an event based on expert judgement, commonly used in risk assessment analysis • For the energy sector, with respect to the historical observation: • Coal OECD and Natural Gas non-OECD extreme events are expected at 1% of the accidents • Oil non-OECD extreme event is not expected at 1% of the accidents • Oil non-OECD extreme event is expected at 0.1% of the accidents IDRC 2014, Davos, Switzerland, 24-28 August 2014 Seite 19
  • 20.
    Thank You! Questions? matteo.spada@psi.ch www.psi.ch/ta/mspada IDRC 2014, Davos, Switzerland, 24-28 August 2014 Seite 20
  • 21.
  • 22.
    QQ Plots 510 20 50 100 5 10 20 50 100 200 QQ plot with outliers, Method I lognormal distribution, R2 = 0.9526 Predicted Observed NG non-OECD 5 10 20 50 100 5 10 20 50 100 200 QQ plot with outliers, Method I lognormal distribution, R2 = 0.984 Predicted Observed Coal OECD 5 10 20 50 100 200 500 5 10 20 50 100 200 500 1000 5000 QQ plot with outliers, Method I lognormal distribution, R2 = 0.9722 Predicted Observed Oil non-OECD
  • 23.
    Marginal Likelihood: MCMCwith Gibbs Sampler • The Gibbs sampler is a generic method to sample from a high dimensional distribution. • Consider two parameters of interest: θ1 and θ2 • Target: p(θ1, θ2 | y) • Suppose we can sample from p(θ1 | θ2,y) and p(θ2 |θ1,y). • Starting at the point (θ1(0) , θ2(0)) in parameter space, generate a random walk, a sequence (θ1(k), θ2(k)) as follows: For k=1,...,n, define θ1(k) ~p(θ1 | θ2(k-1),y), θ2(k) ~ p (θ2 | θ1( k ) , y ) • The values at the (k+1)th step depend only on the values at the k-th step and are independent of previous values. • The Markov chain will in general tend to a stationary distribution, and the stationary distribution will be the desired p(θ1, θ2 | y)
  • 24.
    Convergence – 1- Autocorrelation NG non-OECD Coal OECD Oil non-OECD
  • 25.
    Convergence – 2 NG non-OECD Coal OECD Oil non-OECD

Editor's Notes

  • #24 Conditional probability where ‘~’ means here that we draw the value in question from the indicated distribution.