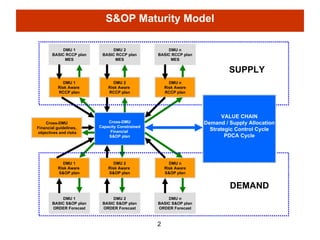
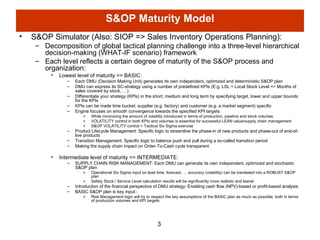
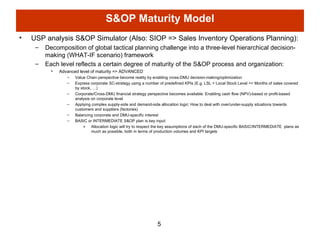
S&OP Maturity Model:  Making Integrated SCM a reality. Concepts and Principles
S&OP Maturity Model DMU 1 BASIC S&OP plan ORDER Forecast DMU 2 BASIC S&OP plan ORDER Forecast DMU n BASIC S&OP plan ORDER Forecast DMU 1 Risk Aware  S&OP plan DMU 2 Risk Aware  S&OP plan DMU n Risk Aware S&OP plan Cross-DMU Capacity Constrained Financial  S&OP plan DMU 1 Risk Aware  RCCP plan DMU 2 Risk Aware  RCCP plan DMU n Risk Aware RCCP plan DMU 1 BASIC RCCP plan MES DMU 2 BASIC RCCP plan MES DMU n BASIC RCCP plan MES Cross-DMU Financial guidelines, objectives and risks SUPPLY DEMAND VALUE CHAIN Demand / Supply Allocation Strategic Control Cycle PDCA Cycle
S&OP Maturity Model S&OP Simulator (Also: SIOP => Sales Inventory Operations Planning): Decomposition of global tactical planning challenge into a three-level hierarchical decision-making (WHAT-IF scenario) framework Each level reflects a certain degree of maturity of the S&OP process and organization: Lowest level of maturity => BASIC: Each DMU (Decision Making Unit) generates its own independent, optimized and deterministic S&OP plan DMU can express its SC-strategy using a number of predefined KPIs (E.g. LSL = Local Stock Level => Months of sales covered by stock, …) Differentiate your strategy (KPIs) in the short, medium and long term by specifying target, lower and upper bounds for the KPIs KPIs can be made time bucket, supplier (e.g. factory) and customer (e.g. a market segment) specific Engine focuses on smooth convergence towards the specified KPI targets While minimizing the amount of volatility introduced in terms of production, pipeline and stock volumes VOLATILITY control in both KPIs and volumes is essential for successful LEAN value/supply chain management S&OP VOLATILITY control = Tactical Six Sigma exercise Product Lifecycle Management: Specific logic to streamline the phase-in of new products and phase-out of end-of-live products Transition Management: Specific logic to balance push and pull during a so-called transition period Making the supply chain impact on Order-To-Cash cycle transparent  Intermediate level of maturity => INTERMEDIATE: SUPPLY CHAIN RISK MANAGEMENT: Each DMU can generate its own independent, optimized and stochastic S&OP plan Operational Six Sigma input on lead time, forecast, … accuracy (volatility) can be translated into a ROBUST S&OP plan Safety Stock / Service Level calculation results will be significantly more realistic and leaner Introduction of the financial perspective of DMU strategy: Enabling cash flow (NPV)-based or profit-based analysis BASIC S&OP plan is key input:: Risk Management logic will try to respect the key assumptions of the BASIC plan as much as possible, both in terms of production volumes and KPI targets
S&OP Maturity Model Focus of BASIC S&OP:  T Historical_ Production_ Month Planning_Month LSL Target Pattern Historical LSL LSL = Local Stock Level Time  Independent  LSL Boundaries T Historical_Production_Month Planning_Month LSL Target Pattern Transition Period (Lead Time Dependent) Historical LSL Time  Dependent  LSL Boundaries S&OP Simulator Finding a balance between: LSL and volume  (production, flow and stock) volatility LSL target convergence PRODUCTION Pattern: Tight bounds on LSL may cause  significant  volatility  in terms of production  during the transition period  LSL Pattern LSL Pattern: Loose bounds on LSL may cause  structural over/under-supply  during significant part of forecast scope PRODUCTION Pattern
S&OP Maturity Model USP analysis S&OP Simulator (Also: SIOP => Sales Inventory Operations Planning): Decomposition of global tactical planning challenge into a three-level hierarchical decision-making (WHAT-IF scenario) framework Each level reflects a certain degree of maturity of the S&OP process and organization: Advanced level of maturity => ADVANCED Value Chain perspective become reality by enabling cross-DMU decision-making/optimization Express corporate SC-strategy using a number of predefined KPIs (E.g. LSL = Local Stock Level => Months of sales covered by stock, …) Corporate/Cross-DMU financial strategy perspective becomes available: Enabling cash flow (NPV)-based or profit-based analysis on corporate level  Applying complex supply-side and demand-side allocation logic: How to deal with over/under-supply situations towards customers and suppliers (factories) Balancing corporate and DMU-specific interest BASIC or INTERMEDIATE S&OP plan is key input: Allocation logic will try to respect the key assumptions of each of the DMU-specific BASIC/INTERMEDIATE  plans as much as possible, both in terms of production volumes and KPI targets

S&op maturity model

  • 1.
    S&OP Maturity Model: Making Integrated SCM a reality. Concepts and Principles
  • 2.
    S&OP Maturity ModelDMU 1 BASIC S&OP plan ORDER Forecast DMU 2 BASIC S&OP plan ORDER Forecast DMU n BASIC S&OP plan ORDER Forecast DMU 1 Risk Aware S&OP plan DMU 2 Risk Aware S&OP plan DMU n Risk Aware S&OP plan Cross-DMU Capacity Constrained Financial S&OP plan DMU 1 Risk Aware RCCP plan DMU 2 Risk Aware RCCP plan DMU n Risk Aware RCCP plan DMU 1 BASIC RCCP plan MES DMU 2 BASIC RCCP plan MES DMU n BASIC RCCP plan MES Cross-DMU Financial guidelines, objectives and risks SUPPLY DEMAND VALUE CHAIN Demand / Supply Allocation Strategic Control Cycle PDCA Cycle
  • 3.
    S&OP Maturity ModelS&OP Simulator (Also: SIOP => Sales Inventory Operations Planning): Decomposition of global tactical planning challenge into a three-level hierarchical decision-making (WHAT-IF scenario) framework Each level reflects a certain degree of maturity of the S&OP process and organization: Lowest level of maturity => BASIC: Each DMU (Decision Making Unit) generates its own independent, optimized and deterministic S&OP plan DMU can express its SC-strategy using a number of predefined KPIs (E.g. LSL = Local Stock Level => Months of sales covered by stock, …) Differentiate your strategy (KPIs) in the short, medium and long term by specifying target, lower and upper bounds for the KPIs KPIs can be made time bucket, supplier (e.g. factory) and customer (e.g. a market segment) specific Engine focuses on smooth convergence towards the specified KPI targets While minimizing the amount of volatility introduced in terms of production, pipeline and stock volumes VOLATILITY control in both KPIs and volumes is essential for successful LEAN value/supply chain management S&OP VOLATILITY control = Tactical Six Sigma exercise Product Lifecycle Management: Specific logic to streamline the phase-in of new products and phase-out of end-of-live products Transition Management: Specific logic to balance push and pull during a so-called transition period Making the supply chain impact on Order-To-Cash cycle transparent Intermediate level of maturity => INTERMEDIATE: SUPPLY CHAIN RISK MANAGEMENT: Each DMU can generate its own independent, optimized and stochastic S&OP plan Operational Six Sigma input on lead time, forecast, … accuracy (volatility) can be translated into a ROBUST S&OP plan Safety Stock / Service Level calculation results will be significantly more realistic and leaner Introduction of the financial perspective of DMU strategy: Enabling cash flow (NPV)-based or profit-based analysis BASIC S&OP plan is key input:: Risk Management logic will try to respect the key assumptions of the BASIC plan as much as possible, both in terms of production volumes and KPI targets
  • 4.
    S&OP Maturity ModelFocus of BASIC S&OP: T Historical_ Production_ Month Planning_Month LSL Target Pattern Historical LSL LSL = Local Stock Level Time Independent LSL Boundaries T Historical_Production_Month Planning_Month LSL Target Pattern Transition Period (Lead Time Dependent) Historical LSL Time Dependent LSL Boundaries S&OP Simulator Finding a balance between: LSL and volume (production, flow and stock) volatility LSL target convergence PRODUCTION Pattern: Tight bounds on LSL may cause significant volatility in terms of production during the transition period LSL Pattern LSL Pattern: Loose bounds on LSL may cause structural over/under-supply during significant part of forecast scope PRODUCTION Pattern
  • 5.
    S&OP Maturity ModelUSP analysis S&OP Simulator (Also: SIOP => Sales Inventory Operations Planning): Decomposition of global tactical planning challenge into a three-level hierarchical decision-making (WHAT-IF scenario) framework Each level reflects a certain degree of maturity of the S&OP process and organization: Advanced level of maturity => ADVANCED Value Chain perspective become reality by enabling cross-DMU decision-making/optimization Express corporate SC-strategy using a number of predefined KPIs (E.g. LSL = Local Stock Level => Months of sales covered by stock, …) Corporate/Cross-DMU financial strategy perspective becomes available: Enabling cash flow (NPV)-based or profit-based analysis on corporate level Applying complex supply-side and demand-side allocation logic: How to deal with over/under-supply situations towards customers and suppliers (factories) Balancing corporate and DMU-specific interest BASIC or INTERMEDIATE S&OP plan is key input: Allocation logic will try to respect the key assumptions of each of the DMU-specific BASIC/INTERMEDIATE plans as much as possible, both in terms of production volumes and KPI targets