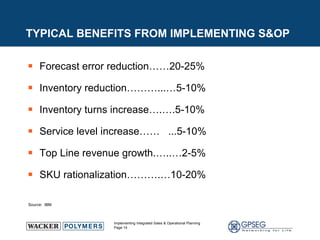
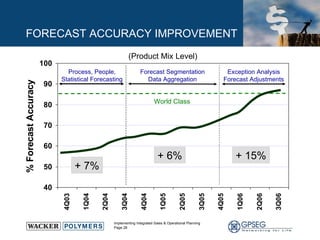
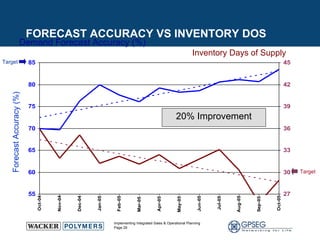
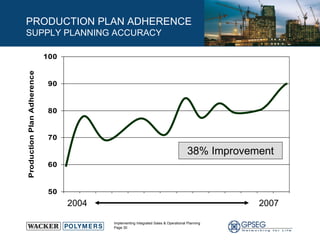
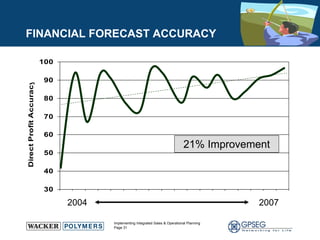
This document discusses the benefits of implementing an integrated sales and operations planning (S&OP) process. It provides a case study of a chemical company that improved forecast accuracy from 20% to 38%, reduced inventory days of supply, and increased production plan adherence and financial forecast accuracy through S&OP. Regular S&OP meetings aligned business, finance, and supply chain plans, resulting in improved visibility, service levels, and financial performance.


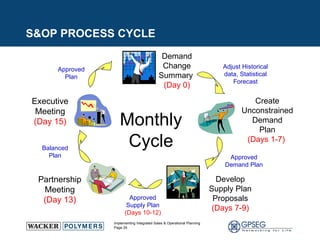
![S&OP PROCESS STEPS P1.1A – Identify, Prioritize, & Aggregate SC Requirements DAY 0 - 8 P1.4 – Establish & Communicate SC Plans DAY 13-15 P1.3A – Balance Supply Chain Requirements with SC Resources DAY 9 – 12 P1.2A – Identify, Prioritize, & Aggregate SC Resources DAY 0 - 8 Review Historical Sales Data Review Demand Metrics Apply Historical Sales Data Adjustments Apply Future Demand Change Notifications Run Forecast Model Agree & Communicate Approved Plans Communicate Implications to Financial & Sales Plans Review Supply Plan & Cost Projections Develop/Modify Supply Chain Plans Review Supply Planning Measures Adjust Supply Planning Constraints Load & Review Unconstrained Demand Plan Submit Supply Plan with Documented Options Approve & Publish Supply Plan Approve & Publish Unconstrained Demand Plan Gather Data [DAY0] Gather Data [DAY 0] Define Supply Capability [DAY 1 – 8] Develop Supply Plan Proposals [DAY 9] Finalize & Approve Supply Plan [DAY 10 -12] Aggregate All Sources of Supply Initiate Req Master Data Changes Review Inventory Available Review Supply Capability Create Demand Change Summary B A Partnership Meeting [DAY 13] Executive S&OP [DAY 15] Summarize Supply Chain Plans Gather Collaborative Input (Future Function) Create Unconstrained Demand Plan [DAY 1 -8] Develop Unconstrained Revenue Projection Apply New Characteristic Combos Adjust Statistical Parameters (if needed) Review and Validate Unconstrained Forecast Input Source, Make, Deliver Product & Capacity Plans Create Supply Change Summary Develop Supply Plan Proposal (Optimization) Review Alerts Assess Impact & Develop Options Review Excess Capacity, Supply Options, Demand Exceptions Issue Resolution Agree to Supply Plan Initiate any Master Data MOC Review Supply Chain Plans Review Revenue Projections A B C C BI](https://image.slidesharecdn.com/executivesopcasestudygpseg-090824140443-phpapp02/85/Executive-S-Op-Case-Study-Gpseg-23-320.jpg)
![The WACKER Group THANK YOU FOR YOUR ATTENTION Stephen P. Crane Director Strategic Supply Chain Management [email_address] CREATING TOMORROW'S SOLUTIONS](https://image.slidesharecdn.com/executivesopcasestudygpseg-090824140443-phpapp02/85/Executive-S-Op-Case-Study-Gpseg-39-320.jpg)


