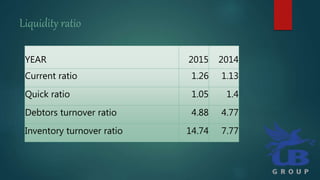
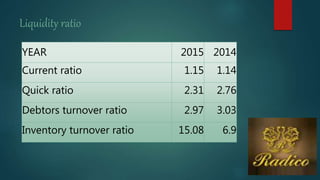
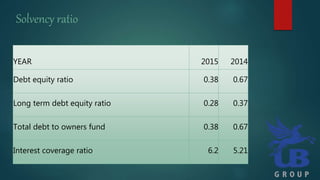
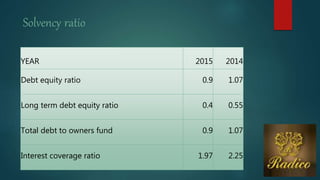
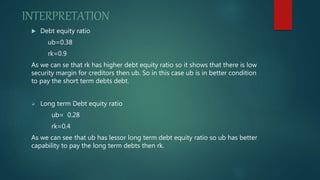
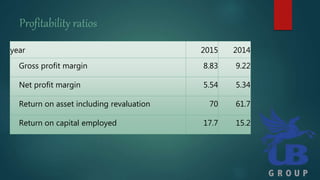
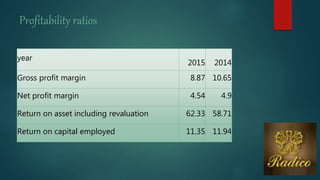
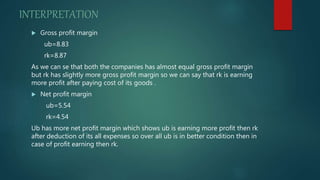
UNITEDBREWERIES
Head office UB City Banglor India
REDICO KHAITAN
Head Office Rampur U.P India
Date of Establishment 13-05 1999
Revenue 654.591 ( USD in Millions )
Market Cap 239180.8977854 ( Rs. in Millions )
Management Details Chairperson - Vijay Mallya
Date of Establishment 21-07 1983
Revenue 226.928 ( USD in Millions )
Market Cap 11747.3229495 ( Rs. in Millions )
Management Details Chairperson - Lalit Khaitan
Liquidity Ratios
Liquidity ratios analyze the ability of a company to pay off both its current liabilities as they
become due as well as their long-term liabilities as they become current.
These ratios are
 Current ratio
 Quick ratio
 Debtors turnover ratio
 Inventory turnover ratio
Liquidity ratio
YEAR 2015 2014
Current ratio 1.26 1.13
Quick ratio 1.05 1.4
Debtors turnover ratio 4.88 4.77
Inventory turnover ratio 14.74 7.77
Liquidity ratio
YEAR 2015 2014
Current ratio 1.15 1.14
Quick ratio 2.31 2.76
Debtors turnover ratio 2.97 3.03
Inventory turnover ratio 15.08 6.9
INTERPRETATION
 Current ratio
ub=1.26
rk=1.15
As from current ratio we can see that ub has 1.26 Rs for each liability of 1 Rs where
as rk has 1.15 Rs so ub is in better condition to pay its liability then rk.
 Quick ratio
ub=1.05
rk=2.31
As we can see that rk has better quick ratio so rk is in better liquidity condition then
ub. Rk can more easily pay its current liability then ub.
 Debtors turnover ratio
ub=4.88
rk=2.97
Ub has debtors turnover ratio higher then rk which shows ub has better
capability to fastly recover its debt and generate capital.
 Inventory turnover
ub=4.88
rk=15.8
As we can see that rk has higher inventory turnover ratio which shows that rk
has faster sale of product then ub.
Solvency ratio
Solvency ratios show a company's ability to make payments and pay
off its long-term obligations to creditors, bondholders, and banks.
Better solvency ratios indicate a more creditworthy and financially
sound company in the long-term.
Some basic ratios are
 Debt equity ratio
 Long term debt equity ratio
 Total debt to owners fund
 Interest coverage ratio
Solvency ratio
YEAR 2015 2014
Debt equity ratio 0.38 0.67
Long term debt equity ratio 0.28 0.37
Total debt to owners fund 0.38 0.67
Interest coverage ratio 6.2 5.21
Solvency ratio
YEAR 2015 2014
Debt equity ratio 0.9 1.07
Long term debt equity ratio 0.4 0.55
Total debt to owners fund 0.9 1.07
Interest coverage ratio 1.97 2.25
INTERPRETATION
 Debt equity ratio
ub=0.38
rk=0.9
As we can se that rk has higher debt equity ratio so it shows that there is low
security margin for creditors then ub. So in this case ub is in better condition
to pay the short term debts debt.
 Long term Debt equity ratio
ub= 0.28
rk=0.4
As we can see that ub has lessor long term debt equity ratio so ub has better
capability to pay the long term debts then rk.
 Total debt to owners fund
ub=0.38
rk=0.9
As we can see that total debt to owners fund ratio of ub is lesser so we can
say that ub has less capital then rk in form of long-term debt so ub is in better
condition.
 Interest coverage ratio
ub=6.2
rk=1.97
As we can see that ub has higher interest coverage ratio so ub has better
capability to pay the contractual interests then rk.
Profitability ratios compare income statement accounts and
categories to show a company's ability to generate profits from its
operations. Profitability ratios focus on a company's return on
investment in inventory and other assets. These ratios basically show
how well companies can achieve profits from their operations.
Some of these ratios are
 Gross profit margin
 Operating profit margin
 Net profit margin
 Return on asset including revaluation
 Return on capital employed
Profitability ratios
year 2015 2014
Gross profit margin 8.83 9.22
Net profit margin 5.54 5.34
Return on asset including revaluation 70 61.7
Return on capital employed 17.7 15.2
Profitability ratios
year
2015 2014
Gross profit margin 8.87 10.65
Net profit margin 4.54 4.9
Return on asset including revaluation 62.33 58.71
Return on capital employed 11.35 11.94
 Gross profit margin
ub=8.83
rk=8.87
As we can se that both the companies has almost equal gross profit margin
but rk has slightly more gross profit margin so we can say that rk is earning
more profit after paying cost of its goods .
 Net profit margin
ub=5.54
rk=4.54
Ub has more net profit margin which shows ub is earning more profit then rk
after deduction of its all expenses so over all ub is in better condition then in
case of profit earning then rk.
INTERPRETATION
 Return on asset including revaluation
ub=70
rk=62.33
As ub has higher return on asset so we can conclude that ub is more capable
then rk to generate more profit form available assets.
 Return on capital employed
ub=17.7
rk=11.35
As ub has higher return on capital employed so we can conclude that ub has
higher return on investment then rk.
Over all Interpretation
 As per my analysis ub is better option to invest because of the following
reasons:-
 Higher return on investment
 Higher profit margin
 Better liquidity condition
 Better capability to pay the debt
Ratio analysis

Ratio analysis

  • 3.
    UNITEDBREWERIES Head office UBCity Banglor India REDICO KHAITAN Head Office Rampur U.P India Date of Establishment 13-05 1999 Revenue 654.591 ( USD in Millions ) Market Cap 239180.8977854 ( Rs. in Millions ) Management Details Chairperson - Vijay Mallya Date of Establishment 21-07 1983 Revenue 226.928 ( USD in Millions ) Market Cap 11747.3229495 ( Rs. in Millions ) Management Details Chairperson - Lalit Khaitan
  • 4.
    Liquidity Ratios Liquidity ratiosanalyze the ability of a company to pay off both its current liabilities as they become due as well as their long-term liabilities as they become current. These ratios are  Current ratio  Quick ratio  Debtors turnover ratio  Inventory turnover ratio
  • 5.
    Liquidity ratio YEAR 20152014 Current ratio 1.26 1.13 Quick ratio 1.05 1.4 Debtors turnover ratio 4.88 4.77 Inventory turnover ratio 14.74 7.77
  • 6.
    Liquidity ratio YEAR 20152014 Current ratio 1.15 1.14 Quick ratio 2.31 2.76 Debtors turnover ratio 2.97 3.03 Inventory turnover ratio 15.08 6.9
  • 7.
    INTERPRETATION  Current ratio ub=1.26 rk=1.15 Asfrom current ratio we can see that ub has 1.26 Rs for each liability of 1 Rs where as rk has 1.15 Rs so ub is in better condition to pay its liability then rk.  Quick ratio ub=1.05 rk=2.31 As we can see that rk has better quick ratio so rk is in better liquidity condition then ub. Rk can more easily pay its current liability then ub.
  • 8.
     Debtors turnoverratio ub=4.88 rk=2.97 Ub has debtors turnover ratio higher then rk which shows ub has better capability to fastly recover its debt and generate capital.  Inventory turnover ub=4.88 rk=15.8 As we can see that rk has higher inventory turnover ratio which shows that rk has faster sale of product then ub.
  • 9.
    Solvency ratio Solvency ratiosshow a company's ability to make payments and pay off its long-term obligations to creditors, bondholders, and banks. Better solvency ratios indicate a more creditworthy and financially sound company in the long-term. Some basic ratios are  Debt equity ratio  Long term debt equity ratio  Total debt to owners fund  Interest coverage ratio
  • 10.
    Solvency ratio YEAR 20152014 Debt equity ratio 0.38 0.67 Long term debt equity ratio 0.28 0.37 Total debt to owners fund 0.38 0.67 Interest coverage ratio 6.2 5.21
  • 11.
    Solvency ratio YEAR 20152014 Debt equity ratio 0.9 1.07 Long term debt equity ratio 0.4 0.55 Total debt to owners fund 0.9 1.07 Interest coverage ratio 1.97 2.25
  • 12.
    INTERPRETATION  Debt equityratio ub=0.38 rk=0.9 As we can se that rk has higher debt equity ratio so it shows that there is low security margin for creditors then ub. So in this case ub is in better condition to pay the short term debts debt.  Long term Debt equity ratio ub= 0.28 rk=0.4 As we can see that ub has lessor long term debt equity ratio so ub has better capability to pay the long term debts then rk.
  • 13.
     Total debtto owners fund ub=0.38 rk=0.9 As we can see that total debt to owners fund ratio of ub is lesser so we can say that ub has less capital then rk in form of long-term debt so ub is in better condition.  Interest coverage ratio ub=6.2 rk=1.97 As we can see that ub has higher interest coverage ratio so ub has better capability to pay the contractual interests then rk.
  • 14.
    Profitability ratios compareincome statement accounts and categories to show a company's ability to generate profits from its operations. Profitability ratios focus on a company's return on investment in inventory and other assets. These ratios basically show how well companies can achieve profits from their operations. Some of these ratios are  Gross profit margin  Operating profit margin  Net profit margin  Return on asset including revaluation  Return on capital employed Profitability ratios
  • 15.
    Profitability ratios year 20152014 Gross profit margin 8.83 9.22 Net profit margin 5.54 5.34 Return on asset including revaluation 70 61.7 Return on capital employed 17.7 15.2
  • 16.
    Profitability ratios year 2015 2014 Grossprofit margin 8.87 10.65 Net profit margin 4.54 4.9 Return on asset including revaluation 62.33 58.71 Return on capital employed 11.35 11.94
  • 17.
     Gross profitmargin ub=8.83 rk=8.87 As we can se that both the companies has almost equal gross profit margin but rk has slightly more gross profit margin so we can say that rk is earning more profit after paying cost of its goods .  Net profit margin ub=5.54 rk=4.54 Ub has more net profit margin which shows ub is earning more profit then rk after deduction of its all expenses so over all ub is in better condition then in case of profit earning then rk. INTERPRETATION
  • 18.
     Return onasset including revaluation ub=70 rk=62.33 As ub has higher return on asset so we can conclude that ub is more capable then rk to generate more profit form available assets.  Return on capital employed ub=17.7 rk=11.35 As ub has higher return on capital employed so we can conclude that ub has higher return on investment then rk.
  • 19.
    Over all Interpretation As per my analysis ub is better option to invest because of the following reasons:-  Higher return on investment  Higher profit margin  Better liquidity condition  Better capability to pay the debt