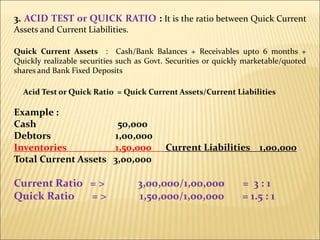
This document provides information on ratio analysis for financial statement evaluation. It defines various types of ratios including liquidity, activity, profitability, leverage and market ratios. Specific ratios discussed include current ratio, quick ratio, debt-equity ratio, gross profit ratio, return on equity, earnings per share and price-earnings ratio. The purpose, calculation and ideal levels of these ratios are explained. Sample balance sheet formats and ratio calculations are also presented to illustrate the concepts.


![5. PROPRIETARY RATIO : This ratio indicates the extent to which
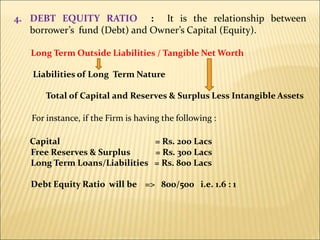
Tangible Assets are financed by Owner’s Fund.
Proprietary Ratio = (Tangible Net Worth/Total Tangible
Assets) x 100
The ratio will be 100% when there is no Borrowing for purchasing
of Assets.
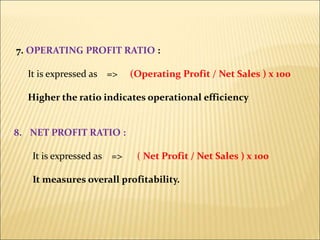
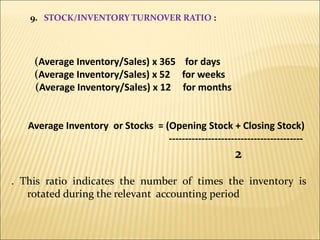
6. GROSS PROFIT RATIO : By comparing Gross Profit percentage to
Net Sales we can arrive at the Gross Profit Ratio which indicates the
manufacturing efficiency as well as the pricing policy of the concern.
Gross Profit Ratio = (Gross Profit / Net Sales ) x 100
Alternatively , since Gross Profit is equal to Sales minus Cost of
Goods Sold, it can also be interpreted as below :
Gross Profit Ratio = [ (Sales – Cost of goods sold)/ Net Sales]
x 100
A higher Gross Profit Ratio indicates efficiency in production of the unit.](https://image.slidesharecdn.com/ratioanalysis-221112135356-d964e6d1/85/RATIO-ANALYSIS-ppt-12-320.jpg)

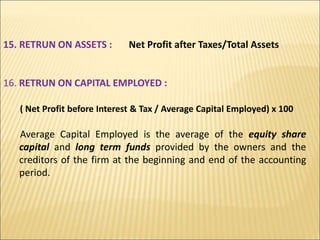


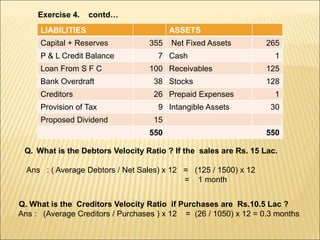
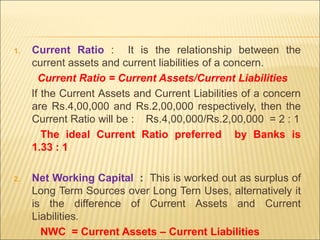
![LIABILITIES ASSETS
Capital + Reserves 355 Net Fixed Assets 265
P & L Credit Balance 7 Cash 1
Loan From S F C 100 Receivables 125
Bank Overdraft 38 Stocks 128
Creditors 26 Prepaid Expenses 1
Provision of Tax 9 Intangible Assets 30
Proposed Dividend 15
550 550
Q . What is the Proprietary Ratio ? Ans : (T NW / Tangible Assets) x 100
[ (362 - 30 ) / (550 – 30)] x 100
(332 / 520) x 100 = 64%
Q . What is the Net Working Capital ?
Ans : C. A - C L. = 255 - 88 = 167
Q . If Net Sales is Rs.15 Lac, then What would be the Stock Turnover
Ratio in Times ? Ans : Net Sales / Average Inventories/Stock
1500 / 128 = 12 times approximately
Exercise 4. contd…](https://image.slidesharecdn.com/ratioanalysis-221112135356-d964e6d1/85/RATIO-ANALYSIS-ppt-23-320.jpg)