, Rat Hnalyais
Short-tevm Soleny
CorentRatio
liguidRako
SuickRato
AcidTet
Rata
is a
CLASSIFICATION OFRATIOS
[Salvens Tehos
Tern Solveny
Debl-Equtt Ratio
-Totl Assetato Debt Ratio
Takest Caeraye Rato
Rto
Tonorer/AchvityRetos
dnanty TornoverRatios
Trade Reaivalle TuYnover
Rako
Trade layabuTumoer Rako
-WorkinyGtiaTumaer Rakia
Nel AscaorGfihlbulogd
Toinover Ratio
buunes.
Ratios
Esvnig fakabia
Oferaing Rato
NetPst Rato
Retm on Inetment o
RetnmotitEagd
2.
(I)LI9ujDITY RATI0S
() CumrentKatio = Cunent Aset
(u) Ligud oto SuickRotoQcid Tet Rato
iguid Asseta/Quick fset.
CuYent iabtes
H
Cuet liabillea
SoLvENCY RATioS
Ratio
(L)Debt Debt oy Long-Ter Delt
Shaxholders Funds
(u) Total Asseta o Debt Rato = Totas Asset
Ratio =
Debt
w Debt to Capitad Enmayed Rato e Dest
apialEmhlog
Total Assetu
(w Sntut Coveroge ahos Poft bekose TateteTr
Lateten ng.Term Debt
(EBIT)
3.
NetAsseti
or Gfi
h
d Eml
o
yed
reveneFrom Gpera ti
m
s
(vi
) Ne
t Asset Tornorer Rat
o
or Coad Empl
o
yed nesr
Ne
t Fired Asseta
(v) Fi
x
ed Asseu Tur
n ovey Ratioe Revenue Fr
o
m t
h
i
m
s
Worki
n
g Gotid
CNet Sa)
() dorking apild TurnaurRa
ko
= RevenuAo
m af
era hor
Averae Tr
a
de eyakl
e
a
(ü Trade Tayableu Tornoer
Ra
ho
= Ne
d tredt reheas
Aueray Trade civetla
(Cedt Salw
Trade Reatvabe
TornovrRaho Crlt Revenue fo
n ab
Averag Inventoy
((04S)
) Tnventory TornortrRat
i
o
= Cos
t qRevenufr
o
r
a hns
(T) ACTIVITY /TURNOVER
RATIOS
4.
N PROFITABILITY RATI0S
u)Goss= Gross
wNetot Rato = Net Brotit
Rato
Revenu Fron Gperatma
oY
Reene'FroN erehimna
Cast
Cost Reenu fromserahona +
Reenufom orata
.xlo
xlo
Botit beox Intnt, Tax Dieend
(v)Return on Znestnantabilal Enbloyeal or Yeld om
xl
xlo
Krfit
Reenufiom derokons
5.
the ForMulaa
2Debt
3
Lang- TermBoruings t g- Teom Praitia
NNen- Cwt iabites
+Resenea 4Sush
4)Totl sseta = Nen- Cuent tseeta t Nor lumeat
Iny. +
Cunent Asset
Woyt
t
6) Total iabilhe Shaneholdes t Nm lonent
fl
+ Cunet bab.
(
G) Tota! Debt Nen- Cud i'ab+Ct bab.
Uas.
s.
Nel ired Azvea t workiy Gite
Nel xed tsseth e Fyed Asseti - Datreiatas
6.
Creditort
+ Bi
l
s Payabb
TvadePeyat
l
a Creditort
cl
a
si
n
g
TC
2
f
e
ni
n
g
TP
Ly Trade Reeinasler
Debtors
+ Bi
l
l
s ivalles
2
+ cl
o
si
n
g
) average Tr
a
de Reuivaslaeabeni
g T&t cl
o
i
n
y
T&
- Purehates
Re hn
03) Ne
l Credit orehates
e Tol
a
l orchasu
- Credit ehs,
Total Salu
- Cash Salyo Sas et
n
Cs
h Salus
S Averea Tr
e
de ayabl
a
2
- Gr
o
ss Kef
t
124NCred Sals Net Sos
Thuent
o
y
GossoSs
Rot
CNel eahiny
= Reenu f
r
o
n oerahia
+ Ne
t orehosea
+ Diet ensea
) Ave
ro
oþeni
n
y Jnveny
6 Cost Reee
ro
n operationu CCoCs)
7.
SAveraye Collechim Periede 365 dayy in ayear
12 mentt in ayer
Selliyt Dishibuha
Trode Reuivally Turnoer Raho
( Averaqe Poyable leniod e 36s days/12 mm ta in ayar
Trade Ryatla Tornar pabo
PBIT- Intest- Tax
Praftaftautax +Tar t
Intet
Net prolt Nen- peratiny Exp- en-operehiyhan
Lnt m
Short torn lany
8.
Liquidity Ratios
Liquidity refersto the ability of the firm to meet its current liabilities as they
becomedue for payment. The liquidity ratios, therefore, are also called 'short
term solvency ratios. These ratios are used to assess the short-term financial
position.
Current Ratio or Working Capital Ratio
This ratio is used to assess the fim's ability to meet its short-term liabilities on
time.
Current Ratio =
" Acurrent ratio of 2 : Iis supposed to be an idea ratio. The higher the ratio, the
better it is, because the firm will be able to pay its current liabilitymore easily.
Current Assets
Current Llabillties
" The reason of assuming2 :las the ideal ratio is that the current assets include
such assets as inventory, trade receivables etc., from which full amount cannot
be realized in case of need. Hence, even if half the amount is realized from the
current assets on time, the firm can still meet its current liabilities in full.
" Inventoriesexcluding loose tools, stores & parts.
" Net Trade receivables are considered.
Quick Ratio or Acid Test Ratio or Liquid Ratio
This ratio indicates whether the firm is in a position to pay its current liabilities
within a month or if they have to be paid immediately.
Liquid Ratio = LiquldAssets
Current Llablities
" Aliquid ratio ofl:lis supposed to be an idea ratio. The higher the ratio, the
better it is, because the firm will be able to pay its current liability more easily.
" This ratio is better test of short-term financial position of the company than the
current ratio, as it considers only those assets which can be easily and readily
converted into cash.
ACCOUNTING RATIOS
" Liquid Assets = Current Assets - Inventories - Prepaid Expenses & Advance Tax
Activity Ratios or Turnover Ratios
These ratios measure the efficiency and rapidity of the resources of the
company, like inventory, fixed assets, working capital, trade receivables etc.
These ratios are generally calculated on the basis of revenue from operations
or cost of revenue from operations.
Inventory Turnover Ratio
Inventory Turnover Ratio
This ratio indicates whether inventory has been efficiently used or no.
Cost of Revenue from Operations
Average Inventory
" The higher the ratio, the better it is, since it indicates that inventory is selling
quickly.
" This ratio can be used for comparing the efficiency ofsales policies of two firms
doing same type of business.
Trade Receivables Turnover Ratio
This ratio indicates the spced with which the amount is collected from the trade
receivables.
Trade Receivables Turnover Ratio
" Gross TR are to be considered.
Credlt Revenue from Operations
Average Trade Recetvables
" The higher the ratio, the better it is, since it indicates that amount from trade
receivables is being collected morequickly.
" The more quickly the trade receivables pay, the less the risk from bad debts, and
so the lower the expenses of collection and increase in the liquidity of the fim.
By comparing the trade receivables turnover ratio of the current year with the
previous year, it may be assessed whether the Sale policy of the management is
efficient or not.
Trade Payable Turnover Ratio
This ratio indicates the speed with which the amount is being paid to trade
payables.
Net Credit Purchases
Average Trade payables
Trade Payables Turnover Ratio =
" The higher the ratio, the better it is, since it will indicate that the trade payables
are being paid more quickly which increases the credit worthiness of the firm.
Working Capital Turnover Ratio
This ratio reveals how efficiently Working Capital has been utilization in making
Revenue from operations.
Working Capital Turnover Ratio - Revenue from Operations
Working Capttal
Solvency Ratios
These ratios are calculated to assess the ability of the firm to meet its long-term
liabilities as and when they become due.
These ratios reveal as to how much amount in a business has been invested by
proprietors and how much amount has been raised from outside sources.
Solvency ratios disclose the firm's ability to meet the interest costs regularly
and long-term indebtedness at maturity.
Debt Equity Ratio
This ratio indicates the proportion of funds which are acquired by long-term
borrowings in comparison to sharcholder's funds.
Debt
Debt Equity Ratio=-
Long-term Debts
Shareholder's Funds or net worth
" Ifthedebt-equity ratio is more than 2:1,it showsa rather riskyfinancial position
from the long-term point of view, as it indicates that more and more funds
invested in the business are provided by long-term lenders.
" Debts =Long-term Borrowings + Long-term Provisions
Total Assets to Debt Ratio
This ratio expresses the relationship between total assets and long-term debts.
Total Assets to Debt Ratin - otal Assets
" I measures the extent to which long-term debts are covered by assets which
indicates the margin of safety available to providers of long-term loans.
" A higher total assets to debt ratio implies the use of lower debts in financing the
assets which means a larger safety margin for lenders and vice versa.
Proprietary Ratio
Debt
This ratio indicates the proportionoftotal assets funded by ownersorshareholders.
Proprietary Ratio = Equity
Total Assets
" A higher proprietary ratio is generally treated an indicator of sound financial
position from long-term point of view, because it means that a large proportion
of total assets is provided by equity and hence the firm is less dependent on
external source of finance and vice versa.
Interest Coverage Ratio
This ratio indicates how many times the interest charges are covered by the profits
available to pay interest charges.
PBIT
Interest Coverage Ratio = Fired Interest Charges on Debt
" An interest coverage ratio of 6 to 7 times is considered appropriate.
" This ratio measures the margin ofsafety for long-term lenders.
" The higher the ratio, more secure the lender is in respect of payment of interest
regularly.
Debt to Capital Employed Ratio
This ratio indicates the proportion of funds provided by long-term lenders in
comparison to the total capital employed in the business.
Debt to Capital Employed Ratio = Long term Debts
Capital Employed
" Capital Employed (LiaApproach): Equity +Debt
" Ahigh debt to capital employed ratio shows a rather risky financial position as
it indicates that more and more funds invested in the business are provided by
long-term lenders. t shows the lenders are at high risk and vice versa.
" Capital Employed (Assets Approach): Non-Current Assets +Working Capital
Fixed Assets Turnover Ratio
This ratio reveals how efficiently the fixed assets are being utilized in generating
sales.
Fixed Assets Turnover Rotio - Revenue from Operations
Net Fired Assets
" Compared with the previous year, ifthere is increase in this ratio, it will indicate
that there is better utilization of fixed assets,.
Net Assets Turnover Ratio or Capital Employed Turnover Ratio
This ratio reveals how efficiently Net Assets or Capital Employed has been
utilization in making Revenue from operations.
Net Assets Turnover Ratio = Revenue from Operatlons
Net Assets or Capltal Emplo yed
" Ahigh Net Assets turnover ratio shows efficient use of Net Assets resulting into
higher profitability. A low Net Assets turnover ratio indicates under-utilisation
of Net Assets.
Equtty
9.
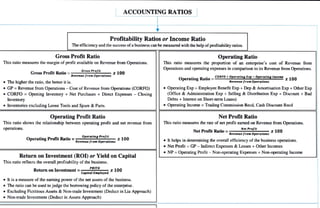
Gross Profit Ratio
GrossProfit Ratio =
" The higher the ratio, the better it is.
The efficiencyand the successofabusiness can be measured with the help ofprofitability ratios.
This ratio measures the margin of profit available on Revenue from Operations.
Gross Proflt
Revenue from Operattons
Inventories excluding Loose Tools and Spare &Parts.
Operating Profit Ratio
" GP =Revenue from Operations -Cost of Revenue from Operations (CORFO)
CORFO = Opening Inventory + Net Purchases + Direct Expenses Closing
Inventory
Operating Profit Ratio=
Profitability Ratios or Income Ratio
This ratio shows the relationship between operating profit and net revenue from
operations.
Operattng Profit
Revenue from Operations
ACCOUNTING RATIOS
Return on Investment =
PBITD
Capital Employed
100
Return on Investment (RO) or Yield on Capital
This ratio reflects the overall profitabilityof the business.
X100
" Non-trade Investment (Deduct in Assets Approach)
x 100
It is a measure of the earning power of the net assets of the business.
" The ratio can be used to judge the borrowing policy of the enterprise.
Excluding Fictitious Assets &Non-trade Investment (Deduct in Lia Approach)
Operating Ratio
This ratio measures the proportion of an enterprise's cost of Revenue from
Operations and operating expenses in comparison to its Revenue from Operations.
Operating Ratio=o+operating Exp-Operatlng Income
Revenue from Operatlons
" Operating Exp =Employee Benefit Exp +Dep &Amortisation Exp +Other Exp
(Office &Administration Exp + Selling &Distribution Exp + Discount + Bad
Debts + Interest on Short-term Loans)
" Operating Income =Trading Commission Recd, Cash Discount Recd
Net Profit Ratio
This ratio measures the rate of net profit earned on Revenue from Operations.
Net Proft
Net Profit Ratio =
Revenue from Operations
* 100
" It helps in determining the overallefficiency of the business operations.
Net Profit = GP Indirect Expenses & Losses + Other Incomes
" NP =Operating Profit - Non-operating Expenses + Non-operating Income


![[DSC Europe 25] Elena Menshikova - AI-Powered Operational Excellence: Revolut...](https://cdn.slidesharecdn.com/ss_thumbnails/es6nholbqy3zaao2c2yd-2-elena-menshikova-data-ai-in-decision-making-260115093812-4fba8b38-thumbnail.jpg?width=640&height=640&fit=bounds)


![[DSC Europe 25] Srba Markovic - From Pilot to Production: Overcoming AI Deplo...](https://cdn.slidesharecdn.com/ss_thumbnails/yjjmrtytmwbalxlba7px-4-srba-markovic-from-pilot-to-production-overcoming-ai-deployment-blockers-with-260114111931-4a892d44-thumbnail.jpg?width=640&height=640&fit=bounds)
![[DSC Europe 25] Ivica Milaric - The Future of Gaming and AI Tools.pptx](https://cdn.slidesharecdn.com/ss_thumbnails/tijgzsmgse2kj2y5pzzp-5-ivica-milaric-the-future-of-gaming-x-ai-tools-260114111931-87c2b3ac-thumbnail.jpg?width=640&height=640&fit=bounds)


