SlideShare a Scribd company logo
1 of 8
0
0.1
0.2
0.3
0.4
0.5
0.6
0.7
0.8
0.9
1
2011 2012 2013 2014 2015
current
ratio
quick
ratio
Liquidity ratios
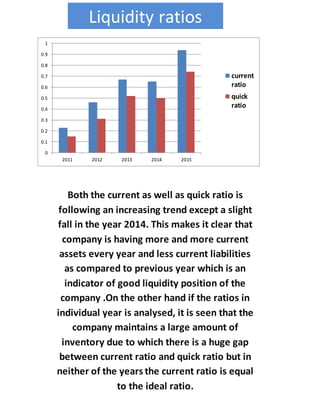
Both the current as well as quick ratio is
following an increasing trend except a slight
fall in the year 2014. This makes it clear that
company is having more and more current
assets every year and less current liabilities
as compared to previous year which is an
indicator of good liquidity position of the
company .On the other hand if the ratios in
individual year is analysed, it is seen that the
company maintains a large amount of
inventory due to which there is a huge gap
between current ratio and quick ratio but in
neither of the years the current ratio is equal
to the ideal ratio.
0
0.2
0.4
0.6
0.8
1
1.2
2011 2012 2013 2014 2015
debt equity ratio
debt to capital
employed ratio
proprietary ratio
Solvency ratios
The chart shows that the debt equity ratio is
decreasing which means that company is having
less debt in current year as compared to
previous year which is a good sign as it
decreases a fixed financial charge on the
company i.e. interest payment. This also leads to
decrease in debt to capital employed ratio which
means that out of total money invested in the
business, less money is borrowed one which
ultimately causes an increase in proprietary
ratio. The company is having same equity share
capital every year just the reserves are
increasing which means that company is having
more profits and is retaining more of them .
0
2
4
6
8
10
12
14
16
18
20
2011 2012 2013 2014 2015
Total assets to debt ratio
total assets to
debt ratio
This ratio shows that how much part
of total assets is financed by debt.
High ratio indicates that less of total
assets are financed out of debt. As
the value of debt is decreasing every
year and ultimately becomes nil so
the ratio is increasing and in the last
two years as the value of debt is nil so
the ratio cannot be determined s is a
good sign as it indicates that the
company is in good solvency position.
0
50
100
150
200
250
300
350
400
2011 2012 2013 2014 2015
Interest coverage ratio
This ratio shows that how much profit is
available to pay off the interest
payment.
It is increasing every year. This reveals
that the company is having enough
profits to pay off interest. The ratio is
increasing because the interest payment
is decreasing because debt is decreasing
year after year the company is having
good solvency position
0
20
40
60
80
100
120
140
160
180
2011 2012 2013 2014 2015
Inventory turnover ratio
Debtor turnover ratio
Total assets turnover ratio
Turnover ratios
Turnover ratios indicate the speed at which the activities
of business are performed .Inventory turnover ratio
shows number of times inventory is converted into
revenue .this ratio is somewhat same every year and the
company is in goodposition. Debtor turnover ratio shows
the number of times debtors are convertedinto cash. The
chart shows that the ratio is decreasing which means that
the collection is not speedy. Company must take steps to
cope up with this problem assets turnover ratio is
somewhat same every year. It indicates good working
activity of the firm.
0%
5%
10%
15%
20%
25%
2011 2012 2013 2014 2015
Gross profit ratio
Operating profit ratio
Net profit ratio
Profitability ratios
There is a huge difference between gross
profit and net profit ratio & operating
profit ratio every year which means that
the company is spending a lot on
operating expenses which is leading to fall
in the operating profit. So the company
must take some steps to control the
operating and non-operating expenses.
0%
10%
20%
30%
40%
50%
60%
70%
80%
90%
2011 2012 2013 2014 2015
Return on investment
Return on shareholders
funds
76%
77%
77%
78%
78%
79%
79%
80%
2011 2012 2013 2014 2015
Operating ratio
Operating ratio
Graph 1
Graph 2
Graph 1 shows return on investment. It explains the overall
utilisation of funds by a business enterprise.This ratio is
decreasing every which indicates that company is not good
return on investment and same is the case with return on
shareholder funds
Graph 2 shows operating ratio .This ratio indicates all the
expenses. This ratio is very high but is decreasingyear after
year which is a good sign for the company.
₹ 0.00
₹ 50.00
₹ 100.00
₹ 150.00
₹ 200.00
₹ 250.00
₹ 300.00
₹ 350.00
2011 2012 2013 2014 2015
Earning per share
Book value
0
0.2
0.4
0.6
0.8
1
1.2
2011 2012 2013 2014 2015
Dividend payout ratio
Graph 3
Graph 4
Graph 3 shows the earning which a shareholder is getting on his share.
This is increasing every year which means that the company is in good
financial condition and is getting enough profit which is ultimately
leading to good book value of the firm’s share.
Graph 4 shows the dividend pay-out ratio which shows a decreasing
trend which means although the company is having enough profits to
pay dividend but it is not paying because it is keeping more as retained
earnings in the form of reserves .

More Related Content

What's hot

Financial Statment Analysis of TATA MOTORS
Financial Statment Analysis of TATA MOTORSFinancial Statment Analysis of TATA MOTORS
Financial Statment Analysis of TATA MOTORSHussain bohra
 
Capital Structure Analysis
Capital Structure Analysis Capital Structure Analysis
Capital Structure Analysis Dipika Sahoo
 
Financial analysis of Hero Motorcorp'13 ppt
Financial analysis of Hero Motorcorp'13 pptFinancial analysis of Hero Motorcorp'13 ppt
Financial analysis of Hero Motorcorp'13 pptSakshi Garg
 
Larsen and toubro
Larsen and toubroLarsen and toubro
Larsen and toubroankit3991
 
ratio anaylsis of dabur india ltd
ratio anaylsis of dabur india ltdratio anaylsis of dabur india ltd
ratio anaylsis of dabur india ltdMadhu Bala
 
tcs anual report analysis
tcs anual report analysistcs anual report analysis
tcs anual report analysisViʞaƨh ʞumar
 
Financial Ratio Analysis of Samsung for the year 2013-2014
Financial Ratio Analysis of Samsung for the year 2013-2014Financial Ratio Analysis of Samsung for the year 2013-2014
Financial Ratio Analysis of Samsung for the year 2013-2014Prinson Rodrigues
 
Balance Sheet and Ratio Analysis of a Listed Company
Balance Sheet and Ratio Analysis of a Listed CompanyBalance Sheet and Ratio Analysis of a Listed Company
Balance Sheet and Ratio Analysis of a Listed CompanyShreyansh Kejriwal
 
Hero MotoCorp Financial Analysis Report
Hero MotoCorp Financial Analysis ReportHero MotoCorp Financial Analysis Report
Hero MotoCorp Financial Analysis ReportPrateek Singh Bapna
 
Capital Structure of Tata Motors
Capital Structure of Tata MotorsCapital Structure of Tata Motors
Capital Structure of Tata MotorsAkash Saha
 
WIPRO Fundamental Analysis
WIPRO Fundamental AnalysisWIPRO Fundamental Analysis
WIPRO Fundamental AnalysisDeepak Kumar
 
Presentation on Hero Motocorp CSR Activities
Presentation on Hero Motocorp CSR ActivitiesPresentation on Hero Motocorp CSR Activities
Presentation on Hero Motocorp CSR ActivitiesKOUSHIK KHAN
 
Maruti Suzuki India Ltd Financial Statement Analysis
Maruti Suzuki India Ltd Financial Statement AnalysisMaruti Suzuki India Ltd Financial Statement Analysis
Maruti Suzuki India Ltd Financial Statement AnalysisMaruthi Nataraj K
 
Financial statement Analysis of Reliance Industries Ltd..pdf
Financial statement Analysis of Reliance Industries Ltd..pdfFinancial statement Analysis of Reliance Industries Ltd..pdf
Financial statement Analysis of Reliance Industries Ltd..pdfNirupamaMaharana
 
Analysis of financial statement of asianpaints ltd
Analysis of financial statement of asianpaints ltdAnalysis of financial statement of asianpaints ltd
Analysis of financial statement of asianpaints ltdBrijin Jacob
 
summer internship project report presentation on HUL
summer internship project report presentation on HULsummer internship project report presentation on HUL
summer internship project report presentation on HULAruna Lambha
 
Industry specific ratios and Financial Ratios
Industry specific ratios and Financial RatiosIndustry specific ratios and Financial Ratios
Industry specific ratios and Financial RatiosVishak G
 
Power Point Presentation on reliance industries
Power Point Presentation on reliance industriesPower Point Presentation on reliance industries
Power Point Presentation on reliance industriesPiyush Rane
 

What's hot (20)

Financial Statment Analysis of TATA MOTORS
Financial Statment Analysis of TATA MOTORSFinancial Statment Analysis of TATA MOTORS
Financial Statment Analysis of TATA MOTORS
 
Capital Structure Analysis
Capital Structure Analysis Capital Structure Analysis
Capital Structure Analysis
 
Financial analysis of Hero Motorcorp'13 ppt
Financial analysis of Hero Motorcorp'13 pptFinancial analysis of Hero Motorcorp'13 ppt
Financial analysis of Hero Motorcorp'13 ppt
 
Larsen and toubro
Larsen and toubroLarsen and toubro
Larsen and toubro
 
Dabur
DaburDabur
Dabur
 
ratio anaylsis of dabur india ltd
ratio anaylsis of dabur india ltdratio anaylsis of dabur india ltd
ratio anaylsis of dabur india ltd
 
tcs anual report analysis
tcs anual report analysistcs anual report analysis
tcs anual report analysis
 
Financial Ratio Analysis of Samsung for the year 2013-2014
Financial Ratio Analysis of Samsung for the year 2013-2014Financial Ratio Analysis of Samsung for the year 2013-2014
Financial Ratio Analysis of Samsung for the year 2013-2014
 
Balance Sheet and Ratio Analysis of a Listed Company
Balance Sheet and Ratio Analysis of a Listed CompanyBalance Sheet and Ratio Analysis of a Listed Company
Balance Sheet and Ratio Analysis of a Listed Company
 
Hero MotoCorp Financial Analysis Report
Hero MotoCorp Financial Analysis ReportHero MotoCorp Financial Analysis Report
Hero MotoCorp Financial Analysis Report
 
Capital Structure of Tata Motors
Capital Structure of Tata MotorsCapital Structure of Tata Motors
Capital Structure of Tata Motors
 
WIPRO Fundamental Analysis
WIPRO Fundamental AnalysisWIPRO Fundamental Analysis
WIPRO Fundamental Analysis
 
Presentation on Hero Motocorp CSR Activities
Presentation on Hero Motocorp CSR ActivitiesPresentation on Hero Motocorp CSR Activities
Presentation on Hero Motocorp CSR Activities
 
Maruti Suzuki India Ltd Financial Statement Analysis
Maruti Suzuki India Ltd Financial Statement AnalysisMaruti Suzuki India Ltd Financial Statement Analysis
Maruti Suzuki India Ltd Financial Statement Analysis
 
Financial statement Analysis of Reliance Industries Ltd..pdf
Financial statement Analysis of Reliance Industries Ltd..pdfFinancial statement Analysis of Reliance Industries Ltd..pdf
Financial statement Analysis of Reliance Industries Ltd..pdf
 
Analysis of financial statement of asianpaints ltd
Analysis of financial statement of asianpaints ltdAnalysis of financial statement of asianpaints ltd
Analysis of financial statement of asianpaints ltd
 
summer internship project report presentation on HUL
summer internship project report presentation on HULsummer internship project report presentation on HUL
summer internship project report presentation on HUL
 
Hero MotoCorp HR presentation
Hero MotoCorp HR presentationHero MotoCorp HR presentation
Hero MotoCorp HR presentation
 
Industry specific ratios and Financial Ratios
Industry specific ratios and Financial RatiosIndustry specific ratios and Financial Ratios
Industry specific ratios and Financial Ratios
 
Power Point Presentation on reliance industries
Power Point Presentation on reliance industriesPower Point Presentation on reliance industries
Power Point Presentation on reliance industries
 

Viewers also liked

Financial reporting and analysis hero motocorp ltd. v1
Financial reporting and analysis   hero motocorp ltd. v1Financial reporting and analysis   hero motocorp ltd. v1
Financial reporting and analysis hero motocorp ltd. v1Samir Singh
 
presentation on financial statement of hero moto corp
presentation on financial statement of hero moto corppresentation on financial statement of hero moto corp
presentation on financial statement of hero moto corpsayed124
 
Hero motocorp ltd full PPT
Hero motocorp ltd full PPTHero motocorp ltd full PPT
Hero motocorp ltd full PPTSushant N'kkr
 
New project 3c hero
New project 3c heroNew project 3c hero
New project 3c heroSUBHAPAUL7
 
Profile of hero motocorp ltd
Profile of hero motocorp ltdProfile of hero motocorp ltd
Profile of hero motocorp ltdamritpal kaur
 
Fundamental Analysis of Companies in Hospitality Sector in India
Fundamental Analysis of Companies in Hospitality Sector in India Fundamental Analysis of Companies in Hospitality Sector in India
Fundamental Analysis of Companies in Hospitality Sector in India amritpal kaur
 
Financial analysis of Adani Enterprises
Financial analysis of Adani EnterprisesFinancial analysis of Adani Enterprises
Financial analysis of Adani EnterprisesHardik Shah
 
Sip final project (26 7-2014)dhru moto corp,bardoli(dipak patel)
Sip final project (26 7-2014)dhru moto corp,bardoli(dipak patel)Sip final project (26 7-2014)dhru moto corp,bardoli(dipak patel)
Sip final project (26 7-2014)dhru moto corp,bardoli(dipak patel)Jain Monika
 
Hero honda team ppt @ bec doms bagalkot mba
Hero  honda  team ppt @ bec doms bagalkot mbaHero  honda  team ppt @ bec doms bagalkot mba
Hero honda team ppt @ bec doms bagalkot mbaBabasab Patil
 
Customer awareness and effectiveness @ hero honda project report
Customer awareness and effectiveness @ hero honda project reportCustomer awareness and effectiveness @ hero honda project report
Customer awareness and effectiveness @ hero honda project reportBabasab Patil
 
Performance Evaluation- Hero MotoCorp
Performance Evaluation- Hero MotoCorpPerformance Evaluation- Hero MotoCorp
Performance Evaluation- Hero MotoCorpAniket Harsh
 
Ppt on hero moto corp.
Ppt on hero moto corp.Ppt on hero moto corp.
Ppt on hero moto corp.Kalim Khan
 
Comparative income statement
Comparative income statementComparative income statement
Comparative income statementAdil Shaikh
 

Viewers also liked (20)

Financial reporting and analysis hero motocorp ltd. v1
Financial reporting and analysis   hero motocorp ltd. v1Financial reporting and analysis   hero motocorp ltd. v1
Financial reporting and analysis hero motocorp ltd. v1
 
presentation on financial statement of hero moto corp
presentation on financial statement of hero moto corppresentation on financial statement of hero moto corp
presentation on financial statement of hero moto corp
 
Hero motocorp ltd full PPT
Hero motocorp ltd full PPTHero motocorp ltd full PPT
Hero motocorp ltd full PPT
 
New project 3c hero
New project 3c heroNew project 3c hero
New project 3c hero
 
Hero motocorp
Hero motocorpHero motocorp
Hero motocorp
 
working capital management
 working capital management working capital management
working capital management
 
HERO MOTOCORP
HERO MOTOCORPHERO MOTOCORP
HERO MOTOCORP
 
Hero
HeroHero
Hero
 
Hero moto corp.
Hero moto corp.Hero moto corp.
Hero moto corp.
 
Profile of hero motocorp ltd
Profile of hero motocorp ltdProfile of hero motocorp ltd
Profile of hero motocorp ltd
 
Fundamental Analysis of Companies in Hospitality Sector in India
Fundamental Analysis of Companies in Hospitality Sector in India Fundamental Analysis of Companies in Hospitality Sector in India
Fundamental Analysis of Companies in Hospitality Sector in India
 
Financial analysis of Adani Enterprises
Financial analysis of Adani EnterprisesFinancial analysis of Adani Enterprises
Financial analysis of Adani Enterprises
 
Sip final project (26 7-2014)dhru moto corp,bardoli(dipak patel)
Sip final project (26 7-2014)dhru moto corp,bardoli(dipak patel)Sip final project (26 7-2014)dhru moto corp,bardoli(dipak patel)
Sip final project (26 7-2014)dhru moto corp,bardoli(dipak patel)
 
Hero honda team ppt @ bec doms bagalkot mba
Hero  honda  team ppt @ bec doms bagalkot mbaHero  honda  team ppt @ bec doms bagalkot mba
Hero honda team ppt @ bec doms bagalkot mba
 
Ratio analysis project
Ratio analysis project Ratio analysis project
Ratio analysis project
 
Customer awareness and effectiveness @ hero honda project report
Customer awareness and effectiveness @ hero honda project reportCustomer awareness and effectiveness @ hero honda project report
Customer awareness and effectiveness @ hero honda project report
 
Performance Evaluation- Hero MotoCorp
Performance Evaluation- Hero MotoCorpPerformance Evaluation- Hero MotoCorp
Performance Evaluation- Hero MotoCorp
 
Ppt on hero moto corp.
Ppt on hero moto corp.Ppt on hero moto corp.
Ppt on hero moto corp.
 
Debt equity ratio
Debt equity ratioDebt equity ratio
Debt equity ratio
 
Comparative income statement
Comparative income statementComparative income statement
Comparative income statement
 

Similar to ratio analysis of hero motocorp ltd.

Fianacial analysis
Fianacial analysisFianacial analysis
Fianacial analysisNaveed Ul
 
Infosys Ratio Analysis
Infosys Ratio AnalysisInfosys Ratio Analysis
Infosys Ratio AnalysisAfshan Hirji
 
FRCG Assignment of Atul ltd
FRCG Assignment of Atul ltdFRCG Assignment of Atul ltd
FRCG Assignment of Atul ltdSounak Bhadra
 
ATLAS HONDA ratio analysis
ATLAS HONDA ratio analysisATLAS HONDA ratio analysis
ATLAS HONDA ratio analysisACCA Global
 
ppt on WORKING CAPITAL MANAGEMENT AT Silver Forge Pvt...
        ppt on       WORKING CAPITAL MANAGEMENT AT           Silver Forge Pvt...        ppt on       WORKING CAPITAL MANAGEMENT AT           Silver Forge Pvt...
ppt on WORKING CAPITAL MANAGEMENT AT Silver Forge Pvt...jitharadharmesh
 
The overview of financial performance of transcom electronic company ltd
The overview of  financial performance of transcom electronic company ltdThe overview of  financial performance of transcom electronic company ltd
The overview of financial performance of transcom electronic company ltdxeon_adi
 
StarbucksLiquidity RatiosCurrent ratio2015Ratio2014RatioCurrent As.docx
StarbucksLiquidity RatiosCurrent ratio2015Ratio2014RatioCurrent As.docxStarbucksLiquidity RatiosCurrent ratio2015Ratio2014RatioCurrent As.docx
StarbucksLiquidity RatiosCurrent ratio2015Ratio2014RatioCurrent As.docxwhitneyleman54422
 
Apple Company Profile Assignment Help
Apple Company Profile Assignment HelpApple Company Profile Assignment Help
Apple Company Profile Assignment Helpassignmenthelpp
 
financial ststement ratio analysis
financial ststement ratio analysisfinancial ststement ratio analysis
financial ststement ratio analysisshabir shekh
 
Stock Analysis of HDFC Bank.pptx
Stock Analysis of HDFC Bank.pptxStock Analysis of HDFC Bank.pptx
Stock Analysis of HDFC Bank.pptxAdarshSingh749984
 
Assignment on financial ratio by Md. Parvez Alam.
Assignment on financial ratio by Md. Parvez Alam.Assignment on financial ratio by Md. Parvez Alam.
Assignment on financial ratio by Md. Parvez Alam.MD. Parvez Alam
 
Starbucks Financial Analysis
Starbucks Financial AnalysisStarbucks Financial Analysis
Starbucks Financial AnalysisSecily Coleman
 
Running head FINANCIAL ANALYSIS OF LOWE’S COMPANY .docx
Running head FINANCIAL ANALYSIS OF LOWE’S COMPANY                .docxRunning head FINANCIAL ANALYSIS OF LOWE’S COMPANY                .docx
Running head FINANCIAL ANALYSIS OF LOWE’S COMPANY .docxwlynn1
 
Mien Phi Tai 10 Bai Assignment Mau Tu Moi Chu De
Mien Phi Tai 10 Bai Assignment Mau Tu Moi Chu DeMien Phi Tai 10 Bai Assignment Mau Tu Moi Chu De
Mien Phi Tai 10 Bai Assignment Mau Tu Moi Chu DeEssay24h Viết thuê Essay
 
1Running Head FINANCIALFinancial OverviewSt.docx
1Running Head FINANCIALFinancial OverviewSt.docx1Running Head FINANCIALFinancial OverviewSt.docx
1Running Head FINANCIALFinancial OverviewSt.docxeugeniadean34240
 
Fra report by kshitij seth
Fra   report by kshitij sethFra   report by kshitij seth
Fra report by kshitij sethSaritaKapoor4
 
Finance Assignment Ratio Analysis.
Finance Assignment Ratio Analysis. Finance Assignment Ratio Analysis.
Finance Assignment Ratio Analysis. nusratjahan56
 

Similar to ratio analysis of hero motocorp ltd. (20)

Fianacial analysis
Fianacial analysisFianacial analysis
Fianacial analysis
 
Infosys Ratio Analysis
Infosys Ratio AnalysisInfosys Ratio Analysis
Infosys Ratio Analysis
 
FRCG Assignment of Atul ltd
FRCG Assignment of Atul ltdFRCG Assignment of Atul ltd
FRCG Assignment of Atul ltd
 
ATLAS HONDA ratio analysis
ATLAS HONDA ratio analysisATLAS HONDA ratio analysis
ATLAS HONDA ratio analysis
 
Liquidity ratio
Liquidity ratioLiquidity ratio
Liquidity ratio
 
ppt on WORKING CAPITAL MANAGEMENT AT Silver Forge Pvt...
        ppt on       WORKING CAPITAL MANAGEMENT AT           Silver Forge Pvt...        ppt on       WORKING CAPITAL MANAGEMENT AT           Silver Forge Pvt...
ppt on WORKING CAPITAL MANAGEMENT AT Silver Forge Pvt...
 
The overview of financial performance of transcom electronic company ltd
The overview of  financial performance of transcom electronic company ltdThe overview of  financial performance of transcom electronic company ltd
The overview of financial performance of transcom electronic company ltd
 
StarbucksLiquidity RatiosCurrent ratio2015Ratio2014RatioCurrent As.docx
StarbucksLiquidity RatiosCurrent ratio2015Ratio2014RatioCurrent As.docxStarbucksLiquidity RatiosCurrent ratio2015Ratio2014RatioCurrent As.docx
StarbucksLiquidity RatiosCurrent ratio2015Ratio2014RatioCurrent As.docx
 
Apple Company Profile Assignment Help
Apple Company Profile Assignment HelpApple Company Profile Assignment Help
Apple Company Profile Assignment Help
 
financial ststement ratio analysis
financial ststement ratio analysisfinancial ststement ratio analysis
financial ststement ratio analysis
 
Gull ahmad.pptx
Gull ahmad.pptx Gull ahmad.pptx
Gull ahmad.pptx
 
Stock Analysis of HDFC Bank.pptx
Stock Analysis of HDFC Bank.pptxStock Analysis of HDFC Bank.pptx
Stock Analysis of HDFC Bank.pptx
 
Assignment on financial ratio by Md. Parvez Alam.
Assignment on financial ratio by Md. Parvez Alam.Assignment on financial ratio by Md. Parvez Alam.
Assignment on financial ratio by Md. Parvez Alam.
 
Starbucks Financial Analysis
Starbucks Financial AnalysisStarbucks Financial Analysis
Starbucks Financial Analysis
 
Running head FINANCIAL ANALYSIS OF LOWE’S COMPANY .docx
Running head FINANCIAL ANALYSIS OF LOWE’S COMPANY                .docxRunning head FINANCIAL ANALYSIS OF LOWE’S COMPANY                .docx
Running head FINANCIAL ANALYSIS OF LOWE’S COMPANY .docx
 
Mien Phi Tai 10 Bai Assignment Mau Tu Moi Chu De
Mien Phi Tai 10 Bai Assignment Mau Tu Moi Chu DeMien Phi Tai 10 Bai Assignment Mau Tu Moi Chu De
Mien Phi Tai 10 Bai Assignment Mau Tu Moi Chu De
 
1Running Head FINANCIALFinancial OverviewSt.docx
1Running Head FINANCIALFinancial OverviewSt.docx1Running Head FINANCIALFinancial OverviewSt.docx
1Running Head FINANCIALFinancial OverviewSt.docx
 
Fra report by kshitij seth
Fra   report by kshitij sethFra   report by kshitij seth
Fra report by kshitij seth
 
Finance Assignment Ratio Analysis.
Finance Assignment Ratio Analysis. Finance Assignment Ratio Analysis.
Finance Assignment Ratio Analysis.
 
Ratio dlf
Ratio dlfRatio dlf
Ratio dlf
 

More from amritpal kaur

paramount razor blade case study
paramount razor blade case studyparamount razor blade case study
paramount razor blade case studyamritpal kaur
 
E-commerce business models
 E-commerce business models  E-commerce business models
E-commerce business models amritpal kaur
 
Lawyer's stakeholder map
Lawyer's stakeholder map Lawyer's stakeholder map
Lawyer's stakeholder map amritpal kaur
 
Lawyer's stakeholder map
Lawyer's stakeholder map Lawyer's stakeholder map
Lawyer's stakeholder map amritpal kaur
 
New York times Paywall case study
New York times Paywall case study New York times Paywall case study
New York times Paywall case study amritpal kaur
 
Law of diminishing marginal utility
Law of diminishing marginal utilityLaw of diminishing marginal utility
Law of diminishing marginal utilityamritpal kaur
 
STP analysis of fiama di wills
STP analysis of fiama di wills STP analysis of fiama di wills
STP analysis of fiama di wills amritpal kaur
 

More from amritpal kaur (7)

paramount razor blade case study
paramount razor blade case studyparamount razor blade case study
paramount razor blade case study
 
E-commerce business models
 E-commerce business models  E-commerce business models
E-commerce business models
 
Lawyer's stakeholder map
Lawyer's stakeholder map Lawyer's stakeholder map
Lawyer's stakeholder map
 
Lawyer's stakeholder map
Lawyer's stakeholder map Lawyer's stakeholder map
Lawyer's stakeholder map
 
New York times Paywall case study
New York times Paywall case study New York times Paywall case study
New York times Paywall case study
 
Law of diminishing marginal utility
Law of diminishing marginal utilityLaw of diminishing marginal utility
Law of diminishing marginal utility
 
STP analysis of fiama di wills
STP analysis of fiama di wills STP analysis of fiama di wills
STP analysis of fiama di wills
 

Recently uploaded

18-04-UA_REPORT_MEDIALITERAСY_INDEX-DM_23-1-final-eng.pdf
18-04-UA_REPORT_MEDIALITERAСY_INDEX-DM_23-1-final-eng.pdf18-04-UA_REPORT_MEDIALITERAСY_INDEX-DM_23-1-final-eng.pdf
18-04-UA_REPORT_MEDIALITERAСY_INDEX-DM_23-1-final-eng.pdfssuser54595a
 
Incoming and Outgoing Shipments in 1 STEP Using Odoo 17
Incoming and Outgoing Shipments in 1 STEP Using Odoo 17Incoming and Outgoing Shipments in 1 STEP Using Odoo 17
Incoming and Outgoing Shipments in 1 STEP Using Odoo 17Celine George
 
Roles & Responsibilities in Pharmacovigilance
Roles & Responsibilities in PharmacovigilanceRoles & Responsibilities in Pharmacovigilance
Roles & Responsibilities in PharmacovigilanceSamikshaHamane
 
Historical philosophical, theoretical, and legal foundations of special and i...
Historical philosophical, theoretical, and legal foundations of special and i...Historical philosophical, theoretical, and legal foundations of special and i...
Historical philosophical, theoretical, and legal foundations of special and i...jaredbarbolino94
 
Painted Grey Ware.pptx, PGW Culture of India
Painted Grey Ware.pptx, PGW Culture of IndiaPainted Grey Ware.pptx, PGW Culture of India
Painted Grey Ware.pptx, PGW Culture of IndiaVirag Sontakke
 
CELL CYCLE Division Science 8 quarter IV.pptx
CELL CYCLE Division Science 8 quarter IV.pptxCELL CYCLE Division Science 8 quarter IV.pptx
CELL CYCLE Division Science 8 quarter IV.pptxJiesonDelaCerna
 
KSHARA STURA .pptx---KSHARA KARMA THERAPY (CAUSTIC THERAPY)————IMP.OF KSHARA ...
KSHARA STURA .pptx---KSHARA KARMA THERAPY (CAUSTIC THERAPY)————IMP.OF KSHARA ...KSHARA STURA .pptx---KSHARA KARMA THERAPY (CAUSTIC THERAPY)————IMP.OF KSHARA ...
KSHARA STURA .pptx---KSHARA KARMA THERAPY (CAUSTIC THERAPY)————IMP.OF KSHARA ...M56BOOKSTORE PRODUCT/SERVICE
 
Biting mechanism of poisonous snakes.pdf
Biting mechanism of poisonous snakes.pdfBiting mechanism of poisonous snakes.pdf
Biting mechanism of poisonous snakes.pdfadityarao40181
 
History Class XII Ch. 3 Kinship, Caste and Class (1).pptx
History Class XII Ch. 3 Kinship, Caste and Class (1).pptxHistory Class XII Ch. 3 Kinship, Caste and Class (1).pptx
History Class XII Ch. 3 Kinship, Caste and Class (1).pptxsocialsciencegdgrohi
 
Software Engineering Methodologies (overview)
Software Engineering Methodologies (overview)Software Engineering Methodologies (overview)
Software Engineering Methodologies (overview)eniolaolutunde
 
DATA STRUCTURE AND ALGORITHM for beginners
DATA STRUCTURE AND ALGORITHM for beginnersDATA STRUCTURE AND ALGORITHM for beginners
DATA STRUCTURE AND ALGORITHM for beginnersSabitha Banu
 
भारत-रोम व्यापार.pptx, Indo-Roman Trade,
भारत-रोम व्यापार.pptx, Indo-Roman Trade,भारत-रोम व्यापार.pptx, Indo-Roman Trade,
भारत-रोम व्यापार.pptx, Indo-Roman Trade,Virag Sontakke
 
Introduction to ArtificiaI Intelligence in Higher Education
Introduction to ArtificiaI Intelligence in Higher EducationIntroduction to ArtificiaI Intelligence in Higher Education
Introduction to ArtificiaI Intelligence in Higher Educationpboyjonauth
 
Capitol Tech U Doctoral Presentation - April 2024.pptx
Capitol Tech U Doctoral Presentation - April 2024.pptxCapitol Tech U Doctoral Presentation - April 2024.pptx
Capitol Tech U Doctoral Presentation - April 2024.pptxCapitolTechU
 
Alper Gobel In Media Res Media Component
Alper Gobel In Media Res Media ComponentAlper Gobel In Media Res Media Component
Alper Gobel In Media Res Media ComponentInMediaRes1
 
ECONOMIC CONTEXT - LONG FORM TV DRAMA - PPT
ECONOMIC CONTEXT - LONG FORM TV DRAMA - PPTECONOMIC CONTEXT - LONG FORM TV DRAMA - PPT
ECONOMIC CONTEXT - LONG FORM TV DRAMA - PPTiammrhaywood
 
Interactive Powerpoint_How to Master effective communication
Interactive Powerpoint_How to Master effective communicationInteractive Powerpoint_How to Master effective communication
Interactive Powerpoint_How to Master effective communicationnomboosow
 

Recently uploaded (20)

18-04-UA_REPORT_MEDIALITERAСY_INDEX-DM_23-1-final-eng.pdf
18-04-UA_REPORT_MEDIALITERAСY_INDEX-DM_23-1-final-eng.pdf18-04-UA_REPORT_MEDIALITERAСY_INDEX-DM_23-1-final-eng.pdf
18-04-UA_REPORT_MEDIALITERAСY_INDEX-DM_23-1-final-eng.pdf
 
Incoming and Outgoing Shipments in 1 STEP Using Odoo 17
Incoming and Outgoing Shipments in 1 STEP Using Odoo 17Incoming and Outgoing Shipments in 1 STEP Using Odoo 17
Incoming and Outgoing Shipments in 1 STEP Using Odoo 17
 
Roles & Responsibilities in Pharmacovigilance
Roles & Responsibilities in PharmacovigilanceRoles & Responsibilities in Pharmacovigilance
Roles & Responsibilities in Pharmacovigilance
 
Historical philosophical, theoretical, and legal foundations of special and i...
Historical philosophical, theoretical, and legal foundations of special and i...Historical philosophical, theoretical, and legal foundations of special and i...
Historical philosophical, theoretical, and legal foundations of special and i...
 
Painted Grey Ware.pptx, PGW Culture of India
Painted Grey Ware.pptx, PGW Culture of IndiaPainted Grey Ware.pptx, PGW Culture of India
Painted Grey Ware.pptx, PGW Culture of India
 
CELL CYCLE Division Science 8 quarter IV.pptx
CELL CYCLE Division Science 8 quarter IV.pptxCELL CYCLE Division Science 8 quarter IV.pptx
CELL CYCLE Division Science 8 quarter IV.pptx
 
KSHARA STURA .pptx---KSHARA KARMA THERAPY (CAUSTIC THERAPY)————IMP.OF KSHARA ...
KSHARA STURA .pptx---KSHARA KARMA THERAPY (CAUSTIC THERAPY)————IMP.OF KSHARA ...KSHARA STURA .pptx---KSHARA KARMA THERAPY (CAUSTIC THERAPY)————IMP.OF KSHARA ...
KSHARA STURA .pptx---KSHARA KARMA THERAPY (CAUSTIC THERAPY)————IMP.OF KSHARA ...
 
Biting mechanism of poisonous snakes.pdf
Biting mechanism of poisonous snakes.pdfBiting mechanism of poisonous snakes.pdf
Biting mechanism of poisonous snakes.pdf
 
History Class XII Ch. 3 Kinship, Caste and Class (1).pptx
History Class XII Ch. 3 Kinship, Caste and Class (1).pptxHistory Class XII Ch. 3 Kinship, Caste and Class (1).pptx
History Class XII Ch. 3 Kinship, Caste and Class (1).pptx
 
Software Engineering Methodologies (overview)
Software Engineering Methodologies (overview)Software Engineering Methodologies (overview)
Software Engineering Methodologies (overview)
 
DATA STRUCTURE AND ALGORITHM for beginners
DATA STRUCTURE AND ALGORITHM for beginnersDATA STRUCTURE AND ALGORITHM for beginners
DATA STRUCTURE AND ALGORITHM for beginners
 
ESSENTIAL of (CS/IT/IS) class 06 (database)
ESSENTIAL of (CS/IT/IS) class 06 (database)ESSENTIAL of (CS/IT/IS) class 06 (database)
ESSENTIAL of (CS/IT/IS) class 06 (database)
 
भारत-रोम व्यापार.pptx, Indo-Roman Trade,
भारत-रोम व्यापार.pptx, Indo-Roman Trade,भारत-रोम व्यापार.pptx, Indo-Roman Trade,
भारत-रोम व्यापार.pptx, Indo-Roman Trade,
 
Introduction to ArtificiaI Intelligence in Higher Education
Introduction to ArtificiaI Intelligence in Higher EducationIntroduction to ArtificiaI Intelligence in Higher Education
Introduction to ArtificiaI Intelligence in Higher Education
 
Capitol Tech U Doctoral Presentation - April 2024.pptx
Capitol Tech U Doctoral Presentation - April 2024.pptxCapitol Tech U Doctoral Presentation - April 2024.pptx
Capitol Tech U Doctoral Presentation - April 2024.pptx
 
Alper Gobel In Media Res Media Component
Alper Gobel In Media Res Media ComponentAlper Gobel In Media Res Media Component
Alper Gobel In Media Res Media Component
 
ECONOMIC CONTEXT - LONG FORM TV DRAMA - PPT
ECONOMIC CONTEXT - LONG FORM TV DRAMA - PPTECONOMIC CONTEXT - LONG FORM TV DRAMA - PPT
ECONOMIC CONTEXT - LONG FORM TV DRAMA - PPT
 
Interactive Powerpoint_How to Master effective communication
Interactive Powerpoint_How to Master effective communicationInteractive Powerpoint_How to Master effective communication
Interactive Powerpoint_How to Master effective communication
 
Model Call Girl in Tilak Nagar Delhi reach out to us at 🔝9953056974🔝
Model Call Girl in Tilak Nagar Delhi reach out to us at 🔝9953056974🔝Model Call Girl in Tilak Nagar Delhi reach out to us at 🔝9953056974🔝
Model Call Girl in Tilak Nagar Delhi reach out to us at 🔝9953056974🔝
 
9953330565 Low Rate Call Girls In Rohini Delhi NCR
9953330565 Low Rate Call Girls In Rohini  Delhi NCR9953330565 Low Rate Call Girls In Rohini  Delhi NCR
9953330565 Low Rate Call Girls In Rohini Delhi NCR
 

ratio analysis of hero motocorp ltd.

  • 1. 0 0.1 0.2 0.3 0.4 0.5 0.6 0.7 0.8 0.9 1 2011 2012 2013 2014 2015 current ratio quick ratio Liquidity ratios Both the current as well as quick ratio is following an increasing trend except a slight fall in the year 2014. This makes it clear that company is having more and more current assets every year and less current liabilities as compared to previous year which is an indicator of good liquidity position of the company .On the other hand if the ratios in individual year is analysed, it is seen that the company maintains a large amount of inventory due to which there is a huge gap between current ratio and quick ratio but in neither of the years the current ratio is equal to the ideal ratio.
  • 2. 0 0.2 0.4 0.6 0.8 1 1.2 2011 2012 2013 2014 2015 debt equity ratio debt to capital employed ratio proprietary ratio Solvency ratios The chart shows that the debt equity ratio is decreasing which means that company is having less debt in current year as compared to previous year which is a good sign as it decreases a fixed financial charge on the company i.e. interest payment. This also leads to decrease in debt to capital employed ratio which means that out of total money invested in the business, less money is borrowed one which ultimately causes an increase in proprietary ratio. The company is having same equity share capital every year just the reserves are increasing which means that company is having more profits and is retaining more of them .
  • 3. 0 2 4 6 8 10 12 14 16 18 20 2011 2012 2013 2014 2015 Total assets to debt ratio total assets to debt ratio This ratio shows that how much part of total assets is financed by debt. High ratio indicates that less of total assets are financed out of debt. As the value of debt is decreasing every year and ultimately becomes nil so the ratio is increasing and in the last two years as the value of debt is nil so the ratio cannot be determined s is a good sign as it indicates that the company is in good solvency position.
  • 4. 0 50 100 150 200 250 300 350 400 2011 2012 2013 2014 2015 Interest coverage ratio Interest coverage ratio This ratio shows that how much profit is available to pay off the interest payment. It is increasing every year. This reveals that the company is having enough profits to pay off interest. The ratio is increasing because the interest payment is decreasing because debt is decreasing year after year the company is having good solvency position
  • 5. 0 20 40 60 80 100 120 140 160 180 2011 2012 2013 2014 2015 Inventory turnover ratio Debtor turnover ratio Total assets turnover ratio Turnover ratios Turnover ratios indicate the speed at which the activities of business are performed .Inventory turnover ratio shows number of times inventory is converted into revenue .this ratio is somewhat same every year and the company is in goodposition. Debtor turnover ratio shows the number of times debtors are convertedinto cash. The chart shows that the ratio is decreasing which means that the collection is not speedy. Company must take steps to cope up with this problem assets turnover ratio is somewhat same every year. It indicates good working activity of the firm.
  • 6. 0% 5% 10% 15% 20% 25% 2011 2012 2013 2014 2015 Gross profit ratio Operating profit ratio Net profit ratio Profitability ratios There is a huge difference between gross profit and net profit ratio & operating profit ratio every year which means that the company is spending a lot on operating expenses which is leading to fall in the operating profit. So the company must take some steps to control the operating and non-operating expenses.
  • 7. 0% 10% 20% 30% 40% 50% 60% 70% 80% 90% 2011 2012 2013 2014 2015 Return on investment Return on shareholders funds 76% 77% 77% 78% 78% 79% 79% 80% 2011 2012 2013 2014 2015 Operating ratio Operating ratio Graph 1 Graph 2 Graph 1 shows return on investment. It explains the overall utilisation of funds by a business enterprise.This ratio is decreasing every which indicates that company is not good return on investment and same is the case with return on shareholder funds Graph 2 shows operating ratio .This ratio indicates all the expenses. This ratio is very high but is decreasingyear after year which is a good sign for the company.
  • 8. ₹ 0.00 ₹ 50.00 ₹ 100.00 ₹ 150.00 ₹ 200.00 ₹ 250.00 ₹ 300.00 ₹ 350.00 2011 2012 2013 2014 2015 Earning per share Book value 0 0.2 0.4 0.6 0.8 1 1.2 2011 2012 2013 2014 2015 Dividend payout ratio Dividend payout ratio Graph 3 Graph 4 Graph 3 shows the earning which a shareholder is getting on his share. This is increasing every year which means that the company is in good financial condition and is getting enough profit which is ultimately leading to good book value of the firm’s share. Graph 4 shows the dividend pay-out ratio which shows a decreasing trend which means although the company is having enough profits to pay dividend but it is not paying because it is keeping more as retained earnings in the form of reserves .