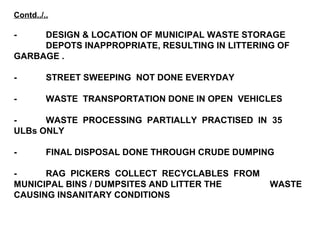
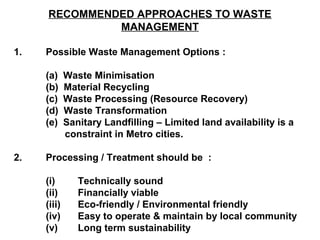
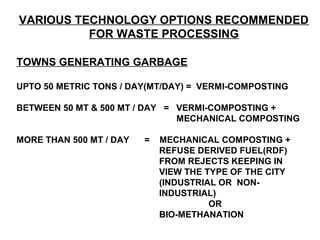
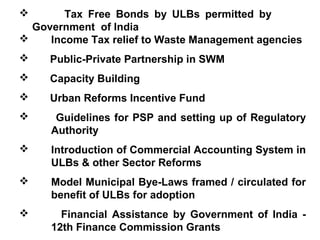
SOLID WASTE

MANAGEMENT

  IN INDIA
India’s Population   =   1027 Million
As per 2001 Census


Urban Population     =   285 Million


Urban Areas          =   5161
(Cities / Towns)
TREND OF URBANIZATION

                            Year    Year   Year   Year
                            1951    1991   2001   2021

1. Number of Urban        2795      3768   5161    --
   Agglomerations / Towns


2. Urban Population          62.0   217.0 285.0 550.0
   (in million)


3. As percentage of total   17.3% 25.72% 27.8% 41%
   Population
MAGNITUDE OF PROBLEM


-    Per capita waste generation increasing by
1.3% per annum


-     With urban population increasing between
3 – 3.5% per annum


-    Yearly increase in waste generation is
around 5% annually
-   India produces 42.0 million tons of
municipal solid waste annually at present.


-     Per capita generation of waste varies from
200 gm to 600 gm per capita / day. Average
generation rate at 0.4 kg per capita per day
in 0.1 million plus towns.


-    Collection efficiency ranges between 50% to
     90% of the solid waste generated.
-   Urban Local Bodies spend around Rs.500/-
    to Rs.1500/- per ton on solid waste
management of which,

    *    60-70% of the amount is on
         collection alone

    *    20% - 30% on transportation

    *    Hardly any fund is spent on
         treatment and disposal of waste

-   Crude dumping of waste in most of the
    cities
QUANTITY OF WASTE GENERATION

TOTAL QUANTITY OF SOLID WASTE             1.15 LAKH TONNE
GENERATED IN URBAN AREAS                  PER DAY (TPD)
OF THE COUNTRY
                                                   % OF TOTAL
                                                   GARBAGE
WASTE GENERATED IN 6 MEGA CITIES   21,100 TPD         18.35%

WASTE GENERATED IN METRO CITIES    19,643 TPD         17.08%
(1 MILLION PLUS TOWNS)

WASTE GENERATED IN OTHER           42,635.28 TPD      37.07%
CLASS-I TOWNS
(0.1 MILLION PLUS TOWNS)           ____________    _________
                                   83,378.28 TPD      72.50%

IF WASTE PRODUCED IN ALL CLASS-I CITIES IS TACKLED, PERCENTAGE
OF WASTE SCIENTIFICALLY MANAGED WOULD BE 72.5% OF TOTAL
WASTE.
Characteristics of Municipal Solid Waste

Compostable / Bio-degradable = 30% - 55%
matter                       (can be converted
                              into manure)

Inert material                = 40% - 45% (to
                                go to landfill)

Recyclable materials          = 5% - 10%
                               (Recycling)

These percentages vary from city to city depending
on food habits
PRESENT STATUS OF WASTE MANAGEMENT

-    STORAGE OF WASTE AT SOURCE IS LACKING

     - DOMESTIC WASTE THROWN ON STREETS
     - TRADE WASTE ON ROADS / STREETS
     - CONSTRUCTION DEBRIS LEFT UNATTENDED
     - BIO-MEDICAL WASTE DISPOSED IN MUNICIPAL
       WASTE STREAM
     - INDUSTRIAL WASTE DISPOSED OF IN OPEN
       AREAS

-    SEGREGATION OF RECYCLABLE WASTE AT SOURCE
NOT DONE

-    PRIMARY COLLECTION OF WASTE NOT DONE AT
     PLACE OF GENERATION
Contd../..

-    DESIGN & LOCATION OF MUNICIPAL WASTE STORAGE
     DEPOTS INAPPROPRIATE, RESULTING IN LITTERING OF
GARBAGE .

-        STREET SWEEPING NOT DONE EVERYDAY

-        WASTE TRANSPORTATION DONE IN OPEN VEHICLES

-     WASTE PROCESSING PARTIALLY PRACTISED IN 35
ULBs ONLY

-        FINAL DISPOSAL DONE THROUGH CRUDE DUMPING

-     RAG PICKERS COLLECT RECYCLABLES FROM
MUNICIPAL BINS / DUMPSITES AND LITTER THE        WASTE
CAUSING INSANITARY CONDITIONS
REASONS FOR IMPROPER MANAGEMENT OF WASTE

        Lack of planning for waste management while planning
       townships
       Lack of proper institutional set up for          waste
management, planning and designing in urban local bodies
      Lack of technically trained manpower
      Lack of community involvement
      Lack of expertise and exposure to city waste management
       using modern techniques / best practices
      Lack of awareness creation mechanism
      Lack of Management Information Systems
      Lack of funds with ULBs
       Indifferent attitude of ULBs to levy user charges and
sustainability
RECOMMENDED APPROACHES TO WASTE
              MANAGEMENT

1.   Possible Waste Management Options :

     (a)     Waste Minimisation
     (b)     Material Recycling
     (c)     Waste Processing (Resource Recovery)
     (d)     Waste Transformation
     (e)     Sanitary Landfilling – Limited land availability is a
             constraint in Metro cities.

2.   Processing / Treatment should be :

     (i)        Technically sound
     (ii)       Financially viable
     (iii)      Eco-friendly / Environmental friendly
     (iv)       Easy to operate & maintain by local community
     (v)        Long term sustainability
RECOMMENDED APPROACHES TO WASTE PROCESSING
                    & DISPOSAL
I     WEALTH FROM WASTE (PROCESSING OF ORGANIC WASTE)

      (A)   WASTE TO COMPOST

            (i)    AEROBIC / ANAEROBIC COMPOSTING

            (ii)   VERMI-COMPOSTING

      (B) WASTE TO ENERGY

            (i)    REFUSE DERIVED FUEL (RDF) / PELLETIZATION

            (ii)   BIO-METHANATION

II          RECYCLING OF WASTE

III         SANITARY LANDFILLING

IV          TREATMENT OF BIO-MEDICAL WASTE SEPARATELY
VARIOUS TECHNOLOGY OPTIONS RECOMMENDED
          FOR WASTE PROCESSING

TOWNS GENERATING GARBAGE

UPTO 50 METRIC TONS / DAY(MT/DAY) = VERMI-COMPOSTING

BETWEEN 50 MT & 500 MT / DAY = VERMI-COMPOSTING +
                               MECHANICAL COMPOSTING

MORE THAN 500 MT / DAY   =   MECHANICAL COMPOSTING +
                             REFUSE DERIVED FUEL(RDF)
                             FROM REJECTS KEEPING IN
                             VIEW THE TYPE OF THE CITY
                             (INDUSTRIAL OR NON-
                             INDUSTRIAL)
                                       OR
                             BIO-METHANATION
TENTH PLAN PROPOSALS

Requirement of funds as per 10th Plan document for
0.1 million plus towns as per 1991 Census are as
under:-

Capital Investment      =     Rs.23226.00 million

Equipment replacement =       Rs. 1355.00 million
cost
                              ________________

                             Rs.24581.00 million
                             ________________
                     Based on January, 2000 prices
INITIATIVES BY GOVERNMENT OF INDIA
    Bio-medical Waste Handling Rules, 1998 -
     Notified
      Municipal Solid Waste Management Rules,
     2000 – Notified.
    Reforms Agenda (Fiscal, Institutional, Legal)
    Technical Manual on Municipal Solid Waste
     Management
    Technology Advisory Group on Municipal
     Solid Waste Management
   Inter-Ministerial Task Force on Integrated
    Plant Nutrient Management from city
compost.
       Tax Free Bonds by ULBs permitted by
  Government of India
    Income Tax relief to Waste Management agencies
    Public-Private Partnership in SWM
    Capacity Building
    Urban Reforms Incentive Fund
     Guidelines for PSP and setting up of Regulatory
     Authority
    Introduction of Commercial Accounting System in
     ULBs & other Sector Reforms
    Model Municipal Bye-Laws framed / circulated for
     benefit of ULBs for adoption
      Financial Assistance by Government of India -
     12th Finance Commission Grants
DEVOLUTION OF 12TH FINANCE COMMISSION GRANTS
    FOR WASTE MANAGEMENT – RS.2500.00 CRORES

                                    ( RS. IN MILLION)

(I) COLLECTION AND TRANSPORTATION       -     3864.4
    EQUIPMENT & MACHINERY

(II) COMPOST PLANTS                    -    10012.3

(III) SANITARY LANDFILL DEVELOPMENT     -      10568.8
                                        -------------------
                         TOTAL                 24445.5
                                       ------------------
DEVOLUTION TO ULBs BY 12TH FINANCE    - Rs.19439.4 Million
COMMISSION

PRIVATE SECTOR INVESTMENT              - Rs.5006.2 Million
ENVISAGED THROUGH PPP IN
COMPOSTING / SANITARY LANDFILLING
NATIONAL URBAN RENEWAL MISSION

 CENTRAL / STATE GRANTS ARE PROPOSED TO BE PROVIDED
 FOR SOLID WASTE MANAGEMENT

                                        Grant
                               Centre           State   Loan


Cities with 4 million plus      35%             15%     50%
population
Cities with one million plus    50%             20%     30%
population but less than 4
million
Other cities                    80%             10%     10%
MAIN ISSUES

-    ABSENCE OF SEGREGATION OF WASTE AT SOURCE

-    LACK   OF    TECHNICAL   EXPERTISE   AND
APPROPRIATE INSTITUTIONAL ARRANGEMENT

-    UNWILLINGNESS OF ULBs TO INTRODUCE PROPER
COLLECTION,    SEGREGATION, TRANSPORTATION    AND
TREATMENT / DISPOSAL SYSTEMS

-    INDIFFERENT ATTITUDE OF CITIZENS TOWARDS    WASTE
     MANAGEMENT DUE TO LACK OF AWARENESS

-    LACK OF COMMUNITY PARTICIPATION TOWARDS WASTE
     MANAGEMENT AND HYGIENIC CONDITIONS

-     LACK OF FUNDS WITH ULBs
RECOMMENDATIONS

-     Outsourcing of all activities under Solid Waste
Management Services recommended by 12th
Finance Commission for using grants
-     ULBs to concentrate on segregation of waste at
source
-     Waste processing like composting, bio-
methanation should be done through public-private
partnerships / private sector
-     Final disposal viz. sanitary landfilling to be done
under public private partnerships / private sector
-    Bio-medical waste to be managed by Central Bio-
Medical Waste Management Facilities.

Solid waste mgt_india

  • 1.
  • 2.
    India’s Population = 1027 Million As per 2001 Census Urban Population = 285 Million Urban Areas = 5161 (Cities / Towns)
  • 3.
    TREND OF URBANIZATION Year Year Year Year 1951 1991 2001 2021 1. Number of Urban 2795 3768 5161 -- Agglomerations / Towns 2. Urban Population 62.0 217.0 285.0 550.0 (in million) 3. As percentage of total 17.3% 25.72% 27.8% 41% Population
  • 4.
    MAGNITUDE OF PROBLEM - Per capita waste generation increasing by 1.3% per annum - With urban population increasing between 3 – 3.5% per annum - Yearly increase in waste generation is around 5% annually
  • 5.
    - India produces 42.0 million tons of municipal solid waste annually at present. - Per capita generation of waste varies from 200 gm to 600 gm per capita / day. Average generation rate at 0.4 kg per capita per day in 0.1 million plus towns. - Collection efficiency ranges between 50% to 90% of the solid waste generated.
  • 6.
    - Urban Local Bodies spend around Rs.500/- to Rs.1500/- per ton on solid waste management of which, * 60-70% of the amount is on collection alone * 20% - 30% on transportation * Hardly any fund is spent on treatment and disposal of waste - Crude dumping of waste in most of the cities
  • 7.
    QUANTITY OF WASTEGENERATION TOTAL QUANTITY OF SOLID WASTE 1.15 LAKH TONNE GENERATED IN URBAN AREAS PER DAY (TPD) OF THE COUNTRY % OF TOTAL GARBAGE WASTE GENERATED IN 6 MEGA CITIES 21,100 TPD 18.35% WASTE GENERATED IN METRO CITIES 19,643 TPD 17.08% (1 MILLION PLUS TOWNS) WASTE GENERATED IN OTHER 42,635.28 TPD 37.07% CLASS-I TOWNS (0.1 MILLION PLUS TOWNS) ____________ _________ 83,378.28 TPD 72.50% IF WASTE PRODUCED IN ALL CLASS-I CITIES IS TACKLED, PERCENTAGE OF WASTE SCIENTIFICALLY MANAGED WOULD BE 72.5% OF TOTAL WASTE.
  • 8.
    Characteristics of MunicipalSolid Waste Compostable / Bio-degradable = 30% - 55% matter (can be converted into manure) Inert material = 40% - 45% (to go to landfill) Recyclable materials = 5% - 10% (Recycling) These percentages vary from city to city depending on food habits
  • 9.
    PRESENT STATUS OFWASTE MANAGEMENT - STORAGE OF WASTE AT SOURCE IS LACKING - DOMESTIC WASTE THROWN ON STREETS - TRADE WASTE ON ROADS / STREETS - CONSTRUCTION DEBRIS LEFT UNATTENDED - BIO-MEDICAL WASTE DISPOSED IN MUNICIPAL WASTE STREAM - INDUSTRIAL WASTE DISPOSED OF IN OPEN AREAS - SEGREGATION OF RECYCLABLE WASTE AT SOURCE NOT DONE - PRIMARY COLLECTION OF WASTE NOT DONE AT PLACE OF GENERATION
  • 10.
    Contd../.. - DESIGN & LOCATION OF MUNICIPAL WASTE STORAGE DEPOTS INAPPROPRIATE, RESULTING IN LITTERING OF GARBAGE . - STREET SWEEPING NOT DONE EVERYDAY - WASTE TRANSPORTATION DONE IN OPEN VEHICLES - WASTE PROCESSING PARTIALLY PRACTISED IN 35 ULBs ONLY - FINAL DISPOSAL DONE THROUGH CRUDE DUMPING - RAG PICKERS COLLECT RECYCLABLES FROM MUNICIPAL BINS / DUMPSITES AND LITTER THE WASTE CAUSING INSANITARY CONDITIONS
  • 11.
    REASONS FOR IMPROPERMANAGEMENT OF WASTE  Lack of planning for waste management while planning townships  Lack of proper institutional set up for waste management, planning and designing in urban local bodies  Lack of technically trained manpower  Lack of community involvement  Lack of expertise and exposure to city waste management using modern techniques / best practices  Lack of awareness creation mechanism  Lack of Management Information Systems  Lack of funds with ULBs  Indifferent attitude of ULBs to levy user charges and sustainability
  • 12.
    RECOMMENDED APPROACHES TOWASTE MANAGEMENT 1. Possible Waste Management Options : (a) Waste Minimisation (b) Material Recycling (c) Waste Processing (Resource Recovery) (d) Waste Transformation (e) Sanitary Landfilling – Limited land availability is a constraint in Metro cities. 2. Processing / Treatment should be : (i) Technically sound (ii) Financially viable (iii) Eco-friendly / Environmental friendly (iv) Easy to operate & maintain by local community (v) Long term sustainability
  • 13.
    RECOMMENDED APPROACHES TOWASTE PROCESSING & DISPOSAL I WEALTH FROM WASTE (PROCESSING OF ORGANIC WASTE) (A) WASTE TO COMPOST (i) AEROBIC / ANAEROBIC COMPOSTING (ii) VERMI-COMPOSTING (B) WASTE TO ENERGY (i) REFUSE DERIVED FUEL (RDF) / PELLETIZATION (ii) BIO-METHANATION II RECYCLING OF WASTE III SANITARY LANDFILLING IV TREATMENT OF BIO-MEDICAL WASTE SEPARATELY
  • 14.
    VARIOUS TECHNOLOGY OPTIONSRECOMMENDED FOR WASTE PROCESSING TOWNS GENERATING GARBAGE UPTO 50 METRIC TONS / DAY(MT/DAY) = VERMI-COMPOSTING BETWEEN 50 MT & 500 MT / DAY = VERMI-COMPOSTING + MECHANICAL COMPOSTING MORE THAN 500 MT / DAY = MECHANICAL COMPOSTING + REFUSE DERIVED FUEL(RDF) FROM REJECTS KEEPING IN VIEW THE TYPE OF THE CITY (INDUSTRIAL OR NON- INDUSTRIAL) OR BIO-METHANATION
  • 15.
    TENTH PLAN PROPOSALS Requirementof funds as per 10th Plan document for 0.1 million plus towns as per 1991 Census are as under:- Capital Investment = Rs.23226.00 million Equipment replacement = Rs. 1355.00 million cost ________________ Rs.24581.00 million ________________ Based on January, 2000 prices
  • 16.
    INITIATIVES BY GOVERNMENTOF INDIA  Bio-medical Waste Handling Rules, 1998 - Notified  Municipal Solid Waste Management Rules, 2000 – Notified.  Reforms Agenda (Fiscal, Institutional, Legal)  Technical Manual on Municipal Solid Waste Management  Technology Advisory Group on Municipal Solid Waste Management  Inter-Ministerial Task Force on Integrated Plant Nutrient Management from city compost.
  • 17.
    Tax Free Bonds by ULBs permitted by Government of India  Income Tax relief to Waste Management agencies  Public-Private Partnership in SWM  Capacity Building  Urban Reforms Incentive Fund  Guidelines for PSP and setting up of Regulatory Authority  Introduction of Commercial Accounting System in ULBs & other Sector Reforms  Model Municipal Bye-Laws framed / circulated for benefit of ULBs for adoption  Financial Assistance by Government of India - 12th Finance Commission Grants
  • 18.
    DEVOLUTION OF 12THFINANCE COMMISSION GRANTS FOR WASTE MANAGEMENT – RS.2500.00 CRORES ( RS. IN MILLION) (I) COLLECTION AND TRANSPORTATION - 3864.4 EQUIPMENT & MACHINERY (II) COMPOST PLANTS - 10012.3 (III) SANITARY LANDFILL DEVELOPMENT - 10568.8 ------------------- TOTAL 24445.5 ------------------ DEVOLUTION TO ULBs BY 12TH FINANCE - Rs.19439.4 Million COMMISSION PRIVATE SECTOR INVESTMENT - Rs.5006.2 Million ENVISAGED THROUGH PPP IN COMPOSTING / SANITARY LANDFILLING
  • 19.
    NATIONAL URBAN RENEWALMISSION CENTRAL / STATE GRANTS ARE PROPOSED TO BE PROVIDED FOR SOLID WASTE MANAGEMENT Grant Centre State Loan Cities with 4 million plus 35% 15% 50% population Cities with one million plus 50% 20% 30% population but less than 4 million Other cities 80% 10% 10%
  • 20.
    MAIN ISSUES - ABSENCE OF SEGREGATION OF WASTE AT SOURCE - LACK OF TECHNICAL EXPERTISE AND APPROPRIATE INSTITUTIONAL ARRANGEMENT - UNWILLINGNESS OF ULBs TO INTRODUCE PROPER COLLECTION, SEGREGATION, TRANSPORTATION AND TREATMENT / DISPOSAL SYSTEMS - INDIFFERENT ATTITUDE OF CITIZENS TOWARDS WASTE MANAGEMENT DUE TO LACK OF AWARENESS - LACK OF COMMUNITY PARTICIPATION TOWARDS WASTE MANAGEMENT AND HYGIENIC CONDITIONS - LACK OF FUNDS WITH ULBs
  • 21.
    RECOMMENDATIONS - Outsourcing of all activities under Solid Waste Management Services recommended by 12th Finance Commission for using grants - ULBs to concentrate on segregation of waste at source - Waste processing like composting, bio- methanation should be done through public-private partnerships / private sector - Final disposal viz. sanitary landfilling to be done under public private partnerships / private sector - Bio-medical waste to be managed by Central Bio- Medical Waste Management Facilities.