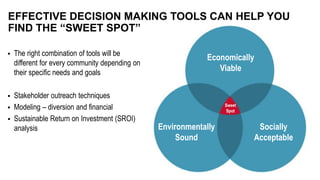
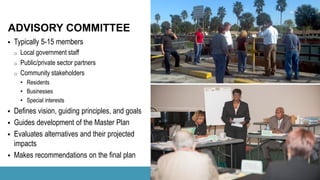
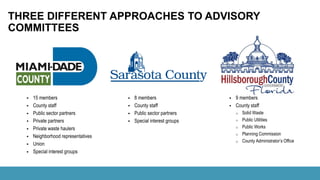
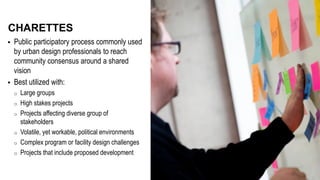
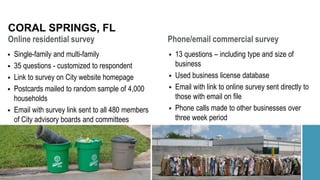
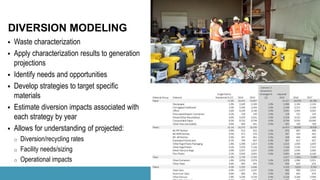
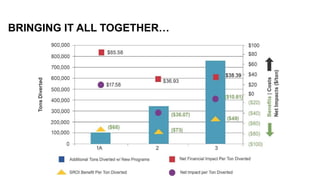
© 2014 HDR, Inc., all rights reserved.
Decisions, Decisions…
SOLID WASTE
MASTER PLANNING
WHAT IS MASTER PLANNING?
EFFECTIVE DECSION MAKING
TOOLS
CONCLUSIONS
WHAT IS MASTER
PLANNING?
 Process by which local governments can:
o Clearly define short and long term goals for
waste management
o Evaluate various alternatives available for
meeting those goals
o Chart a clear path forward
SOLID WASTE MASTER
PLANNING
Finding acceptable balance of
the right services, right price,
and right sustainability goals as
defined by your community
Define the baseline
Develop projections
Needs assessment
Define vision, guiding principles, and goals
Implementation plan
PLANNING PROCESS
1
2
3
4
…
10
EFFECTIVE DECISION
MAKING TOOLS
 The right combination of tools will be
different for every community depending on
their specific needs and goals
 Stakeholder outreach techniques
 Modeling – diversion and financial
 Sustainable Return on Investment (SROI)
analysis
EFFECTIVE DECISION MAKING TOOLS CAN HELP YOU
FIND THE “SWEET SPOT”
Economically
Viable
Environmentally
Sound
Socially
Acceptable
Sweet
Spot
 Advisory committee
 Charettes
 Surveys
 Focus groups
STAKEHOLDER
OUTREACH TECHNIQUES
 Typically 5-15 members
o Local government staff
o Public/private sector partners
o Community stakeholders
• Residents
• Businesses
• Special interests
 Defines vision, guiding principles, and goals
 Guides development of the Master Plan
 Evaluates alternatives and their projected
impacts
 Makes recommendations on the final plan
ADVISORY COMMITTEE
 15 members
 County staff
 Public sector partners
 Private partners
 Private waste haulers
 Neighborhood representatives
 Union
 Special interest groups
THREE DIFFERENT APPROACHES TO ADVISORY
COMMITTEES
 8 members
 County staff
 Public sector partners
 Special interest groups
 9 members
 County staff
o Solid Waste
o Public Utilities
o Public Works
o Planning Commission
o County Administrator’s Office
 Public participatory process commonly used
by urban design professionals to reach
community consensus around a shared
vision
 Best utilized with:
o Large groups
o High stakes projects
o Projects affecting diverse group of
stakeholders
o Volatile, yet workable, political environments
o Complex program or facility design challenges
o Projects that include proposed development
CHARETTES
 Three day charette
o Thursday evening - opening session
o Friday sessions - commercial areas of interest
(143 attendees)
o Saturday sessions - residential areas of
interest (99 attendees)
 Feedback received on what initiatives would
be viable in the County
 Consensus reached on some topics
 Lack of consensus understood on others
 Allowed for realistic goal development
MECKLENBURG COUNTY,
NC
 Way of collecting information that
represents the views of the whole
community or group
 Can be conducted online, by mail, phone,
or in person
 Best utilized for:
o Large numbers of diverse people
o Topics that can be broken down into concise,
easily understandable questions
o Gathering information quickly and efficiently
o Obtaining statistically valid information
SURVEYS
Online residential survey
CORAL SPRINGS, FL
Phone/email commercial survey
 13 questions – including type and size of
business
 Used business license database
 Email with link to online survey sent directly to
those with email on file
 Phone calls made to other businesses over
three week period
 Single-family and multi-family
 35 questions - customized to respondent
 Link to survey on City website homepage
 Postcards mailed to random sample of 4,000
households
 Email with survey link sent to all 480 members
of City advisory boards and committees
 Small-group discussion guided by trained
leader
 Used to learn about opinions on a
designated topic and guide future action
 Best utilized for:
o Specific group on specific topics
o Asking questions that cannot be easily
communicated via survey
o Supplementing knowledge gained from a
survey or other efforts
 Take time to recruit a willing group of
participants
FOCUS GROUPS
 Three focus group meetings
 Participants recruited through community
organizations and City boards/committees
 Introductory meeting
o Current services
o 75% recycling goal
o Strategic Plan and Phase 1 findings
o Expectations for focus groups
o Input on residential and commercial surveys
 Separate meetings - residential and
commercial
o Presented survey results
o Discussed findings, areas of consensus
CORAL SPRINGS, FL
 Waste characterization
 Apply characterization results to generation
projections
 Identify needs and opportunities
 Develop strategies to target specific
materials
 Estimate diversion impacts associated with
each strategy by year
 Allows for understanding of projected:
o Diversion/recycling rates
o Facility needs/sizing
o Operational impacts
DIVERSION MODELING
 Model applied results of recent
characterization studies to waste generation
projections for the next 10 years
 Identified possible diversion strategies
 Examples:
o Automated collection and single stream
o Mixed Waste Material Recovery Facility
o Landfill gas to energy
 Estimated diversion impacts associated
with each strategy by year
 Combined diversion impacts of all short-
listed strategies to estimate recycling rates
SARASOTA COUNTY, FL
 Builds upon the diversion model
 Establish a base case
 Estimate additional costs and cost savings
associated with potential strategies over the
planning period, as compared to the base
case
 Integrating the diversion and financial
models allows us to compare strategies on
a cost per ton diverted basis
FINANCIAL MODELING
 Three very different scenarios under
consideration
o Least cost
o Environmentally preferred
o Most flexible
 Used County’s existing financial model to
project financial operating results out 20
years as the base case
 Evaluated cost impacts associated with a
total of 55 different strategies
 Summarized and compared financial results
for each scenario and presented to SWAC
MIAMI-DADE COUNTY, FL
Net Annual Financial Impact of Environmentally Preferred Scenario
 Sustainable Return on Investment
 Builds upon diversion and financial model
 Measures/monetizes sustainability related
costs and benefits of strategies
 Examples:
o Greenhouse gas emissions
o Energy efficiency
o Water efficiency
o Job creation
o Public health and safety
SROI
Resources Financial Environmental Social
Land / Waste
Mgmt.
7% reduction in revenue;
5% increase in costs
70,000 annual tons of
waste diverted from
landfill
19% reduction in truck
mileage
Energy
Over 300 thousand
gallons of diesel saved
from truck use (20 years)
GHG reduction equal to
removing 43 cars from
road each year
2 fewer annual potential
asthma-related illnesses
People
Over 120 local annual
jobs created from
recycling, processing
Education programs
improve recycling and
local stewardship
364 hours per year of
average congestion time
savings
Materials
(replaced with
recyclables)
Savings in annual energy
use equal to 8.5 thousand
homes
GHG reduction equal to
removing 22 thousand
cars from road each year
Over 500 jobs created
through re-manufacturing
and reuse of recyclables
SROI EXAMPLE - PHYSICAL INDICATORS
*GHG is an abbreviation for greenhouse gas. CAC is an abbreviation for criteria air contaminant. CAC includes
Nitrogen oxides, Sulfur oxides, volatile organic compounds, Particulate matter 2.5 and 10.
Resources Financial Environmental Social
Land / Waste
Mgmt.
$41 million in net
financial costs
Over $0.5 million in
potential savings in
landfill space value
$0.08 million in reduced
truck damage to
pavement
Energy
$0.7 million in reduced
diesel fuel costs to waste
service providers
$0.23 million in GHG*
reduction from reduced
truck hauling
$0.06 million value in
CAC* reduction from
reduced truck hauling
People
$4.3 million of additional
annual income to local
residents
Education programs can
lead to greater recycling
success
$6.83 million in improved
traffic condition and
safety
Materials
(replaced with
recyclables)
$150.2 million reduction
in lifecycle energy costs
$90.1 million in reduced
lifecycle GHG*
$24M per year in income
for new re-manufacturing
and material reuse jobs
Total Environmental and Social Benefits over 20 years ($2016): $ 57.3 million
Total Environmental and Social Benefits per Ton of Diverted Waste ($2016): $113
**Total environmental and social benefits are computed from the cells that are shaded for comparison with financial
outcomes
SROI EXAMPLE - MONETARY INDICATORS
BRINGING IT ALL TOGETHER…
CONCLUSIONS
 A wide variety of planning tools can be
applied to allow local governments to make
better, more informed long-term solid waste
planning decisions
 Every community is different
 Where and how these tools are applied
should be carefully considered
 Match the right decision making tools to the
particular needs and goals of the
community
CONCLUSIONS
© 2014 HDR, Inc., all rights reserved.
Solid Waste Planner
katie.brown@hdrinc.com
512.799.1577
Katie Brown
© 2014 HDR Architecture, Inc., all rights reserved.© 2014 HDR Architecture, Inc., all rights reserved.© 2014 HDR Architecture, Inc., all rights reserved.© 2014 HDR, Inc., all rights reserved.© 2014 HDR, Inc., all rights reserved.© 2014 HDR, Inc., all rights reserved.© 2014 HDR, Inc., all rights reserved.

Solid Waste Master Planning: Decisions, Decisions...

  • 1.
    © 2014 HDR,Inc., all rights reserved. Decisions, Decisions… SOLID WASTE MASTER PLANNING
  • 2.
    WHAT IS MASTERPLANNING? EFFECTIVE DECSION MAKING TOOLS CONCLUSIONS
  • 3.
  • 4.
     Process bywhich local governments can: o Clearly define short and long term goals for waste management o Evaluate various alternatives available for meeting those goals o Chart a clear path forward SOLID WASTE MASTER PLANNING Finding acceptable balance of the right services, right price, and right sustainability goals as defined by your community
  • 5.
    Define the baseline Developprojections Needs assessment Define vision, guiding principles, and goals Implementation plan PLANNING PROCESS 1 2 3 4 … 10
  • 6.
  • 7.
     The rightcombination of tools will be different for every community depending on their specific needs and goals  Stakeholder outreach techniques  Modeling – diversion and financial  Sustainable Return on Investment (SROI) analysis EFFECTIVE DECISION MAKING TOOLS CAN HELP YOU FIND THE “SWEET SPOT” Economically Viable Environmentally Sound Socially Acceptable Sweet Spot
  • 8.
     Advisory committee Charettes  Surveys  Focus groups STAKEHOLDER OUTREACH TECHNIQUES
  • 9.
     Typically 5-15members o Local government staff o Public/private sector partners o Community stakeholders • Residents • Businesses • Special interests  Defines vision, guiding principles, and goals  Guides development of the Master Plan  Evaluates alternatives and their projected impacts  Makes recommendations on the final plan ADVISORY COMMITTEE
  • 10.
     15 members County staff  Public sector partners  Private partners  Private waste haulers  Neighborhood representatives  Union  Special interest groups THREE DIFFERENT APPROACHES TO ADVISORY COMMITTEES  8 members  County staff  Public sector partners  Special interest groups  9 members  County staff o Solid Waste o Public Utilities o Public Works o Planning Commission o County Administrator’s Office
  • 11.
     Public participatoryprocess commonly used by urban design professionals to reach community consensus around a shared vision  Best utilized with: o Large groups o High stakes projects o Projects affecting diverse group of stakeholders o Volatile, yet workable, political environments o Complex program or facility design challenges o Projects that include proposed development CHARETTES
  • 12.
     Three daycharette o Thursday evening - opening session o Friday sessions - commercial areas of interest (143 attendees) o Saturday sessions - residential areas of interest (99 attendees)  Feedback received on what initiatives would be viable in the County  Consensus reached on some topics  Lack of consensus understood on others  Allowed for realistic goal development MECKLENBURG COUNTY, NC
  • 13.
     Way ofcollecting information that represents the views of the whole community or group  Can be conducted online, by mail, phone, or in person  Best utilized for: o Large numbers of diverse people o Topics that can be broken down into concise, easily understandable questions o Gathering information quickly and efficiently o Obtaining statistically valid information SURVEYS
  • 14.
    Online residential survey CORALSPRINGS, FL Phone/email commercial survey  13 questions – including type and size of business  Used business license database  Email with link to online survey sent directly to those with email on file  Phone calls made to other businesses over three week period  Single-family and multi-family  35 questions - customized to respondent  Link to survey on City website homepage  Postcards mailed to random sample of 4,000 households  Email with survey link sent to all 480 members of City advisory boards and committees
  • 15.
     Small-group discussionguided by trained leader  Used to learn about opinions on a designated topic and guide future action  Best utilized for: o Specific group on specific topics o Asking questions that cannot be easily communicated via survey o Supplementing knowledge gained from a survey or other efforts  Take time to recruit a willing group of participants FOCUS GROUPS
  • 16.
     Three focusgroup meetings  Participants recruited through community organizations and City boards/committees  Introductory meeting o Current services o 75% recycling goal o Strategic Plan and Phase 1 findings o Expectations for focus groups o Input on residential and commercial surveys  Separate meetings - residential and commercial o Presented survey results o Discussed findings, areas of consensus CORAL SPRINGS, FL
  • 17.
     Waste characterization Apply characterization results to generation projections  Identify needs and opportunities  Develop strategies to target specific materials  Estimate diversion impacts associated with each strategy by year  Allows for understanding of projected: o Diversion/recycling rates o Facility needs/sizing o Operational impacts DIVERSION MODELING
  • 18.
     Model appliedresults of recent characterization studies to waste generation projections for the next 10 years  Identified possible diversion strategies  Examples: o Automated collection and single stream o Mixed Waste Material Recovery Facility o Landfill gas to energy  Estimated diversion impacts associated with each strategy by year  Combined diversion impacts of all short- listed strategies to estimate recycling rates SARASOTA COUNTY, FL
  • 19.
     Builds uponthe diversion model  Establish a base case  Estimate additional costs and cost savings associated with potential strategies over the planning period, as compared to the base case  Integrating the diversion and financial models allows us to compare strategies on a cost per ton diverted basis FINANCIAL MODELING
  • 20.
     Three verydifferent scenarios under consideration o Least cost o Environmentally preferred o Most flexible  Used County’s existing financial model to project financial operating results out 20 years as the base case  Evaluated cost impacts associated with a total of 55 different strategies  Summarized and compared financial results for each scenario and presented to SWAC MIAMI-DADE COUNTY, FL Net Annual Financial Impact of Environmentally Preferred Scenario
  • 21.
     Sustainable Returnon Investment  Builds upon diversion and financial model  Measures/monetizes sustainability related costs and benefits of strategies  Examples: o Greenhouse gas emissions o Energy efficiency o Water efficiency o Job creation o Public health and safety SROI
  • 22.
    Resources Financial EnvironmentalSocial Land / Waste Mgmt. 7% reduction in revenue; 5% increase in costs 70,000 annual tons of waste diverted from landfill 19% reduction in truck mileage Energy Over 300 thousand gallons of diesel saved from truck use (20 years) GHG reduction equal to removing 43 cars from road each year 2 fewer annual potential asthma-related illnesses People Over 120 local annual jobs created from recycling, processing Education programs improve recycling and local stewardship 364 hours per year of average congestion time savings Materials (replaced with recyclables) Savings in annual energy use equal to 8.5 thousand homes GHG reduction equal to removing 22 thousand cars from road each year Over 500 jobs created through re-manufacturing and reuse of recyclables SROI EXAMPLE - PHYSICAL INDICATORS *GHG is an abbreviation for greenhouse gas. CAC is an abbreviation for criteria air contaminant. CAC includes Nitrogen oxides, Sulfur oxides, volatile organic compounds, Particulate matter 2.5 and 10.
  • 23.
    Resources Financial EnvironmentalSocial Land / Waste Mgmt. $41 million in net financial costs Over $0.5 million in potential savings in landfill space value $0.08 million in reduced truck damage to pavement Energy $0.7 million in reduced diesel fuel costs to waste service providers $0.23 million in GHG* reduction from reduced truck hauling $0.06 million value in CAC* reduction from reduced truck hauling People $4.3 million of additional annual income to local residents Education programs can lead to greater recycling success $6.83 million in improved traffic condition and safety Materials (replaced with recyclables) $150.2 million reduction in lifecycle energy costs $90.1 million in reduced lifecycle GHG* $24M per year in income for new re-manufacturing and material reuse jobs Total Environmental and Social Benefits over 20 years ($2016): $ 57.3 million Total Environmental and Social Benefits per Ton of Diverted Waste ($2016): $113 **Total environmental and social benefits are computed from the cells that are shaded for comparison with financial outcomes SROI EXAMPLE - MONETARY INDICATORS
  • 24.
    BRINGING IT ALLTOGETHER…
  • 25.
  • 26.
     A widevariety of planning tools can be applied to allow local governments to make better, more informed long-term solid waste planning decisions  Every community is different  Where and how these tools are applied should be carefully considered  Match the right decision making tools to the particular needs and goals of the community CONCLUSIONS
  • 27.
    © 2014 HDR,Inc., all rights reserved. Solid Waste Planner katie.brown@hdrinc.com 512.799.1577 Katie Brown
  • 28.
    © 2014 HDRArchitecture, Inc., all rights reserved.© 2014 HDR Architecture, Inc., all rights reserved.© 2014 HDR Architecture, Inc., all rights reserved.© 2014 HDR, Inc., all rights reserved.© 2014 HDR, Inc., all rights reserved.© 2014 HDR, Inc., all rights reserved.© 2014 HDR, Inc., all rights reserved.