Downloaded 41 times
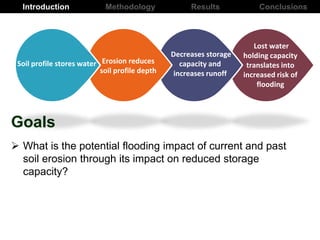
![Introduction Results ConclusionsMethodology
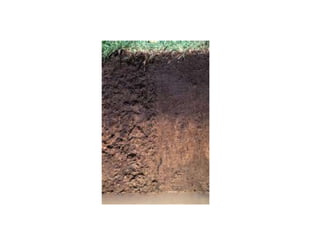
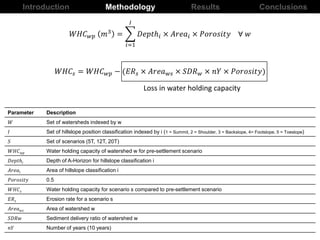
World’s largest sponge
Topmost layer of mineral soil approximately
50% pore space
It is the richest soil horizon and has the
most favorable effects on crop yield
[1]](https://image.slidesharecdn.com/swcssoilerosionandwaterstorage7-31-170816155709/85/Soil-erosion-and-water-storage-5-320.jpg)
![Scenarios and assumptions
Introduction Results ConclusionsMethodology
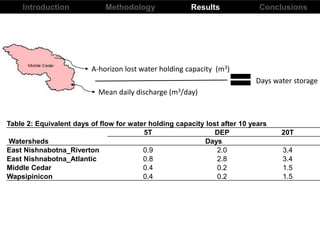
Scenarios Description
5T/A/yr Erosion rate: 5 tons/acre/year (Low)
DEP Erosion rate: From Daily Erosion Project (DEP) [9]
20T/A/yr Erosion rate: 20 tons/acre/year (High)
Scenarios represent range of erosion rates for Iowa landscape to understand the
impact of lost water storage capacity associated with soil erosion.](https://image.slidesharecdn.com/swcssoilerosionandwaterstorage7-31-170816155709/85/Soil-erosion-and-water-storage-8-320.jpg)
![Introduction Results ConclusionsMethodology
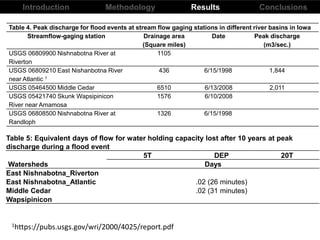
Table 1: Loss in A-horizon water holding capacity after 10 years
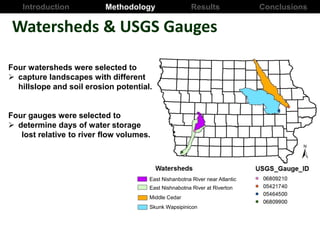
Watersheds
Scenarios
5T (0.85 mm/year) DEP 20T (3.39 mm/year)
Cubic meters
East Nishnabotna_Riverton 1,930,402 4,451,507 7,721,608
East Nishnabotna_Atlantic 863,457 2,851,137 3,453,830
Middle Cedar 5,690,222 3,783,997 22,760,887
Skunk Wapsipinicon 1,381,204 860,490 5,524,814
Erosion rates (tons/acre/year) and depth lost (mm/year) for DEP scenario for
watersheds
East Nishnabotna_Riverton 11.5 (1.95 mm/year)
East Nishnabotna_Atlantic 16.51 (2.80 mm/year)
Middle Cedar 3.33 (0.56 mm/year)
Skunk Wapsipinicon 3.12 (0.53 mm/year)
Scenarios Description
5T Erosion rate: 5 tons/acre/year (Low)
DEP Erosion rate: From Daily Erosion Project (DEP) [9]
20T Erosion rate: 20 tons/acre/year (High)](https://image.slidesharecdn.com/swcssoilerosionandwaterstorage7-31-170816155709/85/Soil-erosion-and-water-storage-11-320.jpg)


The document summarizes a study on the impacts of soil erosion on flooding in Iowa watersheds. The researchers found that: 1) Soil erosion over the past 200 years has reduced Iowa's water storage capacity in cropland topsoil by 1/3, at a rate 10 times faster than topsoil formation. 2) Modeling different erosion scenarios showed losses in available water storage from the A-horizon soil layer of hundreds of thousands to tens of millions of cubic meters across four Iowa watersheds over 10 years. 3) These water storage losses equate to fractions of days to a few days of average daily river discharge, and minutes to tenths of days of peak flood discharge.


