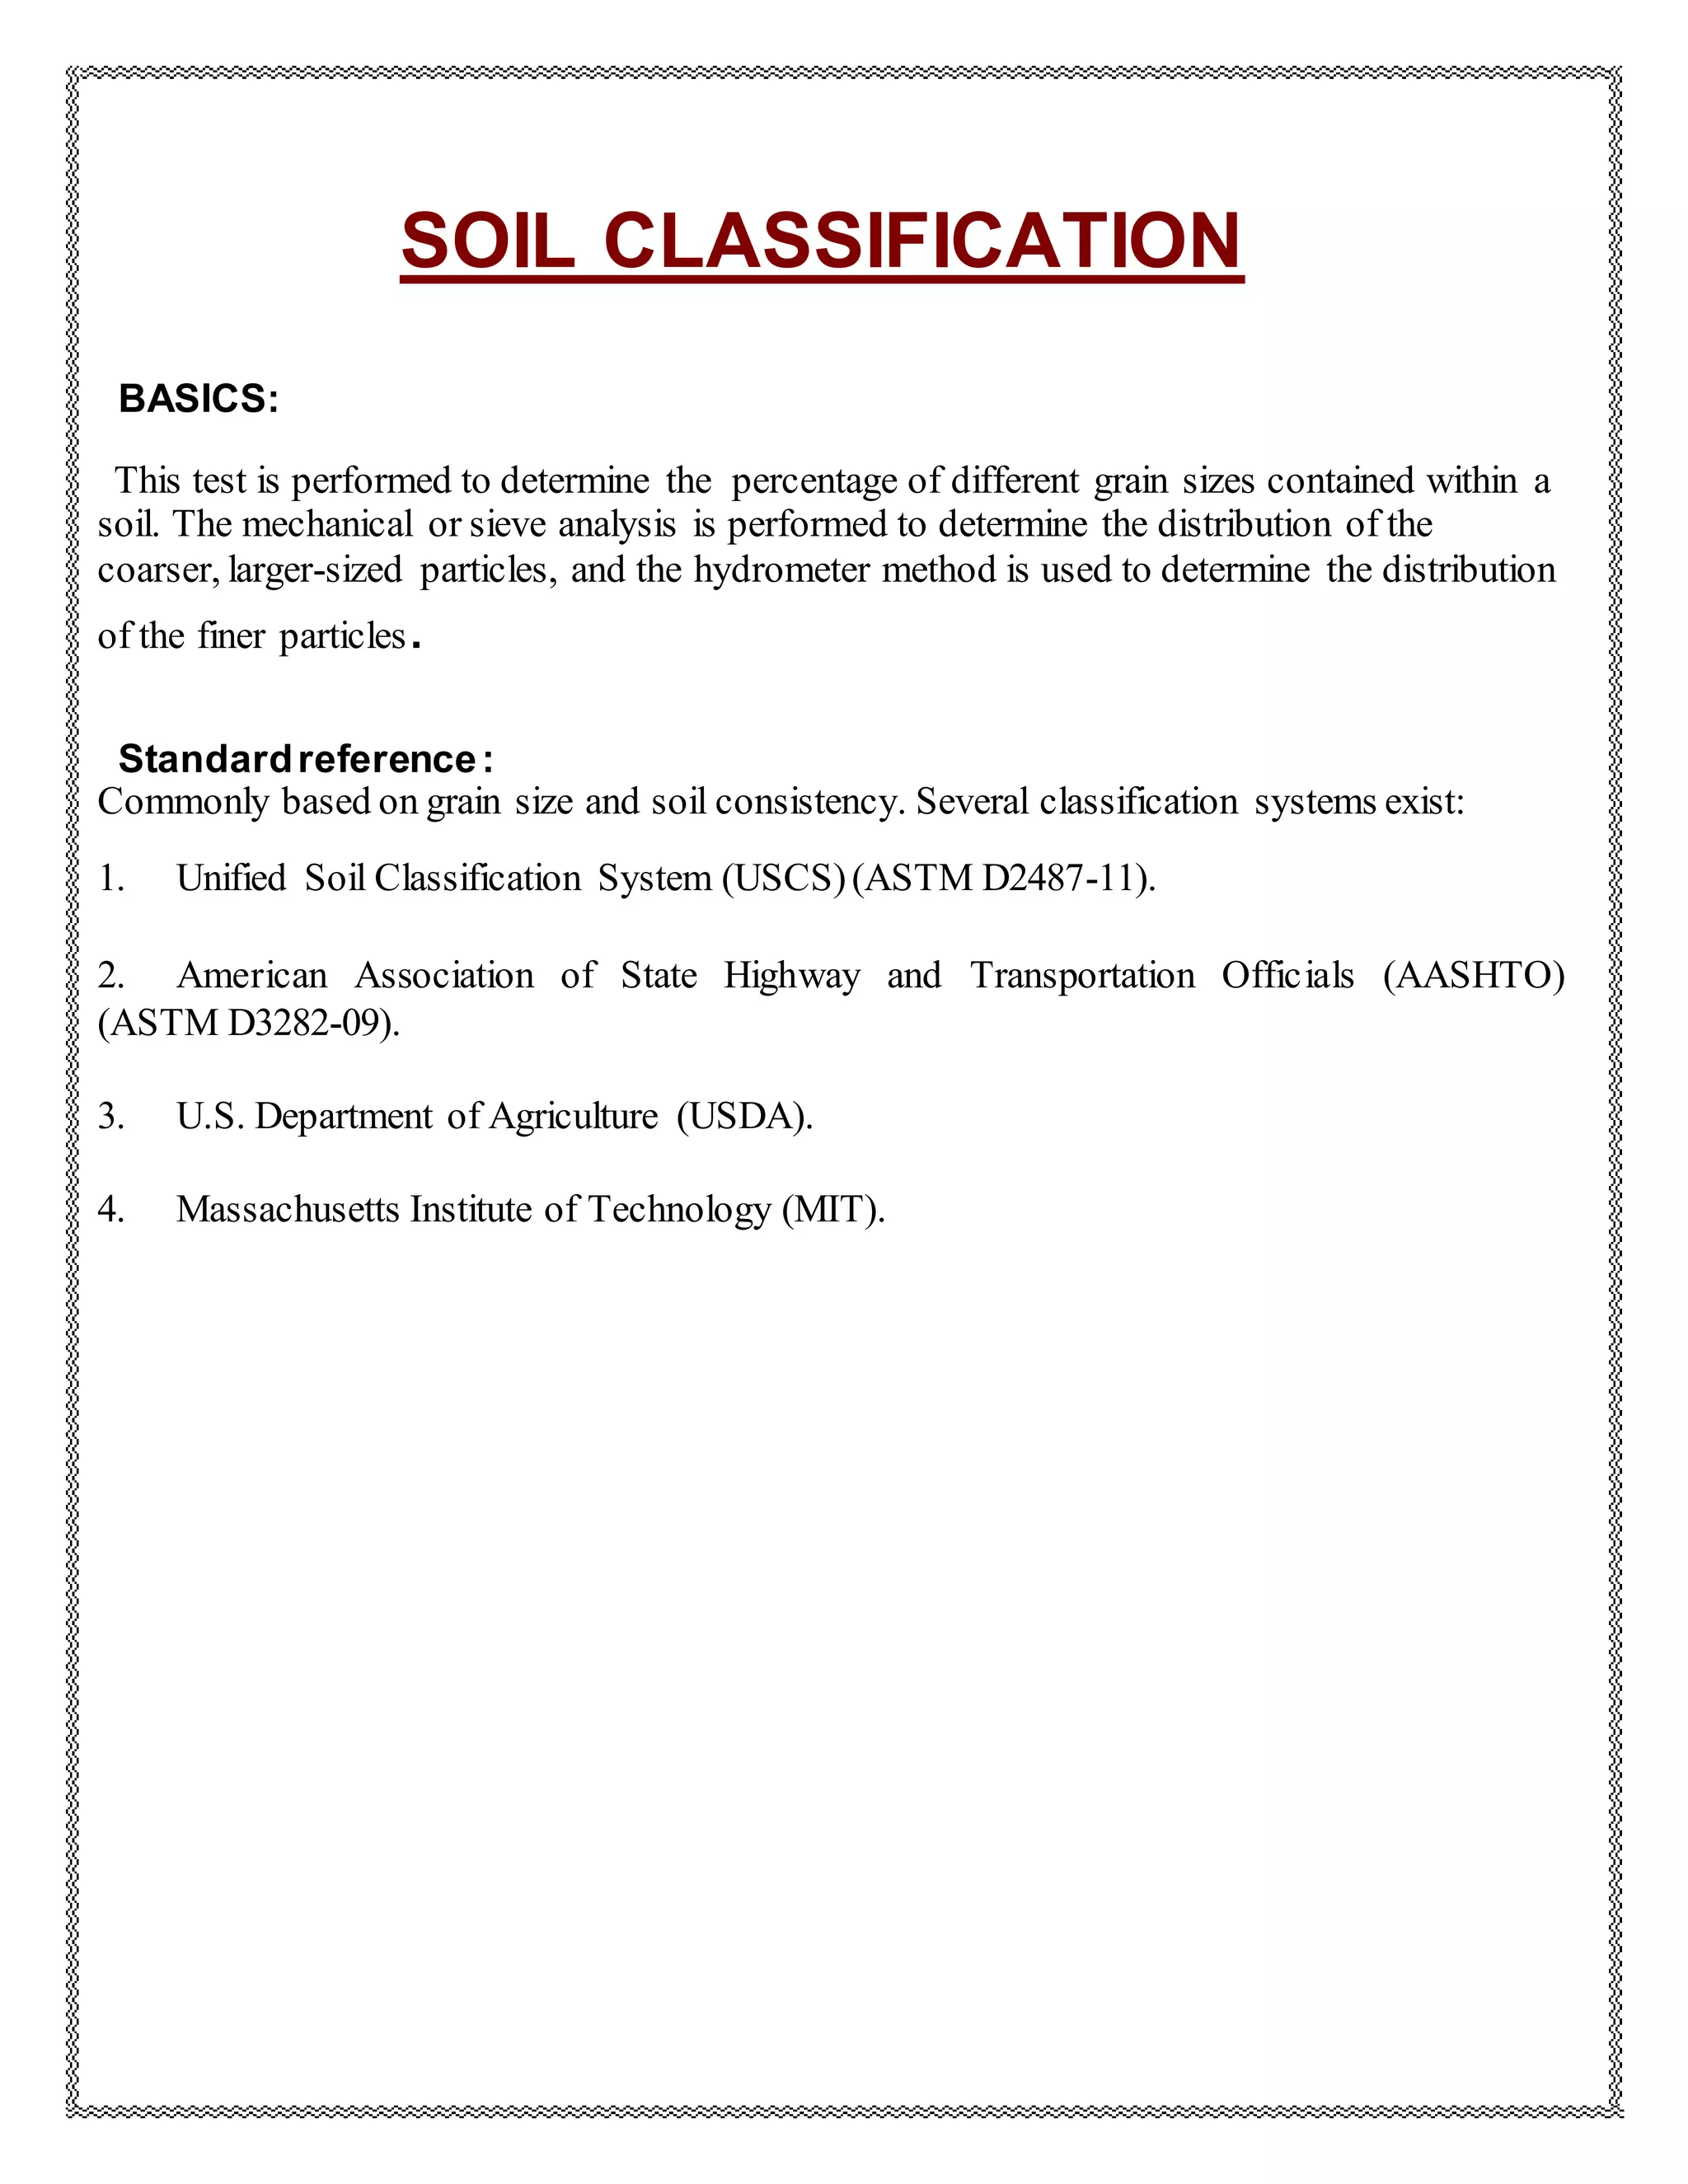
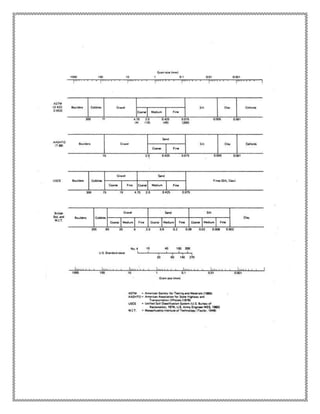
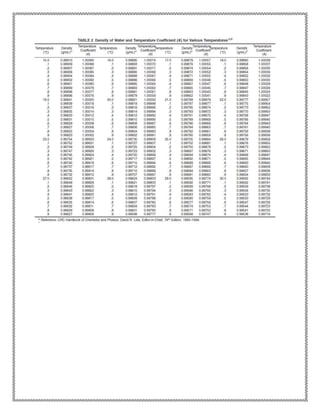
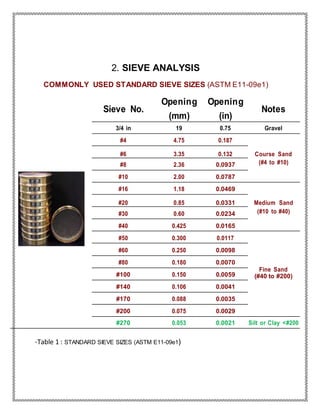
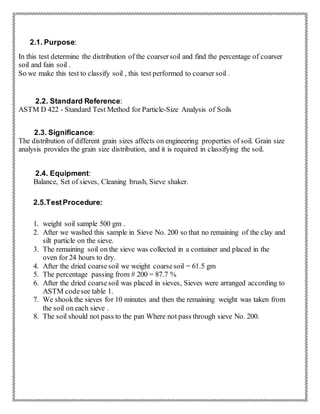
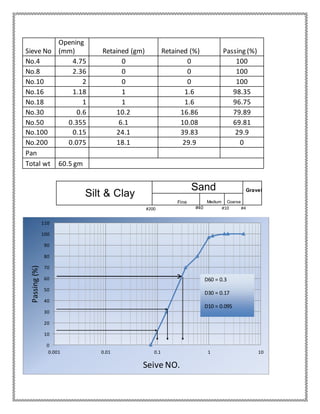
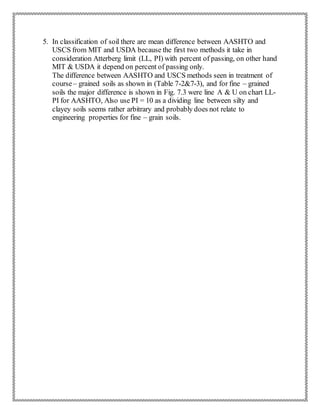
This document provides information on procedures for determining soil classification parameters through laboratory tests. It describes the liquid limit test, plastic limit test, and sieve analysis test. The liquid limit test determines the water content at which a soil behaves as a liquid. The plastic limit test finds the water content where a soil rod crumbles. Sieve analysis involves separating soil into grain sizes to determine classifications. The results of these tests are used to classify soils based on standards like the Unified Soil Classification System.
![𝑃𝐿 =
𝑀1 − 𝑀2
𝑀2 − 𝑀𝑐
× 100
𝐿𝐿 =
𝑀1 − 𝑀2
𝑀2 − 𝑀𝑐
× 100
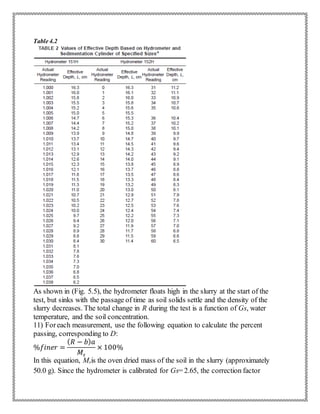
𝑃𝐼 = 𝐿𝐿 − 𝑃𝐿
Liquid Limit by METHOD B:
N = 28, W = 36.7 %, tan β = (0.121 ASTM), (0.092 BS)
k = 1.014 (from Table 2-1)
𝐿𝐿 𝑛
= 𝑤 𝑛
(
𝑁
25
)
tan 𝛽
= 36.7(
28
25
)
0.121
= 37.2%,
𝑜𝑟 = 40.22(
27
25
)
0.092
= 37.08%
𝐿𝐿 𝑛
= 𝑘. 𝑤 𝑛
= 1.009 × 40.22 = 37.21%
0
10
20
30
40
50
5 50
Watercontent[%]
Nr. of Blows
LL Expon. (LL)](https://image.slidesharecdn.com/random-171022091454/85/soil-classification-lab-19-320.jpg)
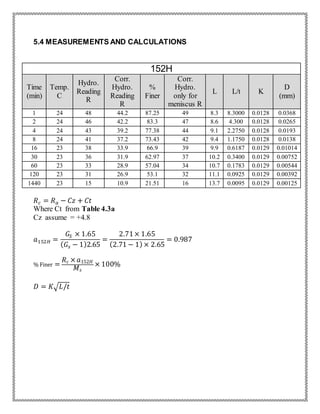
![𝑅 𝑐 = 𝑅 𝑎 − 0.001∗ 𝑇
𝑎151𝐻 =
𝐺𝑆
( 𝐺𝑠 − 1)
=
2.71
(2.71 − 1)
= 1.59
% Finer =
100000∗𝑎151𝐻
𝑀 𝑠
× (𝑅𝑐−1 )……….. eq1 in ASTM D 422 – 63
L = L1 + 1 / 2 [L2 - VB/A] ……………eq5in ASTM D 422 – 63
L = effective depth, cm,
L1 = distance along the stem of the hydrometer from the top of the bulb to
the mark for a hydrometer reading,cm,
L 2 = overall length of the hydrometer bulb,cm,
VB = volume of hydrometer bulb,cm3, and
A = cross-sectional area ofsedimentation cylinder,cm2
Values used in calculating the values in Table 2 are as follows:
For both hydrometers,151H and 152H:
L2 = 14.0 cm
VB = 67.0 cm3
A = 27.8 cm2
For hydrometer 151H:
L1 = 10.5 cm for a reading of1.000
= 2.3 cm for a reading of 1.031
L1 =10.5 - n * 0.264516129032258 # n =( Rm – 1) *1000
𝐷 = 𝐾√ 𝐿/𝑡
151H
Time
(min)
Temp.
C
Hydro.
Reading
R
Corr.
Hydro.
Reading
Rc
%
Finer
Corr.
Hydro.
only for
meniscus
Rm
L L/t K
D
(mm)
1 24 1.044 1.0416 132.2 1.045 4.4 4.4 0.0128 0.02684
2 24 1.040 1.0376 119.56 1.041 5.44 2.72 0.0128 0.02111
4 24 1.039 1.0366 116.38 1.040 5.7 1.425 0.0128 0.01527
8 24 1.037 1.0346 110.02 1.038 6.2 0.775 0.0128 0.01126
15 23 1.036 1.0337 107.16 1.037 6.5 0.433 0.0129 0.00848
30 23 1.031 1.0287 91.266 1.032 7.8 0.26 0.0129 0.00657
60 23 1.028 1.0257 81.726 1.029 8.6 0.1433 0.0129 0.00488
120 23 1.027 1.0247 78.546 1.028 8.9 0.0741 0.0129 0.00351
1440 23 1.014 1.0117 37.206 1.015 12.3 0.0085 0.0129 0.00118](https://image.slidesharecdn.com/random-171022091454/85/soil-classification-lab-31-320.jpg)
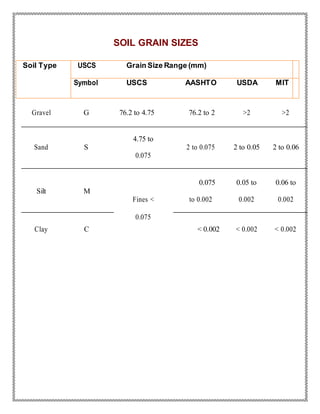
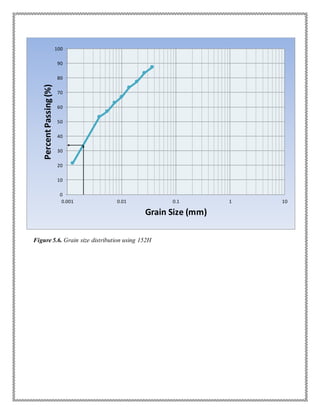
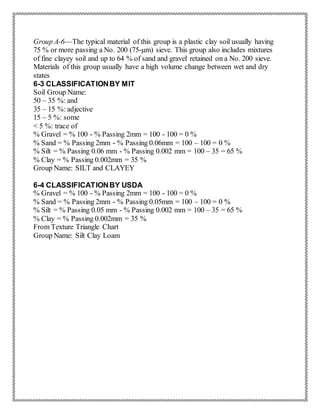
![6. CLASSIFICATION OF SOIL
6-1 CLASSIFICATIONBY USCS
6-1-1APPLICABLE STANDARDS
ASTM D2487: Standard Practice for Classificationof Soils for Engineering
Purposes (Unified Soil ClassificationSystem).
Percent of Passing sieve #200 = [(500-61.5)/500]x100 = 87.7% > 50%
Classified as fine grained soil
Liquid Limit = 37 %
Plastic Limit = 15.45 %
Plastic Index = 21.05%
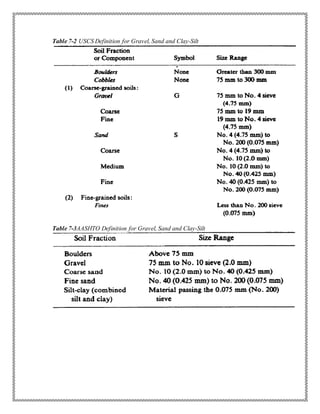
From Plasticity Chart CL (Clay low plasticity ) (Fig 6.1)
Percent Remains on sieve #200 = 100-87.7=12.3% < 30%
Percent Remains on sieve #200 = 12.3% < 15%
Group Name: Lean Clay (Fig 6.2)
Fig 6.1
0
10
20
30
40
50
60
0 10 20 30 40 50 60 70 80 90 100
PlasticityIndex(PI)
Liquid Limit (LL or wL)
ML
MH
CL
CH
A Line
CL-ML](https://image.slidesharecdn.com/random-171022091454/85/soil-classification-lab-33-320.jpg)
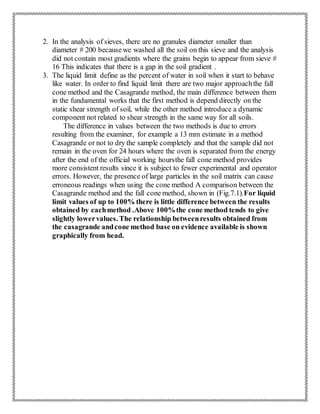
![Fig 6.2
6-2 CLASSIFICATIONBY AASHTO
6-2-1APPLICABLE STANDARDS
AASHTO M145-91(2003) Standard Specificationsfor Classification of
Soils and Soil-AggregateMixtures for HighwayConstruction Purposes.
ASTM D3282-09 StandardPractice for Classification of Soils and Soil-
AggregateMixtures for HighwayConstruction Purposes.
Percent of Passing sieve #200 (F200) = 87.7% > 36%
Classified as fine grained soil
Liquid Limit = 37 %< 40%
Plastic Limit = 15.45 %
Plastic Index = 21.05%> 11%
Percent of Passing sieve #200 = 87.7 > 30
The soil Group Name A-6
Group Index : G1
𝐺𝐼 = ( 𝐹200 − 36)[0.2 + 0.005( 𝐿𝐿 − 40)]+ 0.1(𝐹200 − 15)(𝑃𝐼 − 10)](https://image.slidesharecdn.com/random-171022091454/85/soil-classification-lab-34-320.jpg)
![𝐺𝐼 = (87.7− 36)[0.2+ 0.005(37− 40)]+ 0.1(87.7 − 15)(21.05− 10)
𝐺𝐼 = 79.953 ≈ 80
Group Name: A-6(80)](https://image.slidesharecdn.com/random-171022091454/85/soil-classification-lab-35-320.jpg)
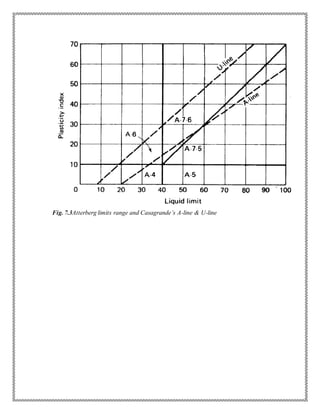


![Geotechnical Engineering-I [Lec #8: Hydrometer Analysis]](https://cdn.slidesharecdn.com/ss_thumbnails/8-180923180849-thumbnail.jpg?width=640&height=640&fit=bounds)