SlideShare a Scribd company logo
1 of 7
Descriptive StatisticsNameQNT/561
Date
Instructor’s Name
SHORT TITLE OF PAPER
1
Running head: DESCRIPTIVE STATISTICS
1
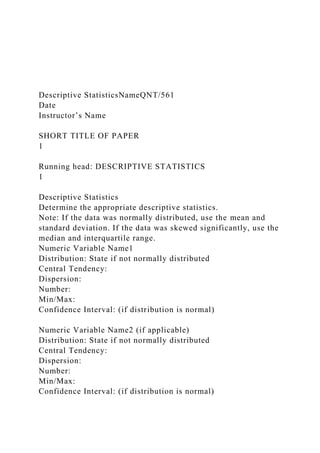
Descriptive Statistics
Determine the appropriate descriptive statistics.
Note: If the data was normally distributed, use the mean and
standard deviation. If the data was skewed significantly, use the
median and interquartile range.
Numeric Variable Name1
Distribution: State if not normally distributed
Central Tendency:
Dispersion:
Number:
Min/Max:
Confidence Interval: (if distribution is normal)
Numeric Variable Name2 (if applicable)
Distribution: State if not normally distributed
Central Tendency:
Dispersion:
Number:
Min/Max:
Confidence Interval: (if distribution is normal)
Attribute Variable Name (if applicable)
Create a bar chart. Describe the proportions.
Descriptive Statistics Interpretation
Numeric Variable Name1
Describe the variable in laymen terms.
Numeric Variable Name2 (if applicable)
Describe the variable in laymen terms.
DESCRIPTIVE STATISTICS
2
Appendix A
Raw data used in the analysis
Fit data to one page.
Appendix B
Charts and Tables
This part of the paper will include items that are then cited in
the body of the paper. Usually, large items are placed here not
to distract from reading the paper.
Appendix C
Descriptive Statistics
This part of the paper will include descriptive statistics.
Create a Microsoft® Excel® spreadsheet with the two variables
from your learning team's dataset.
Analyze the data with MegaStat®, StatCrunch®,
Microsoft® Excel®or other statistical tool(s), including:
(a) Descriptive stats for each numeric variable
(b) Histogram for each numeric variable
(c) Bar chart for each attribute (non numeric) variable
(d) Scatter plot if the data contains two numeric variables
Determine the appropriate descriptive statistics.
(a) For normally distributed data use the mean and standard
deviation.
(b) For significantly skewed data use the median and
interquartile range.
Use the Individual Methodology Findings Template to complete
the descriptive statistics.
Use the Descriptive Statistics and Interpretation Example to
develop an interpretation of the descriptive statistics.
Format your paper consistent with APA guidelines.
Submit both the spreadsheet and the completed Individual
Methodology Findings Template.
Click the Assignment Files tab to submit your assignment.
Please use the variables from this except:
The size of this population is 20 suppliers. These suppliers
exclusively produce and make available for sale the material
that is needed for manufacturing. In order to develop the
sampling design it is important to identify the independent and
dependent variables. Independent variables are variables that
are manipulated or treated in a study in order to see what effect
differences in them will have on those variables proposed as
being dependent on them (Riyami, 2008). The independent
variable in this research is the cost of the raw material.
Dependent variables are variables in which changes are results
of the level or amount of the independent variable (Riyami,
2008). The dependent variable in this research is the availability
of the raw material based on the price change as it relates to
consumption.
Descriptive Statistics and Interpretation Example
QNT/561 Version 7
1
University of Phoenix Material
Descriptive Statistics and Interpretation Example
Interpretation Phrases
Central Tendency:
Mean = average of a set of data
Median = half or equal number of data is above and half or
equal number of data is below. It is a midpoint in an ordered
(sorted) set of data, a physical location
Mode = most frequent value in a set of data
Dispersion:
Standard deviation = variation
Interquartile range (IQR) = the middle 50% of the data
Range = the difference between the largest and smallest value
of the data
Confidence Interval: (data must be normal)
There is 95% confidence that the population average is between
_____ and ____ units.
Normal or significantly skewed data:
MegaStat: Descriptive statistics Normal curve goodness of fit p-
value
· Normal, p-value > .05
· Significantly Skewed, p-value < .05
Histogram: Eyeball the histogram.
· Normal data will have a symmetrical or slightly skewed shape.
· Significantly Skewed shape will have extreme skewness
Use phrase combinations: Normally distributed: Mean and
Standard Deviation, Not normally distributed: Median and IQR
Descriptive Statistics
Body Weight (Lbs.)
Central Tendency:
Mean = 149 Lbs.
Dispersion:
Standard deviation = 30 Lbs.
Count:
100
Min/Max:
99 pounds and 234 Lbs.
Confidence Interval:
144 to 155 Lbs.
See the histogram in Appendix A, and descriptive statistics in
Appendix B.
Age
Distribution is not normally distributed
Central Tendency:
Median = 36 years
Dispersion:
Interquartile Range = 20.5 years / 2 = ± 10 years
Count:
100
Min/Max:
18 years and 74 years
Confidence Interval:
Not applicable (data is not normally distributed)
See the histogram in Appendix A, and descriptive statistics in
Appendix B. A scatter plot is in Appendix C.
Education Level
Thirteen percent of the subjects have no high school degree
while 44% have high school degree. Forty three percent have a
college or college graduate degree. See the bar chart in
Appendix D.
Descriptive Statistics Interpretation
Interpretation
Body Weight
One hundred subjects were randomly selected. Their body
weight was observed between 99 and 234 pounds. Their average
weight was 149 pounds, with a variation of plus or minus 30
pounds. One half or more were above 149 pounds. There is 95%
confidence that the population body weight average is between
144 and 155 pounds.
Age
The data was significantly skewed. One hundred subjects
were randomly selected. Their ages were between 18 and 74
years, with a variation of plus or minus 10 years. One half or
more subjects were 36 years of age or older. The middle half of
the subjects’ ages fell between 27 and 47 years. The most
frequent age was 36 years.
APPENDIX A
Body Weight and Age Histograms
APPENDIX B
Descriptive Statistics Body Weight and Age
APPENDIX C
Scatterplot Body Age versus Weight
APPENDIX D
Bar Chart Education Level
Copyright © 2014 by University of Phoenix. All rights reserved.

More Related Content

Similar to Descriptive StatisticsNameQNT561DateInstructor’s Name.docx

Descriptive Statistics and Interpretation ExampleQNT561 Versi.docx
Descriptive Statistics and Interpretation ExampleQNT561 Versi.docxDescriptive Statistics and Interpretation ExampleQNT561 Versi.docx
Descriptive Statistics and Interpretation ExampleQNT561 Versi.docxsimonithomas47935
 
Assessment instructions 2020.docx
Assessment instructions 2020.docxAssessment instructions 2020.docx
Assessment instructions 2020.docxwarisha22
 
Data analysis powerpoint
Data analysis powerpointData analysis powerpoint
Data analysis powerpointjamiebrandon
 
Statistics as a discipline
Statistics as a disciplineStatistics as a discipline
Statistics as a disciplineRosalinaTPayumo
 
BIOSTATISTICS FUNDAMENTALS FOR BIOTECHNOLOGY
BIOSTATISTICS FUNDAMENTALS FOR BIOTECHNOLOGYBIOSTATISTICS FUNDAMENTALS FOR BIOTECHNOLOGY
BIOSTATISTICS FUNDAMENTALS FOR BIOTECHNOLOGYGauravBoruah
 
Statistics (GE 4 CLASS).pptx
Statistics (GE 4 CLASS).pptxStatistics (GE 4 CLASS).pptx
Statistics (GE 4 CLASS).pptxYollyCalamba
 
3.2 measures of variation
3.2 measures of variation3.2 measures of variation
3.2 measures of variationleblance
 
Statistics  What you Need to KnowIntroductionOften, when peop.docx
Statistics  What you Need to KnowIntroductionOften, when peop.docxStatistics  What you Need to KnowIntroductionOften, when peop.docx
Statistics  What you Need to KnowIntroductionOften, when peop.docxdessiechisomjj4
 
Statistics for IB Biology
Statistics for IB BiologyStatistics for IB Biology
Statistics for IB BiologyEran Earland
 
Biostatistics clinical research & trials
Biostatistics clinical research & trialsBiostatistics clinical research & trials
Biostatistics clinical research & trialseclinicaltools
 
Introduction to statistics in health care
Introduction to statistics in health care Introduction to statistics in health care
Introduction to statistics in health care Dhasarathi Kumar
 
Medical Statistics.ppt
Medical Statistics.pptMedical Statistics.ppt
Medical Statistics.pptssuserf0d95a
 
Tools and Techniques - Statistics: descriptive statistics
Tools and Techniques - Statistics: descriptive statistics Tools and Techniques - Statistics: descriptive statistics
Tools and Techniques - Statistics: descriptive statistics Ramachandra Barik
 
Statistics and types of statistics .docx
Statistics and types of statistics .docxStatistics and types of statistics .docx
Statistics and types of statistics .docxHwre Idrees
 

Similar to Descriptive StatisticsNameQNT561DateInstructor’s Name.docx (20)

Descriptive Statistics and Interpretation ExampleQNT561 Versi.docx
Descriptive Statistics and Interpretation ExampleQNT561 Versi.docxDescriptive Statistics and Interpretation ExampleQNT561 Versi.docx
Descriptive Statistics and Interpretation ExampleQNT561 Versi.docx
 
Assessment instructions 2020.docx
Assessment instructions 2020.docxAssessment instructions 2020.docx
Assessment instructions 2020.docx
 
Lesson 1 07 measures of variation
Lesson 1 07 measures of variationLesson 1 07 measures of variation
Lesson 1 07 measures of variation
 
Data analysis powerpoint
Data analysis powerpointData analysis powerpoint
Data analysis powerpoint
 
Statistics as a discipline
Statistics as a disciplineStatistics as a discipline
Statistics as a discipline
 
Descriptive Analysis.pptx
Descriptive Analysis.pptxDescriptive Analysis.pptx
Descriptive Analysis.pptx
 
BIOSTATISTICS FUNDAMENTALS FOR BIOTECHNOLOGY
BIOSTATISTICS FUNDAMENTALS FOR BIOTECHNOLOGYBIOSTATISTICS FUNDAMENTALS FOR BIOTECHNOLOGY
BIOSTATISTICS FUNDAMENTALS FOR BIOTECHNOLOGY
 
Statistics (GE 4 CLASS).pptx
Statistics (GE 4 CLASS).pptxStatistics (GE 4 CLASS).pptx
Statistics (GE 4 CLASS).pptx
 
3.2 measures of variation
3.2 measures of variation3.2 measures of variation
3.2 measures of variation
 
Statistics  What you Need to KnowIntroductionOften, when peop.docx
Statistics  What you Need to KnowIntroductionOften, when peop.docxStatistics  What you Need to KnowIntroductionOften, when peop.docx
Statistics  What you Need to KnowIntroductionOften, when peop.docx
 
Statistics for IB Biology
Statistics for IB BiologyStatistics for IB Biology
Statistics for IB Biology
 
Biostatics ppt
Biostatics pptBiostatics ppt
Biostatics ppt
 
Biostatistics clinical research & trials
Biostatistics clinical research & trialsBiostatistics clinical research & trials
Biostatistics clinical research & trials
 
Introduction to statistics in health care
Introduction to statistics in health care Introduction to statistics in health care
Introduction to statistics in health care
 
Medical Statistics.ppt
Medical Statistics.pptMedical Statistics.ppt
Medical Statistics.ppt
 
Introduction to Descriptive Statistics
Introduction to Descriptive StatisticsIntroduction to Descriptive Statistics
Introduction to Descriptive Statistics
 
Tools and Techniques - Statistics: descriptive statistics
Tools and Techniques - Statistics: descriptive statistics Tools and Techniques - Statistics: descriptive statistics
Tools and Techniques - Statistics: descriptive statistics
 
Statistics and types of statistics .docx
Statistics and types of statistics .docxStatistics and types of statistics .docx
Statistics and types of statistics .docx
 
Presentation1
Presentation1Presentation1
Presentation1
 
Univariate Analysis
Univariate AnalysisUnivariate Analysis
Univariate Analysis
 

More from theodorelove43763

Exam Questions1. (Mandatory) Assess the strengths and weaknesse.docx
Exam Questions1. (Mandatory) Assess the strengths and weaknesse.docxExam Questions1. (Mandatory) Assess the strengths and weaknesse.docx
Exam Questions1. (Mandatory) Assess the strengths and weaknesse.docxtheodorelove43763
 
Evolving Leadership roles in HIM1. Increased adoption of hea.docx
Evolving Leadership roles in HIM1. Increased adoption of hea.docxEvolving Leadership roles in HIM1. Increased adoption of hea.docx
Evolving Leadership roles in HIM1. Increased adoption of hea.docxtheodorelove43763
 
exam 2 logiWhatsApp Image 2020-01-18 at 1.01.20 AM (1).jpeg.docx
exam 2 logiWhatsApp Image 2020-01-18 at 1.01.20 AM (1).jpeg.docxexam 2 logiWhatsApp Image 2020-01-18 at 1.01.20 AM (1).jpeg.docx
exam 2 logiWhatsApp Image 2020-01-18 at 1.01.20 AM (1).jpeg.docxtheodorelove43763
 
Evolution of Terrorism300wrdDo you think terrorism has bee.docx
Evolution of Terrorism300wrdDo you think terrorism has bee.docxEvolution of Terrorism300wrdDo you think terrorism has bee.docx
Evolution of Terrorism300wrdDo you think terrorism has bee.docxtheodorelove43763
 
Evidence-based practice is an approach to health care where health c.docx
Evidence-based practice is an approach to health care where health c.docxEvidence-based practice is an approach to health care where health c.docx
Evidence-based practice is an approach to health care where health c.docxtheodorelove43763
 
Evidence-Based EvaluationEvidence-based practice is importan.docx
Evidence-Based EvaluationEvidence-based practice is importan.docxEvidence-Based EvaluationEvidence-based practice is importan.docx
Evidence-Based EvaluationEvidence-based practice is importan.docxtheodorelove43763
 
Evidence TableStudy CitationDesignMethodSampleData C.docx
Evidence TableStudy CitationDesignMethodSampleData C.docxEvidence TableStudy CitationDesignMethodSampleData C.docx
Evidence TableStudy CitationDesignMethodSampleData C.docxtheodorelove43763
 
Evidence SynthesisCritique the below evidence synthesis ex.docx
Evidence SynthesisCritique the below evidence synthesis ex.docxEvidence SynthesisCritique the below evidence synthesis ex.docx
Evidence SynthesisCritique the below evidence synthesis ex.docxtheodorelove43763
 
Evidence Collection PolicyScenarioAfter the recent secur.docx
Evidence Collection PolicyScenarioAfter the recent secur.docxEvidence Collection PolicyScenarioAfter the recent secur.docx
Evidence Collection PolicyScenarioAfter the recent secur.docxtheodorelove43763
 
Everyone Why would companies have quality programs even though they.docx
Everyone Why would companies have quality programs even though they.docxEveryone Why would companies have quality programs even though they.docx
Everyone Why would companies have quality programs even though they.docxtheodorelove43763
 
Even though technology has shifted HRM to strategic partner, has thi.docx
Even though technology has shifted HRM to strategic partner, has thi.docxEven though technology has shifted HRM to strategic partner, has thi.docx
Even though technology has shifted HRM to strategic partner, has thi.docxtheodorelove43763
 
Even though people are aware that earthquakes and volcanoes typi.docx
Even though people are aware that earthquakes and volcanoes typi.docxEven though people are aware that earthquakes and volcanoes typi.docx
Even though people are aware that earthquakes and volcanoes typi.docxtheodorelove43763
 
Evaluative Essay 2 Grading RubricCriteriaLevels of Achievement.docx
Evaluative Essay 2 Grading RubricCriteriaLevels of Achievement.docxEvaluative Essay 2 Grading RubricCriteriaLevels of Achievement.docx
Evaluative Essay 2 Grading RubricCriteriaLevels of Achievement.docxtheodorelove43763
 
Evaluation Title Research DesignFor this first assignment, .docx
Evaluation Title Research DesignFor this first assignment, .docxEvaluation Title Research DesignFor this first assignment, .docx
Evaluation Title Research DesignFor this first assignment, .docxtheodorelove43763
 
Evaluation is the set of processes and methods that managers and sta.docx
Evaluation is the set of processes and methods that managers and sta.docxEvaluation is the set of processes and methods that managers and sta.docx
Evaluation is the set of processes and methods that managers and sta.docxtheodorelove43763
 
Evaluation Plan with Policy RecommendationAfter a program ha.docx
Evaluation Plan with Policy RecommendationAfter a program ha.docxEvaluation Plan with Policy RecommendationAfter a program ha.docx
Evaluation Plan with Policy RecommendationAfter a program ha.docxtheodorelove43763
 
Evaluating 19-Channel Z-score Neurofeedback Addressi.docx
Evaluating 19-Channel Z-score Neurofeedback  Addressi.docxEvaluating 19-Channel Z-score Neurofeedback  Addressi.docx
Evaluating 19-Channel Z-score Neurofeedback Addressi.docxtheodorelove43763
 
Evaluate the history of the Data Encryption Standard (DES) and then .docx
Evaluate the history of the Data Encryption Standard (DES) and then .docxEvaluate the history of the Data Encryption Standard (DES) and then .docx
Evaluate the history of the Data Encryption Standard (DES) and then .docxtheodorelove43763
 
Evaluate the Health History and Medical Information for Mrs. J.,.docx
Evaluate the Health History and Medical Information for Mrs. J.,.docxEvaluate the Health History and Medical Information for Mrs. J.,.docx
Evaluate the Health History and Medical Information for Mrs. J.,.docxtheodorelove43763
 
Evaluate the environmental factors that contribute to corporate mana.docx
Evaluate the environmental factors that contribute to corporate mana.docxEvaluate the environmental factors that contribute to corporate mana.docx
Evaluate the environmental factors that contribute to corporate mana.docxtheodorelove43763
 

More from theodorelove43763 (20)

Exam Questions1. (Mandatory) Assess the strengths and weaknesse.docx
Exam Questions1. (Mandatory) Assess the strengths and weaknesse.docxExam Questions1. (Mandatory) Assess the strengths and weaknesse.docx
Exam Questions1. (Mandatory) Assess the strengths and weaknesse.docx
 
Evolving Leadership roles in HIM1. Increased adoption of hea.docx
Evolving Leadership roles in HIM1. Increased adoption of hea.docxEvolving Leadership roles in HIM1. Increased adoption of hea.docx
Evolving Leadership roles in HIM1. Increased adoption of hea.docx
 
exam 2 logiWhatsApp Image 2020-01-18 at 1.01.20 AM (1).jpeg.docx
exam 2 logiWhatsApp Image 2020-01-18 at 1.01.20 AM (1).jpeg.docxexam 2 logiWhatsApp Image 2020-01-18 at 1.01.20 AM (1).jpeg.docx
exam 2 logiWhatsApp Image 2020-01-18 at 1.01.20 AM (1).jpeg.docx
 
Evolution of Terrorism300wrdDo you think terrorism has bee.docx
Evolution of Terrorism300wrdDo you think terrorism has bee.docxEvolution of Terrorism300wrdDo you think terrorism has bee.docx
Evolution of Terrorism300wrdDo you think terrorism has bee.docx
 
Evidence-based practice is an approach to health care where health c.docx
Evidence-based practice is an approach to health care where health c.docxEvidence-based practice is an approach to health care where health c.docx
Evidence-based practice is an approach to health care where health c.docx
 
Evidence-Based EvaluationEvidence-based practice is importan.docx
Evidence-Based EvaluationEvidence-based practice is importan.docxEvidence-Based EvaluationEvidence-based practice is importan.docx
Evidence-Based EvaluationEvidence-based practice is importan.docx
 
Evidence TableStudy CitationDesignMethodSampleData C.docx
Evidence TableStudy CitationDesignMethodSampleData C.docxEvidence TableStudy CitationDesignMethodSampleData C.docx
Evidence TableStudy CitationDesignMethodSampleData C.docx
 
Evidence SynthesisCritique the below evidence synthesis ex.docx
Evidence SynthesisCritique the below evidence synthesis ex.docxEvidence SynthesisCritique the below evidence synthesis ex.docx
Evidence SynthesisCritique the below evidence synthesis ex.docx
 
Evidence Collection PolicyScenarioAfter the recent secur.docx
Evidence Collection PolicyScenarioAfter the recent secur.docxEvidence Collection PolicyScenarioAfter the recent secur.docx
Evidence Collection PolicyScenarioAfter the recent secur.docx
 
Everyone Why would companies have quality programs even though they.docx
Everyone Why would companies have quality programs even though they.docxEveryone Why would companies have quality programs even though they.docx
Everyone Why would companies have quality programs even though they.docx
 
Even though technology has shifted HRM to strategic partner, has thi.docx
Even though technology has shifted HRM to strategic partner, has thi.docxEven though technology has shifted HRM to strategic partner, has thi.docx
Even though technology has shifted HRM to strategic partner, has thi.docx
 
Even though people are aware that earthquakes and volcanoes typi.docx
Even though people are aware that earthquakes and volcanoes typi.docxEven though people are aware that earthquakes and volcanoes typi.docx
Even though people are aware that earthquakes and volcanoes typi.docx
 
Evaluative Essay 2 Grading RubricCriteriaLevels of Achievement.docx
Evaluative Essay 2 Grading RubricCriteriaLevels of Achievement.docxEvaluative Essay 2 Grading RubricCriteriaLevels of Achievement.docx
Evaluative Essay 2 Grading RubricCriteriaLevels of Achievement.docx
 
Evaluation Title Research DesignFor this first assignment, .docx
Evaluation Title Research DesignFor this first assignment, .docxEvaluation Title Research DesignFor this first assignment, .docx
Evaluation Title Research DesignFor this first assignment, .docx
 
Evaluation is the set of processes and methods that managers and sta.docx
Evaluation is the set of processes and methods that managers and sta.docxEvaluation is the set of processes and methods that managers and sta.docx
Evaluation is the set of processes and methods that managers and sta.docx
 
Evaluation Plan with Policy RecommendationAfter a program ha.docx
Evaluation Plan with Policy RecommendationAfter a program ha.docxEvaluation Plan with Policy RecommendationAfter a program ha.docx
Evaluation Plan with Policy RecommendationAfter a program ha.docx
 
Evaluating 19-Channel Z-score Neurofeedback Addressi.docx
Evaluating 19-Channel Z-score Neurofeedback  Addressi.docxEvaluating 19-Channel Z-score Neurofeedback  Addressi.docx
Evaluating 19-Channel Z-score Neurofeedback Addressi.docx
 
Evaluate the history of the Data Encryption Standard (DES) and then .docx
Evaluate the history of the Data Encryption Standard (DES) and then .docxEvaluate the history of the Data Encryption Standard (DES) and then .docx
Evaluate the history of the Data Encryption Standard (DES) and then .docx
 
Evaluate the Health History and Medical Information for Mrs. J.,.docx
Evaluate the Health History and Medical Information for Mrs. J.,.docxEvaluate the Health History and Medical Information for Mrs. J.,.docx
Evaluate the Health History and Medical Information for Mrs. J.,.docx
 
Evaluate the environmental factors that contribute to corporate mana.docx
Evaluate the environmental factors that contribute to corporate mana.docxEvaluate the environmental factors that contribute to corporate mana.docx
Evaluate the environmental factors that contribute to corporate mana.docx
 

Recently uploaded

Holdier Curriculum Vitae (April 2024).pdf
Holdier Curriculum Vitae (April 2024).pdfHoldier Curriculum Vitae (April 2024).pdf
Holdier Curriculum Vitae (April 2024).pdfagholdier
 
Mixin Classes in Odoo 17 How to Extend Models Using Mixin Classes
Mixin Classes in Odoo 17  How to Extend Models Using Mixin ClassesMixin Classes in Odoo 17  How to Extend Models Using Mixin Classes
Mixin Classes in Odoo 17 How to Extend Models Using Mixin ClassesCeline George
 
Web & Social Media Analytics Previous Year Question Paper.pdf
Web & Social Media Analytics Previous Year Question Paper.pdfWeb & Social Media Analytics Previous Year Question Paper.pdf
Web & Social Media Analytics Previous Year Question Paper.pdfJayanti Pande
 
Sociology 101 Demonstration of Learning Exhibit
Sociology 101 Demonstration of Learning ExhibitSociology 101 Demonstration of Learning Exhibit
Sociology 101 Demonstration of Learning Exhibitjbellavia9
 
ICT Role in 21st Century Education & its Challenges.pptx
ICT Role in 21st Century Education & its Challenges.pptxICT Role in 21st Century Education & its Challenges.pptx
ICT Role in 21st Century Education & its Challenges.pptxAreebaZafar22
 
psychiatric nursing HISTORY COLLECTION .docx
psychiatric  nursing HISTORY  COLLECTION  .docxpsychiatric  nursing HISTORY  COLLECTION  .docx
psychiatric nursing HISTORY COLLECTION .docxPoojaSen20
 
Key note speaker Neum_Admir Softic_ENG.pdf
Key note speaker Neum_Admir Softic_ENG.pdfKey note speaker Neum_Admir Softic_ENG.pdf
Key note speaker Neum_Admir Softic_ENG.pdfAdmir Softic
 
Unit-IV- Pharma. Marketing Channels.pptx
Unit-IV- Pharma. Marketing Channels.pptxUnit-IV- Pharma. Marketing Channels.pptx
Unit-IV- Pharma. Marketing Channels.pptxVishalSingh1417
 
Introduction to Nonprofit Accounting: The Basics
Introduction to Nonprofit Accounting: The BasicsIntroduction to Nonprofit Accounting: The Basics
Introduction to Nonprofit Accounting: The BasicsTechSoup
 
Food Chain and Food Web (Ecosystem) EVS, B. Pharmacy 1st Year, Sem-II
Food Chain and Food Web (Ecosystem) EVS, B. Pharmacy 1st Year, Sem-IIFood Chain and Food Web (Ecosystem) EVS, B. Pharmacy 1st Year, Sem-II
Food Chain and Food Web (Ecosystem) EVS, B. Pharmacy 1st Year, Sem-IIShubhangi Sonawane
 
Making and Justifying Mathematical Decisions.pdf
Making and Justifying Mathematical Decisions.pdfMaking and Justifying Mathematical Decisions.pdf
Making and Justifying Mathematical Decisions.pdfChris Hunter
 
ComPTIA Overview | Comptia Security+ Book SY0-701
ComPTIA Overview | Comptia Security+ Book SY0-701ComPTIA Overview | Comptia Security+ Book SY0-701
ComPTIA Overview | Comptia Security+ Book SY0-701bronxfugly43
 
Z Score,T Score, Percential Rank and Box Plot Graph
Z Score,T Score, Percential Rank and Box Plot GraphZ Score,T Score, Percential Rank and Box Plot Graph
Z Score,T Score, Percential Rank and Box Plot GraphThiyagu K
 
microwave assisted reaction. General introduction
microwave assisted reaction. General introductionmicrowave assisted reaction. General introduction
microwave assisted reaction. General introductionMaksud Ahmed
 
ICT role in 21st century education and it's challenges.
ICT role in 21st century education and it's challenges.ICT role in 21st century education and it's challenges.
ICT role in 21st century education and it's challenges.MaryamAhmad92
 
The basics of sentences session 2pptx copy.pptx
The basics of sentences session 2pptx copy.pptxThe basics of sentences session 2pptx copy.pptx
The basics of sentences session 2pptx copy.pptxheathfieldcps1
 
Ecological Succession. ( ECOSYSTEM, B. Pharmacy, 1st Year, Sem-II, Environmen...
Ecological Succession. ( ECOSYSTEM, B. Pharmacy, 1st Year, Sem-II, Environmen...Ecological Succession. ( ECOSYSTEM, B. Pharmacy, 1st Year, Sem-II, Environmen...
Ecological Succession. ( ECOSYSTEM, B. Pharmacy, 1st Year, Sem-II, Environmen...Shubhangi Sonawane
 
Advanced Views - Calendar View in Odoo 17
Advanced Views - Calendar View in Odoo 17Advanced Views - Calendar View in Odoo 17
Advanced Views - Calendar View in Odoo 17Celine George
 

Recently uploaded (20)

Holdier Curriculum Vitae (April 2024).pdf
Holdier Curriculum Vitae (April 2024).pdfHoldier Curriculum Vitae (April 2024).pdf
Holdier Curriculum Vitae (April 2024).pdf
 
Mixin Classes in Odoo 17 How to Extend Models Using Mixin Classes
Mixin Classes in Odoo 17  How to Extend Models Using Mixin ClassesMixin Classes in Odoo 17  How to Extend Models Using Mixin Classes
Mixin Classes in Odoo 17 How to Extend Models Using Mixin Classes
 
Web & Social Media Analytics Previous Year Question Paper.pdf
Web & Social Media Analytics Previous Year Question Paper.pdfWeb & Social Media Analytics Previous Year Question Paper.pdf
Web & Social Media Analytics Previous Year Question Paper.pdf
 
Mehran University Newsletter Vol-X, Issue-I, 2024
Mehran University Newsletter Vol-X, Issue-I, 2024Mehran University Newsletter Vol-X, Issue-I, 2024
Mehran University Newsletter Vol-X, Issue-I, 2024
 
Sociology 101 Demonstration of Learning Exhibit
Sociology 101 Demonstration of Learning ExhibitSociology 101 Demonstration of Learning Exhibit
Sociology 101 Demonstration of Learning Exhibit
 
ICT Role in 21st Century Education & its Challenges.pptx
ICT Role in 21st Century Education & its Challenges.pptxICT Role in 21st Century Education & its Challenges.pptx
ICT Role in 21st Century Education & its Challenges.pptx
 
psychiatric nursing HISTORY COLLECTION .docx
psychiatric  nursing HISTORY  COLLECTION  .docxpsychiatric  nursing HISTORY  COLLECTION  .docx
psychiatric nursing HISTORY COLLECTION .docx
 
INDIA QUIZ 2024 RLAC DELHI UNIVERSITY.pptx
INDIA QUIZ 2024 RLAC DELHI UNIVERSITY.pptxINDIA QUIZ 2024 RLAC DELHI UNIVERSITY.pptx
INDIA QUIZ 2024 RLAC DELHI UNIVERSITY.pptx
 
Key note speaker Neum_Admir Softic_ENG.pdf
Key note speaker Neum_Admir Softic_ENG.pdfKey note speaker Neum_Admir Softic_ENG.pdf
Key note speaker Neum_Admir Softic_ENG.pdf
 
Unit-IV- Pharma. Marketing Channels.pptx
Unit-IV- Pharma. Marketing Channels.pptxUnit-IV- Pharma. Marketing Channels.pptx
Unit-IV- Pharma. Marketing Channels.pptx
 
Introduction to Nonprofit Accounting: The Basics
Introduction to Nonprofit Accounting: The BasicsIntroduction to Nonprofit Accounting: The Basics
Introduction to Nonprofit Accounting: The Basics
 
Food Chain and Food Web (Ecosystem) EVS, B. Pharmacy 1st Year, Sem-II
Food Chain and Food Web (Ecosystem) EVS, B. Pharmacy 1st Year, Sem-IIFood Chain and Food Web (Ecosystem) EVS, B. Pharmacy 1st Year, Sem-II
Food Chain and Food Web (Ecosystem) EVS, B. Pharmacy 1st Year, Sem-II
 
Making and Justifying Mathematical Decisions.pdf
Making and Justifying Mathematical Decisions.pdfMaking and Justifying Mathematical Decisions.pdf
Making and Justifying Mathematical Decisions.pdf
 
ComPTIA Overview | Comptia Security+ Book SY0-701
ComPTIA Overview | Comptia Security+ Book SY0-701ComPTIA Overview | Comptia Security+ Book SY0-701
ComPTIA Overview | Comptia Security+ Book SY0-701
 
Z Score,T Score, Percential Rank and Box Plot Graph
Z Score,T Score, Percential Rank and Box Plot GraphZ Score,T Score, Percential Rank and Box Plot Graph
Z Score,T Score, Percential Rank and Box Plot Graph
 
microwave assisted reaction. General introduction
microwave assisted reaction. General introductionmicrowave assisted reaction. General introduction
microwave assisted reaction. General introduction
 
ICT role in 21st century education and it's challenges.
ICT role in 21st century education and it's challenges.ICT role in 21st century education and it's challenges.
ICT role in 21st century education and it's challenges.
 
The basics of sentences session 2pptx copy.pptx
The basics of sentences session 2pptx copy.pptxThe basics of sentences session 2pptx copy.pptx
The basics of sentences session 2pptx copy.pptx
 
Ecological Succession. ( ECOSYSTEM, B. Pharmacy, 1st Year, Sem-II, Environmen...
Ecological Succession. ( ECOSYSTEM, B. Pharmacy, 1st Year, Sem-II, Environmen...Ecological Succession. ( ECOSYSTEM, B. Pharmacy, 1st Year, Sem-II, Environmen...
Ecological Succession. ( ECOSYSTEM, B. Pharmacy, 1st Year, Sem-II, Environmen...
 
Advanced Views - Calendar View in Odoo 17
Advanced Views - Calendar View in Odoo 17Advanced Views - Calendar View in Odoo 17
Advanced Views - Calendar View in Odoo 17
 

Descriptive StatisticsNameQNT561DateInstructor’s Name.docx

  • 1. Descriptive StatisticsNameQNT/561 Date Instructor’s Name SHORT TITLE OF PAPER 1 Running head: DESCRIPTIVE STATISTICS 1 Descriptive Statistics Determine the appropriate descriptive statistics. Note: If the data was normally distributed, use the mean and standard deviation. If the data was skewed significantly, use the median and interquartile range. Numeric Variable Name1 Distribution: State if not normally distributed Central Tendency: Dispersion: Number: Min/Max: Confidence Interval: (if distribution is normal) Numeric Variable Name2 (if applicable) Distribution: State if not normally distributed Central Tendency: Dispersion: Number: Min/Max: Confidence Interval: (if distribution is normal)
  • 2. Attribute Variable Name (if applicable) Create a bar chart. Describe the proportions. Descriptive Statistics Interpretation Numeric Variable Name1 Describe the variable in laymen terms. Numeric Variable Name2 (if applicable) Describe the variable in laymen terms. DESCRIPTIVE STATISTICS 2 Appendix A Raw data used in the analysis Fit data to one page. Appendix B Charts and Tables This part of the paper will include items that are then cited in the body of the paper. Usually, large items are placed here not to distract from reading the paper. Appendix C Descriptive Statistics This part of the paper will include descriptive statistics. Create a Microsoft® Excel® spreadsheet with the two variables from your learning team's dataset. Analyze the data with MegaStat®, StatCrunch®, Microsoft® Excel®or other statistical tool(s), including:
  • 3. (a) Descriptive stats for each numeric variable (b) Histogram for each numeric variable (c) Bar chart for each attribute (non numeric) variable (d) Scatter plot if the data contains two numeric variables Determine the appropriate descriptive statistics. (a) For normally distributed data use the mean and standard deviation. (b) For significantly skewed data use the median and interquartile range. Use the Individual Methodology Findings Template to complete the descriptive statistics. Use the Descriptive Statistics and Interpretation Example to develop an interpretation of the descriptive statistics. Format your paper consistent with APA guidelines. Submit both the spreadsheet and the completed Individual Methodology Findings Template. Click the Assignment Files tab to submit your assignment. Please use the variables from this except: The size of this population is 20 suppliers. These suppliers exclusively produce and make available for sale the material that is needed for manufacturing. In order to develop the sampling design it is important to identify the independent and dependent variables. Independent variables are variables that are manipulated or treated in a study in order to see what effect differences in them will have on those variables proposed as being dependent on them (Riyami, 2008). The independent variable in this research is the cost of the raw material. Dependent variables are variables in which changes are results of the level or amount of the independent variable (Riyami, 2008). The dependent variable in this research is the availability of the raw material based on the price change as it relates to consumption.
  • 4. Descriptive Statistics and Interpretation Example QNT/561 Version 7 1 University of Phoenix Material Descriptive Statistics and Interpretation Example Interpretation Phrases Central Tendency: Mean = average of a set of data Median = half or equal number of data is above and half or equal number of data is below. It is a midpoint in an ordered (sorted) set of data, a physical location Mode = most frequent value in a set of data Dispersion: Standard deviation = variation Interquartile range (IQR) = the middle 50% of the data Range = the difference between the largest and smallest value of the data Confidence Interval: (data must be normal) There is 95% confidence that the population average is between _____ and ____ units. Normal or significantly skewed data: MegaStat: Descriptive statistics Normal curve goodness of fit p- value · Normal, p-value > .05 · Significantly Skewed, p-value < .05 Histogram: Eyeball the histogram. · Normal data will have a symmetrical or slightly skewed shape. · Significantly Skewed shape will have extreme skewness Use phrase combinations: Normally distributed: Mean and Standard Deviation, Not normally distributed: Median and IQR
  • 5. Descriptive Statistics Body Weight (Lbs.) Central Tendency: Mean = 149 Lbs. Dispersion: Standard deviation = 30 Lbs. Count: 100 Min/Max: 99 pounds and 234 Lbs. Confidence Interval: 144 to 155 Lbs. See the histogram in Appendix A, and descriptive statistics in Appendix B. Age Distribution is not normally distributed Central Tendency: Median = 36 years Dispersion: Interquartile Range = 20.5 years / 2 = ± 10 years Count: 100 Min/Max: 18 years and 74 years Confidence Interval: Not applicable (data is not normally distributed) See the histogram in Appendix A, and descriptive statistics in Appendix B. A scatter plot is in Appendix C.
  • 6. Education Level Thirteen percent of the subjects have no high school degree while 44% have high school degree. Forty three percent have a college or college graduate degree. See the bar chart in Appendix D. Descriptive Statistics Interpretation Interpretation Body Weight One hundred subjects were randomly selected. Their body weight was observed between 99 and 234 pounds. Their average weight was 149 pounds, with a variation of plus or minus 30 pounds. One half or more were above 149 pounds. There is 95% confidence that the population body weight average is between 144 and 155 pounds. Age The data was significantly skewed. One hundred subjects were randomly selected. Their ages were between 18 and 74 years, with a variation of plus or minus 10 years. One half or more subjects were 36 years of age or older. The middle half of the subjects’ ages fell between 27 and 47 years. The most frequent age was 36 years. APPENDIX A Body Weight and Age Histograms
  • 7. APPENDIX B Descriptive Statistics Body Weight and Age APPENDIX C Scatterplot Body Age versus Weight APPENDIX D Bar Chart Education Level Copyright © 2014 by University of Phoenix. All rights reserved.