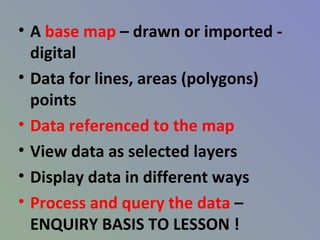
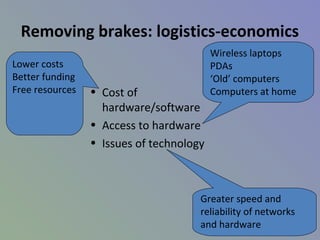
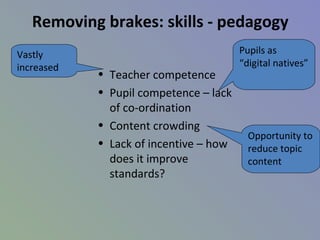
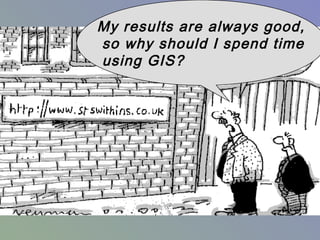
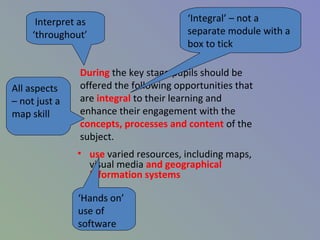
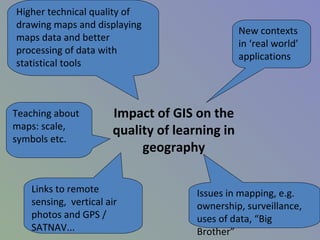
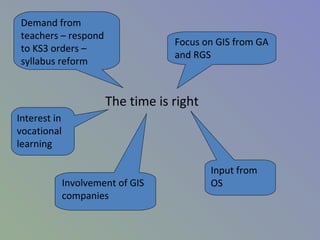
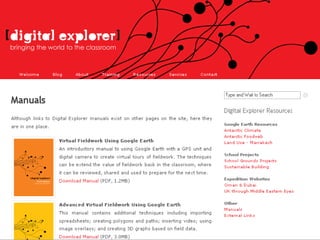
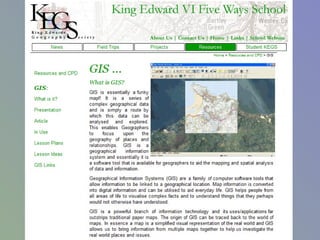
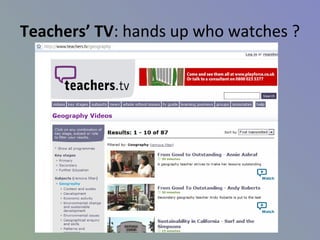
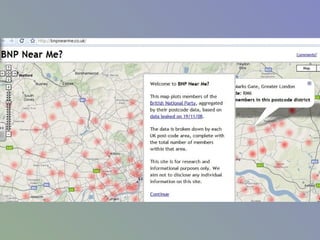
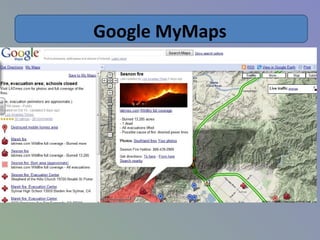
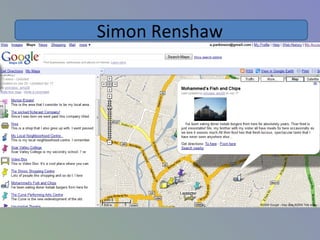
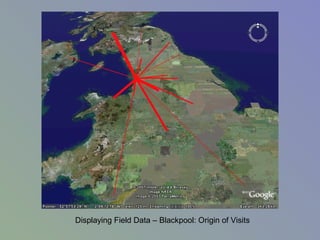
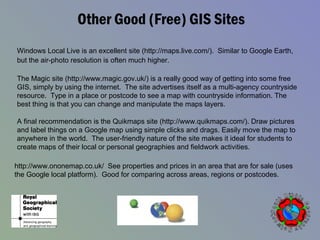
This document discusses using GIS (geographic information systems) in geography education. It provides an overview of key concepts in GIS like base maps, data layers, and querying spatial data. It also addresses challenges to using GIS in schools like costs, teacher skills, and curriculum constraints. Suggestions are provided to help overcome these challenges, such as using free online GIS tools and emphasizing hands-on learning. Examples are given of how GIS can enhance geography lessons and student understanding through activities like mapping field data and exploring real-world applications. Overall it promotes the educational benefits of incorporating GIS into the geography curriculum.
Presented by Anne Robertson and Carol Blackwood for the Scottish Association of Geography Teachers in Perth, on 25 October 2014. An overview of some of the features of the online mapping tool for schools.
Presentation given by Nicola Osborne, Addy Pope and Ben Butchart for the "Crowdsource Your Neighbourhood" event at the Cabaret of Dangerous Ideas, Monday 5th August 2013. This event was part of the Edinburgh Festival Fringe and took place at the Famous Speigeltent, George Street, Edinburgh.
Digimap for Schools - an excellent digital resource for Social Studies and mu...edibevan
Digimap for Schools workshop for Geography PGDE students at Aberdeen University by Anne Robertson and Dimitrios Sferopoulos from EDINA on 25th April 2017
Invited talk at a workshop for 'Scotland's National Collections and the Digital Humanities,' a knowledge-exchange project hosted at the University of Edinburgh. 14 Feb. 2014. http://www.blogs.hss.ed.ac.uk/archives-now/
Référentiel de compétences établi par le réseau Hérodot : www.herodot.net pour établir des standarts européens afin d'améliorer l'enseignement et l'apprentissage de la géographie en Europe. Ces standarts sont approuvés par les membres de la communauté des géographes européens, il doit servir dans la construction des cours, dans l'apprentissage et la structuration des programmes.
Benchmark implemented by Herodot Network (www.herodot.net) to improve the quality of Geography learning and teaching through establishing European standards for higher education Geography degrees which are agreed by members of the geographical community and implemented as part of new course developments, course revision and degree structures.
Integrating Geotechnologies in European EducationKarl Donert
This presentation for GIS Day 2020 organised by the GeoTech Centre, USA. It explores some of the different projects that Karl Donert representing EUROGEO is involved in and examines the integration of GIS and geo-tools into different sectors of education.
The presentation includes the following school projects - GI-Learner and GI-Pedagosy, D3 - Developing Digital Data literacy, GeoCapabilities and EValue - European Values Atlas, MYGEO and HUM@N projects for universities and SEED for vocational training. In all cases geo-technology has been integrated in curriculum developments.
40 min presentation to the Map Curators Workshop 2013 held in Hothorpe Hall. The presentation looks at how EDINA has used the knowledge fro running web based mapping services for 15 years to develop a new mobile mapping app. The focus is on "knowing your users" and ensuring that you fulfill their needs.
Introduction to an ICT based cross curricular resource for PGDE GeographyEDINA
Presentation given at St Andrews Building, University of Glasgow on 19th January 2017 by Anne Robertson, EDINA, University of Edinburgh about the Digimap for School service.
Introduction to an ICT based cross curricular resource for PGDE Geographyedibevan
Presentation given at St Andrews Building, University of Glasgow on 19th January 2017 by Anne Robertson, EDINA, University of Edinburgh about the Digimap for School service.
Poster: Enhancing and Educating with the WxSat Mobile AppKyle Nelson
Poster presented at the Federation of Earth Science Information Partners' (ESIP) 2015 Winter Meeting. Development of educational products and enhancements to the WxSat Mobile App were funded through an ESIP Student Fellow research grant.
Accelerate your Kubernetes clusters with Varnish CachingThijs Feryn
A presentation about the usage and availability of Varnish on Kubernetes. This talk explores the capabilities of Varnish caching and shows how to use the Varnish Helm chart to deploy it to Kubernetes.
This presentation was delivered at K8SUG Singapore. See https://feryn.eu/presentations/accelerate-your-kubernetes-clusters-with-varnish-caching-k8sug-singapore-28-2024 for more details.
Neuro-symbolic is not enough, we need neuro-*semantic*Frank van Harmelen
Neuro-symbolic (NeSy) AI is on the rise. However, simply machine learning on just any symbolic structure is not sufficient to really harvest the gains of NeSy. These will only be gained when the symbolic structures have an actual semantics. I give an operational definition of semantics as “predictable inference”.
All of this illustrated with link prediction over knowledge graphs, but the argument is general.
Connector Corner: Automate dynamic content and events by pushing a buttonDianaGray10
Here is something new! In our next Connector Corner webinar, we will demonstrate how you can use a single workflow to:
Create a campaign using Mailchimp with merge tags/fields
Send an interactive Slack channel message (using buttons)
Have the message received by managers and peers along with a test email for review
But there’s more:
In a second workflow supporting the same use case, you’ll see:
Your campaign sent to target colleagues for approval
If the “Approve” button is clicked, a Jira/Zendesk ticket is created for the marketing design team
But—if the “Reject” button is pushed, colleagues will be alerted via Slack message
Join us to learn more about this new, human-in-the-loop capability, brought to you by Integration Service connectors.
And...
Speakers:
Akshay Agnihotri, Product Manager
Charlie Greenberg, Host
State of ICS and IoT Cyber Threat Landscape Report 2024 previewPrayukth K V
The IoT and OT threat landscape report has been prepared by the Threat Research Team at Sectrio using data from Sectrio, cyber threat intelligence farming facilities spread across over 85 cities around the world. In addition, Sectrio also runs AI-based advanced threat and payload engagement facilities that serve as sinks to attract and engage sophisticated threat actors, and newer malware including new variants and latent threats that are at an earlier stage of development.
The latest edition of the OT/ICS and IoT security Threat Landscape Report 2024 also covers:
State of global ICS asset and network exposure
Sectoral targets and attacks as well as the cost of ransom
Global APT activity, AI usage, actor and tactic profiles, and implications
Rise in volumes of AI-powered cyberattacks
Major cyber events in 2024
Malware and malicious payload trends
Cyberattack types and targets
Vulnerability exploit attempts on CVEs
Attacks on counties – USA
Expansion of bot farms – how, where, and why
In-depth analysis of the cyber threat landscape across North America, South America, Europe, APAC, and the Middle East
Why are attacks on smart factories rising?
Cyber risk predictions
Axis of attacks – Europe
Systemic attacks in the Middle East
Download the full report from here:
https://sectrio.com/resources/ot-threat-landscape-reports/sectrio-releases-ot-ics-and-iot-security-threat-landscape-report-2024/
JMeter webinar - integration with InfluxDB and GrafanaRTTS
Watch this recorded webinar about real-time monitoring of application performance. See how to integrate Apache JMeter, the open-source leader in performance testing, with InfluxDB, the open-source time-series database, and Grafana, the open-source analytics and visualization application.
In this webinar, we will review the benefits of leveraging InfluxDB and Grafana when executing load tests and demonstrate how these tools are used to visualize performance metrics.
Length: 30 minutes
Session Overview
-------------------------------------------
During this webinar, we will cover the following topics while demonstrating the integrations of JMeter, InfluxDB and Grafana:
- What out-of-the-box solutions are available for real-time monitoring JMeter tests?
- What are the benefits of integrating InfluxDB and Grafana into the load testing stack?
- Which features are provided by Grafana?
- Demonstration of InfluxDB and Grafana using a practice web application
To view the webinar recording, go to:
https://www.rttsweb.com/jmeter-integration-webinar
Essentials of Automations: Optimizing FME Workflows with ParametersSafe Software
Are you looking to streamline your workflows and boost your projects’ efficiency? Do you find yourself searching for ways to add flexibility and control over your FME workflows? If so, you’re in the right place.
Join us for an insightful dive into the world of FME parameters, a critical element in optimizing workflow efficiency. This webinar marks the beginning of our three-part “Essentials of Automation” series. This first webinar is designed to equip you with the knowledge and skills to utilize parameters effectively: enhancing the flexibility, maintainability, and user control of your FME projects.
Here’s what you’ll gain:
- Essentials of FME Parameters: Understand the pivotal role of parameters, including Reader/Writer, Transformer, User, and FME Flow categories. Discover how they are the key to unlocking automation and optimization within your workflows.
- Practical Applications in FME Form: Delve into key user parameter types including choice, connections, and file URLs. Allow users to control how a workflow runs, making your workflows more reusable. Learn to import values and deliver the best user experience for your workflows while enhancing accuracy.
- Optimization Strategies in FME Flow: Explore the creation and strategic deployment of parameters in FME Flow, including the use of deployment and geometry parameters, to maximize workflow efficiency.
- Pro Tips for Success: Gain insights on parameterizing connections and leveraging new features like Conditional Visibility for clarity and simplicity.
We’ll wrap up with a glimpse into future webinars, followed by a Q&A session to address your specific questions surrounding this topic.
Don’t miss this opportunity to elevate your FME expertise and drive your projects to new heights of efficiency.
DevOps and Testing slides at DASA ConnectKari Kakkonen
My and Rik Marselis slides at 30.5.2024 DASA Connect conference. We discuss about what is testing, then what is agile testing and finally what is Testing in DevOps. Finally we had lovely workshop with the participants trying to find out different ways to think about quality and testing in different parts of the DevOps infinity loop.
UiPath Test Automation using UiPath Test Suite series, part 4DianaGray10
Welcome to UiPath Test Automation using UiPath Test Suite series part 4. In this session, we will cover Test Manager overview along with SAP heatmap.
The UiPath Test Manager overview with SAP heatmap webinar offers a concise yet comprehensive exploration of the role of a Test Manager within SAP environments, coupled with the utilization of heatmaps for effective testing strategies.
Participants will gain insights into the responsibilities, challenges, and best practices associated with test management in SAP projects. Additionally, the webinar delves into the significance of heatmaps as a visual aid for identifying testing priorities, areas of risk, and resource allocation within SAP landscapes. Through this session, attendees can expect to enhance their understanding of test management principles while learning practical approaches to optimize testing processes in SAP environments using heatmap visualization techniques
What will you get from this session?
1. Insights into SAP testing best practices
2. Heatmap utilization for testing
3. Optimization of testing processes
4. Demo
Topics covered:
Execution from the test manager
Orchestrator execution result
Defect reporting
SAP heatmap example with demo
Speaker:
Deepak Rai, Automation Practice Lead, Boundaryless Group and UiPath MVP
3. “…a digital map, data located
on the map, and a software
application (GIS) that links the
two together”
Diana Freeman (2004)
4. • A base map – drawn or imported -
digital
• Data for lines, areas (polygons)
points
• Data referenced to the map
• View data as selected layers
• Display data in different ways
• Process and query the data –
ENQUIRY BASIS TO LESSON !
5. These are the essential skills and processes in geography that pupils need to
learn to make progress.
2.1 Geographical enquiry
Pupils should be able to:
• collect, record and display information
• find creative ways of using and applying geographical skills and
understanding to create new interpretations of place and space
2.3 Graphicacy and visual literacy
Pupils should be able to:
• use atlases maps at a range of scales, photographs, satellite images
• construct maps and plans at a variety of scales, using graphical techniques
to present evidence.
4. Curriculum opportunities
Pupils should be able to:
d. use varied resources, including maps, visual media and geographical
information systems
f. make links between geography and other subjects, including citizenship
and ICT.
The Growing importance of GIS
6.
7. GIS is valuable for mapping and visualising
information as well as linking and analysing
different spatial datasets.
There should be opportunities to learn with GIS
and to learn about GIS.
80% of all data has a spatial component
9. The brakes on ICT -
GIS
Logistics - economics
• Cost of hardware/software
• Access to hardware
• Issues of technology
Skills - pedagogy
• Teacher competence
• Pupil competence – lack of ICT co-
ordination
• Content crowding
• Lack of incentive – does it improve
standards?
10. Removing brakes: logistics-economics
• Cost of
hardware/software
• Access to hardware
• Issues of technology
Lower costs
Better funding
Free resources
Wireless laptops
PDAs
‘Old’ computers
Computers at home
Greater speed and
reliability of networks
and hardware
11. Removing brakes: skills - pedagogy
• Teacher competence
• Pupil competence – lack
of co-ordination
• Content crowding
• Lack of incentive – how
does it improve
standards?
Vastly
increased
Pupils as
“digital natives”
Opportunity to
reduce topic
content
12. My results are always good,
so why should I spend time
using GIS?
13. During the key stage pupils should be
offered the following opportunities that
are integral to their learning and
enhance their engagement with the
concepts, processes and content of the
subject.
• use varied resources, including maps,
visual media and geographical
information systems
Interpret as
‘throughout’
‘Integral’ – not a
separate module with a
box to tick
All aspects
– not just a
map skill
‘Hands on’
use of
software
14. Impact of GIS on the
quality of learning in
geography
Higher technical quality of
drawing maps and displaying
maps data and better
processing of data with
statistical tools
Links to remote
sensing, vertical air
photos and GPS /
SATNAV...
Issues in mapping, e.g.
ownership, surveillance,
uses of data, “Big
Brother”
Teaching about
maps: scale,
symbols etc.
New contexts
in ‘real world’
applications
15. The time is right
Demand from
teachers – respond
to KS3 orders –
syllabus reform
Focus on GIS from GA
and RGS
Interest in
vocational
learning
Involvement of GIS
companies
Input from
OS
37. Other Good (Free) GIS Sites
Windows Local Live is an excellent site (http://maps.live.com/). Similar to Google Earth,
but the air-photo resolution is often much higher.
The Magic site (http://www.magic.gov.uk/) is a really good way of getting into some free
GIS, simply by using the internet. The site advertises itself as a multi-agency countryside
resource. Type in a place or postcode to see a map with countryside information. The
best thing is that you can change and manipulate the maps layers.
A final recommendation is the Quikmaps site (http://www.quikmaps.com/). Draw pictures
and label things on a Google map using simple clicks and drags. Easily move the map to
anywhere in the world. The user-friendly nature of the site makes it ideal for students to
create maps of their local or personal geographies and fieldwork activities.
http://www.ononemap.co.uk/ See properties and prices in an area that are for sale (uses
the Google local platform). Good for comparing across areas, regions or postcodes.
51. CREDITS
Some slides by:
Fred Martin (GIS)
Christine Lloyd Staples (Media and Film)
Noel Jenkins (Wordle and Juicy Geography)
Helen Young
Digital Explorer
Simon Renshaw and students
West Ribble Geography Network
Via GTT CGeog Networks section
Some work by Tom Barrett – check him out !