Download to read offline


![Arthur Charpentier, SIDE Summer School, July 2019
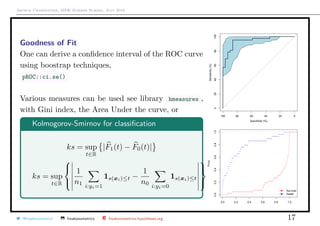
Goodness of Fit: ROC Curve
29 deaths (y = 0) and 42 survivals (y = 1)
y =
1 if P[Y = 1|X] > 0%
0 if P[Y = 1|X] ≤ 0%
0%
y
0 1
0 0 0
y
1 29 42
29
29+0
42
42+0
= 100% = 100%
FPR TPR
@freakonometrics freakonometrics freakonometrics.hypotheses.org 6](https://image.slidesharecdn.com/sidearthur2019preliminary08-190716095829/85/Side-2019-8-6-320.jpg)
![Arthur Charpentier, SIDE Summer School, July 2019
Goodness of Fit: ROC Curve
29 deaths (y = 0) and 42 survivals (y = 1)
y =
1 if P[Y = 1|X] > 15%
0 if P[Y = 1|X] ≤ 15%
15%
y
0 1
0 17 2
y
1 12 40
12
17+12
40
42+2
∼ 41.4% ∼ 95.2%
FPR TPR
@freakonometrics freakonometrics freakonometrics.hypotheses.org 7](https://image.slidesharecdn.com/sidearthur2019preliminary08-190716095829/85/Side-2019-8-7-320.jpg)
![Arthur Charpentier, SIDE Summer School, July 2019
Goodness of Fit: ROC Curve
29 deaths (y = 0) and 42 survivals (y = 1)
y =
1 if P[Y = 1|X] > 50%
0 if P[Y = 1|X] ≤ 50%
50%
y
0 1
0 25 3
y
1 4 39
4
25+4
39
39+3
∼ 13.8% ∼ 92.8%
FPR TPR
@freakonometrics freakonometrics freakonometrics.hypotheses.org 8](https://image.slidesharecdn.com/sidearthur2019preliminary08-190716095829/85/Side-2019-8-8-320.jpg)
![Arthur Charpentier, SIDE Summer School, July 2019
Goodness of Fit: ROC Curve
29 deaths (y = 0) and 42 survivals (y = 1)
y =
1 if P[Y = 1|X] > 85%
0 if P[Y = 1|X] ≤ 85%
50%
y
0 1
0 28 13
y
1 1 29
1
28+1
29
29+13
∼ 3.4% ∼ 69.9%
FPR TPR
@freakonometrics freakonometrics freakonometrics.hypotheses.org 9](https://image.slidesharecdn.com/sidearthur2019preliminary08-190716095829/85/Side-2019-8-9-320.jpg)
![Arthur Charpentier, SIDE Summer School, July 2019
Goodness of Fit: ROC Curve
29 deaths (y = 0) and 42 survivals (y = 1)
y =
1 if P[Y = 1|X] > 100%
0 if P[Y = 1|X] ≤ 100%
50%
y
0 1
0 29 42
y
0 0 29
0
29+0
0
42+0
= 0.0% = 0.0%
FPR TPR
@freakonometrics freakonometrics freakonometrics.hypotheses.org 10](https://image.slidesharecdn.com/sidearthur2019preliminary08-190716095829/85/Side-2019-8-10-320.jpg)


![Arthur Charpentier, SIDE Summer School, July 2019
Goodness of Fit
Accuracy for classification
(total) accuracy =
TP + TN
n
total accuracy =
TP + TN
n
∼ 90.14%
random accuracy =
[TN + FP] · [TP + FN] + [TP + FP] · [TN + FN]
n2
∼ 51.93%
Cohen’s κ for classification
κ =
(total) accuracy − random accuracy
1 − random accuracy
from Cohen, Jacob (1960, A coefficient of agreement for nominal scales). Here
κ ∼ 79.48%.
@freakonometrics freakonometrics freakonometrics.hypotheses.org 19](https://image.slidesharecdn.com/sidearthur2019preliminary08-190716095829/85/Side-2019-8-19-320.jpg)

This document discusses classification and goodness of fit in machine learning. It introduces concepts like confusion matrices, ROC curves, and measures like sensitivity, specificity, and AUC. ROC curves are constructed by plotting the true positive rate vs. false positive rate for different classification thresholds. The AUC can measure classifier performance, with higher values indicating better classification. Chi-square tests and bootstrapping are also discussed for evaluating goodness of fit.


