Download to read offline

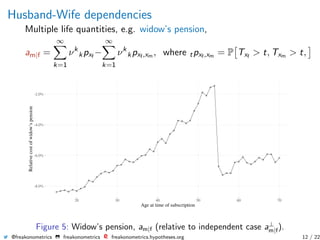
![Demographic & Insurance Notations
tpx = P[T(x) > t] = P[T−x > t|T > x] =
P[T > t + x]
P[T > x]
=
S(x + t)
S(x)
.
curtate life expectancy for Tx is defined as
ex = E Tx = E T − x |T > x =
∞
t=0
ttpx · qx+t =
∞
t=1
tpx ,
actuarial present value of the annuity of an individual age (x) is
ax =
∞
k=1
νk
kpx or ax:n =
n
k=1
νk
kpx ,
and whole life insurance (see Bowers et al. (1997))
Ax =
∞
k=1
νk
kpx · qx+k or A1
x:n =
n
k=1
νk
kpx · qx+k.
@freakonometrics freakonometrics freakonometrics.hypotheses.org 6 / 22](https://image.slidesharecdn.com/slides-oica-charpentier-200428001456/85/Slides-OICA-2020-6-320.jpg)
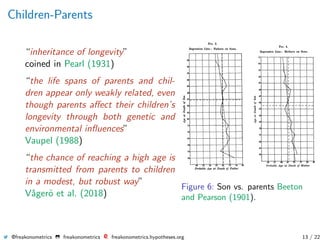
![Historical Mortality
Survival Probability Logarithms of probabilities of dying
0 10 20 30 40 50 60 70 80 90 100 110 10 20 30 40 50 60 70 80 90 100 110
0.001
0.01
0.1
1
0.00
0.25
0.50
0.75
1.00
age
Women Men
Geneanet Generation mortality tables from Vallin and Mesl´e (2001)
Figure 1: Survival distribution tp0 = P[T > t] and force of mortality
1qx = P[T ≤ x + 1|T > x] (log scale), against historical data.
@freakonometrics freakonometrics freakonometrics.hypotheses.org 7 / 22](https://image.slidesharecdn.com/slides-oica-charpentier-200428001456/85/Slides-OICA-2020-7-320.jpg)
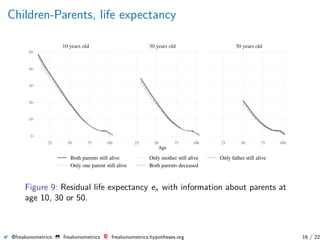
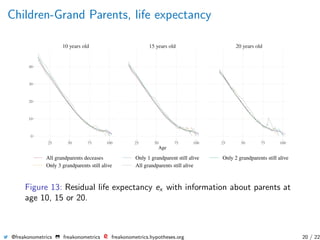
![Children-Parents
Beeton and Pearson (1901), regression of Txc given Txf
or Txm
slope :
Daughter–mother
0.1968 [0.1910,0.20260]
Son–mother
0.1791 [0.1737,0.18443]
Daughter–father
0.1186 [0.1122,0.12507]
Son–father
0.1197 [0.1138,0.12567]
0
25
50
75
20 40 60 80 100
Age at death of mother
(a) Daughters on mothers
0
25
50
75
20 40 60 80 100
Age at death of mother
(b) Sons on mothers
0
25
50
75
20 40 60 80 100
Age at death of father
(c) Daughters on fathers
0
25
50
75
20 40 60 80 100
Age at death of father
(d) Sons on fathers
Conditional Means GAM Linear regression
Quantile Regression (τ = 0.1) Quantile Regression (τ = 0.9)
Figure 7: Age of the children given
information relative to the parents.
@freakonometrics freakonometrics freakonometrics.hypotheses.org 14 / 22](https://image.slidesharecdn.com/slides-oica-charpentier-200428001456/85/Slides-OICA-2020-14-320.jpg)
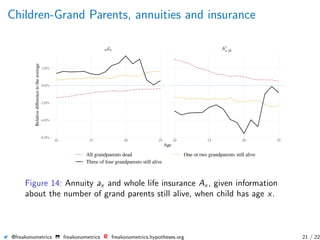

The document summarizes research on using genealogical data to model dependencies in life spans between family members and quantify the impact on insurance premiums. It presents analysis of husband-wife, parent-child, and grandparent-grandchild relationships, showing dependencies exist. Mortality rates, life expectancies, and insurance quantities like annuities are estimated conditionally based on family history information.


![[Actuary] actuarial mathematics and life table statistics](https://cdn.slidesharecdn.com/ss_thumbnails/actuaryactuarialmathematicsandlife-tablestatistics-120627131254-phpapp01-thumbnail.jpg?width=640&height=640&fit=bounds)


![[DSC Europe 25] Andrzej Kowalczyk - AI - how to start small and grow in the f...](https://cdn.slidesharecdn.com/ss_thumbnails/oy1zmo94qv6vpcqjvno2-andrzej-kowalczyk-ai-how-to-start-small-and-grow-in-the-future-1-260119121559-cf093b23-thumbnail.jpg?width=640&height=640&fit=bounds)


![[DSC Europe 25] Slobodan Dolinic - Smart and Intelligent Green Region.pptx](https://cdn.slidesharecdn.com/ss_thumbnails/0bribinjsp6ghwtvsvor-2-sigre-slobodan-dolinic-260115093812-c9c10e90-thumbnail.jpg?width=640&height=640&fit=bounds)