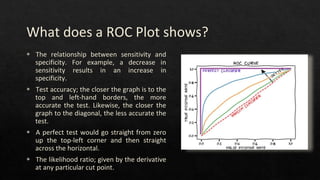
Topic to be covered
◈ ROC Curves
◈ AUC Curves
◈ Feature engineering
◈ Confusion Matrix
ROC Curves
◈ A receiver operating characteristic
curve, i.e. ROC curve, is a graphical
plot that illustrates the diagnostic
ability of a binary classifier system as
its discrimination threshold is varied.
◈ A Receiver Operating Characteristic
(ROC) Curve is a way to compare
diagnostic tests. It is a plot of the true
positive rate against the false positive
rate.
What does a ROC Plot shows?
◈ The relationship between sensitivity and
specificity. For example, a decrease in
sensitivity results in an increase in
specificity.
◈ Test accuracy; the closer the graph is to the
top and left-hand borders, the more
accurate the test. Likewise, the closer the
graph to the diagonal, the less accurate the
test.
◈ A perfect test would go straight from zero
up the top-left corner and then straight
across the horizontal.
◈ The likelihood ratio; given by the derivative
at any particular cut point.
AUC Curves:
◈ As the name indicates, it is an area under the
curve calculated in the ROC space.
◈ One of the easy ways to calculate the AUC
score is using the trapezoidal rule, which is
adding up all trapezoids under the curve.
◈ the theoretical range of AUC score is between
0 and 1, the actual scores of meaningful
classifiers are greater than 0.5, which is the
AUC score of a random classifier
“
”
More data beats clever algorithms, but the
better data beats the more data.
--Peter Norvig
“
”
…some machine learning projects succeed and
some fail. What makes the difference? Easily
the most important factor is the features used.
–Pedro Domingos
Feature Engineering
◈ Most creative aspect of Data Science.
◈ Treat like any other creative endeavor, like
writing a comedy show:
◈ Hold brainstorming sessions
◈ Create templates / formula’s
◈ Check/revisit what worked before
Confusion matrix
◈ A common method for describing the
performance of a classification model
consisting of true positives, true negatives,
false positives, and false negatives.
◈ It is called a confusion matrix because it
shows how confused the model is between
the classes.
References
◈ https://en.wikipedia.org/wiki/Receiver_operating_characteristic#Basic_concep
t
◈ https://towardsdatascience.com/feature-engineering-for-machine-learning-
3a5e293a5114

r_concepts

  • 1.
    Topic to becovered ◈ ROC Curves ◈ AUC Curves ◈ Feature engineering ◈ Confusion Matrix
  • 2.
    ROC Curves ◈ Areceiver operating characteristic curve, i.e. ROC curve, is a graphical plot that illustrates the diagnostic ability of a binary classifier system as its discrimination threshold is varied. ◈ A Receiver Operating Characteristic (ROC) Curve is a way to compare diagnostic tests. It is a plot of the true positive rate against the false positive rate.
  • 3.
    What does aROC Plot shows? ◈ The relationship between sensitivity and specificity. For example, a decrease in sensitivity results in an increase in specificity. ◈ Test accuracy; the closer the graph is to the top and left-hand borders, the more accurate the test. Likewise, the closer the graph to the diagonal, the less accurate the test. ◈ A perfect test would go straight from zero up the top-left corner and then straight across the horizontal. ◈ The likelihood ratio; given by the derivative at any particular cut point.
  • 4.
    AUC Curves: ◈ Asthe name indicates, it is an area under the curve calculated in the ROC space. ◈ One of the easy ways to calculate the AUC score is using the trapezoidal rule, which is adding up all trapezoids under the curve. ◈ the theoretical range of AUC score is between 0 and 1, the actual scores of meaningful classifiers are greater than 0.5, which is the AUC score of a random classifier
  • 5.
    “ ” More data beatsclever algorithms, but the better data beats the more data. --Peter Norvig
  • 6.
    “ ” …some machine learningprojects succeed and some fail. What makes the difference? Easily the most important factor is the features used. –Pedro Domingos
  • 7.
    Feature Engineering ◈ Mostcreative aspect of Data Science. ◈ Treat like any other creative endeavor, like writing a comedy show: ◈ Hold brainstorming sessions ◈ Create templates / formula’s ◈ Check/revisit what worked before
  • 8.
    Confusion matrix ◈ Acommon method for describing the performance of a classification model consisting of true positives, true negatives, false positives, and false negatives. ◈ It is called a confusion matrix because it shows how confused the model is between the classes.
  • 9.