Download to read offline

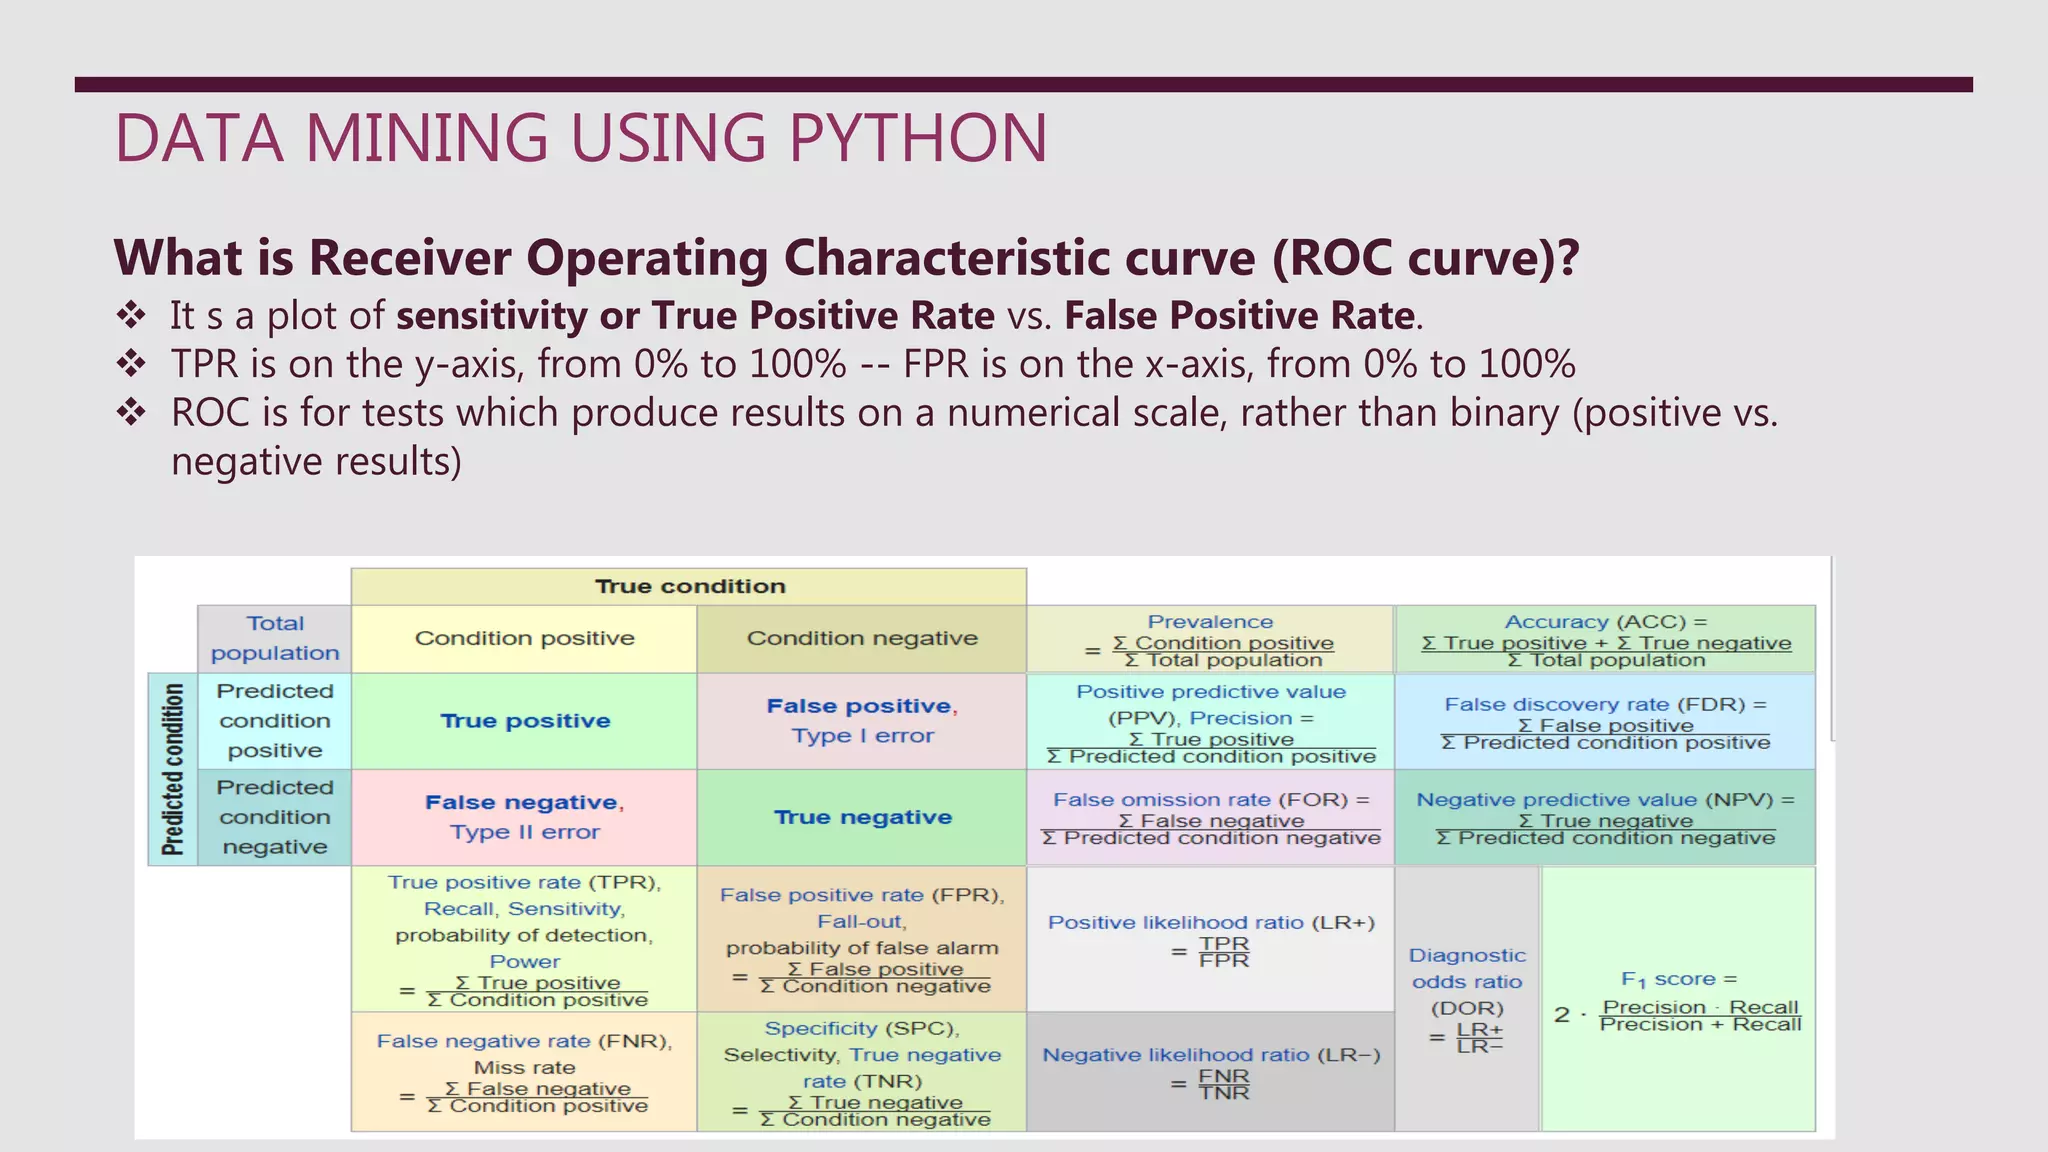
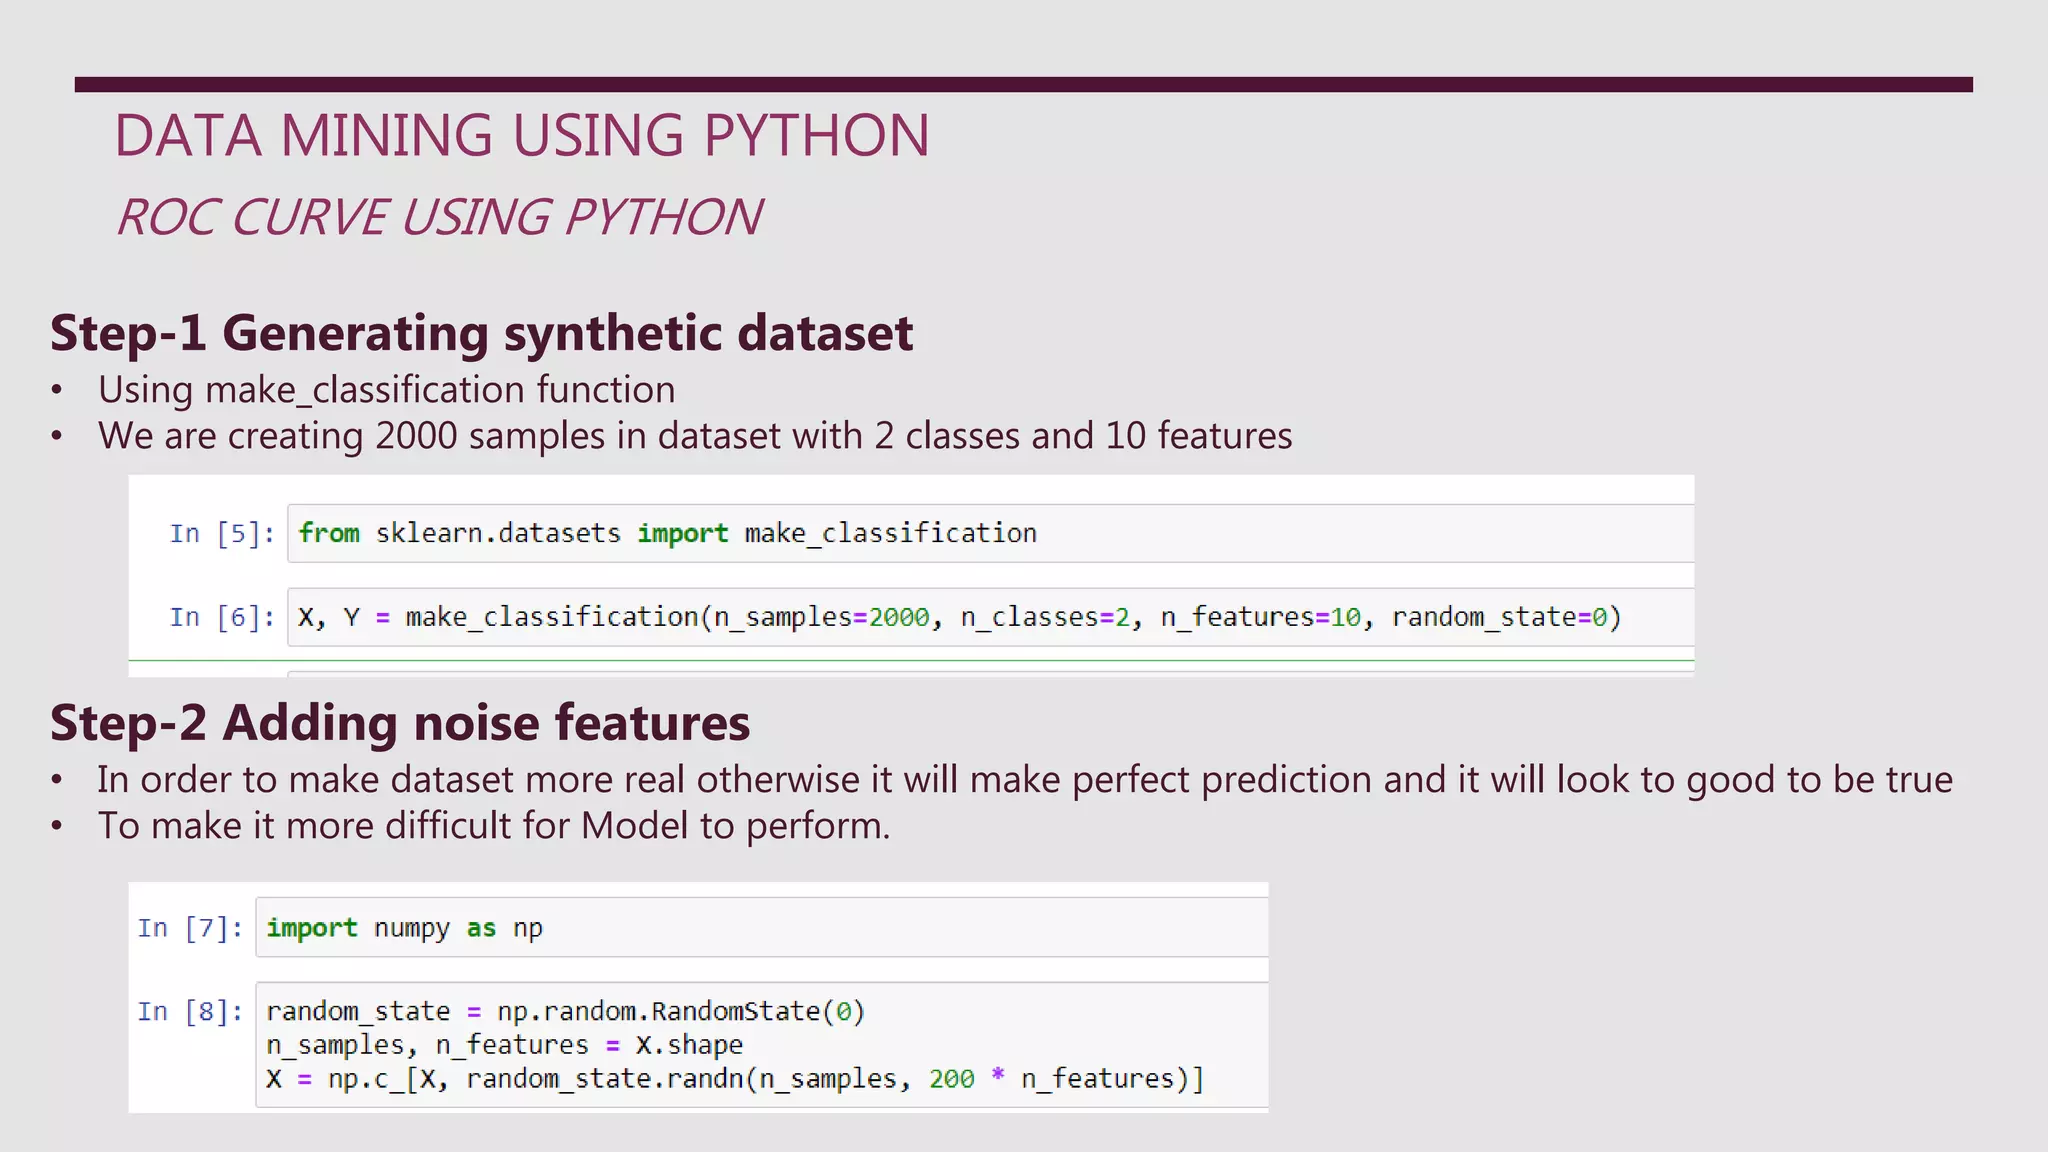
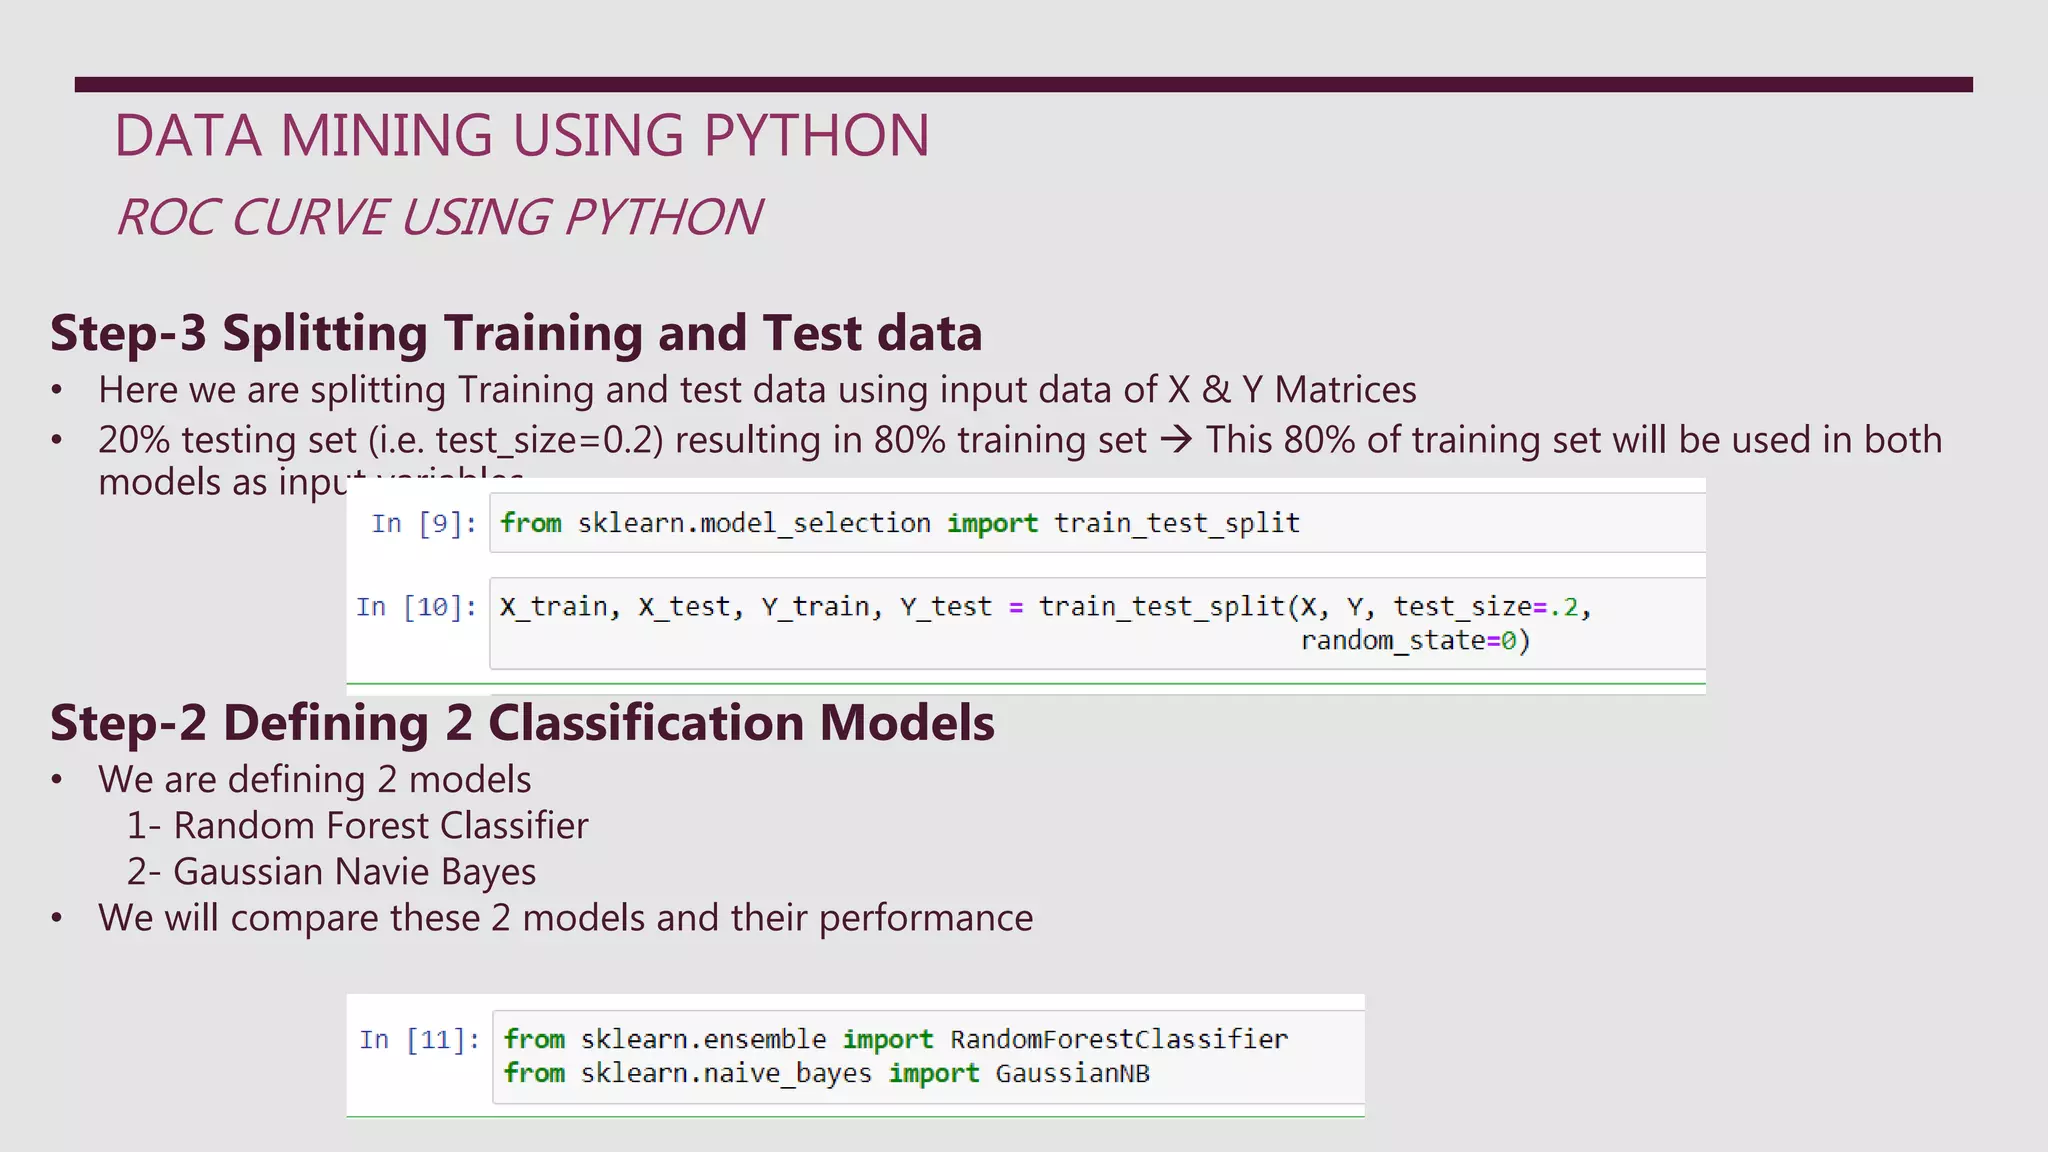
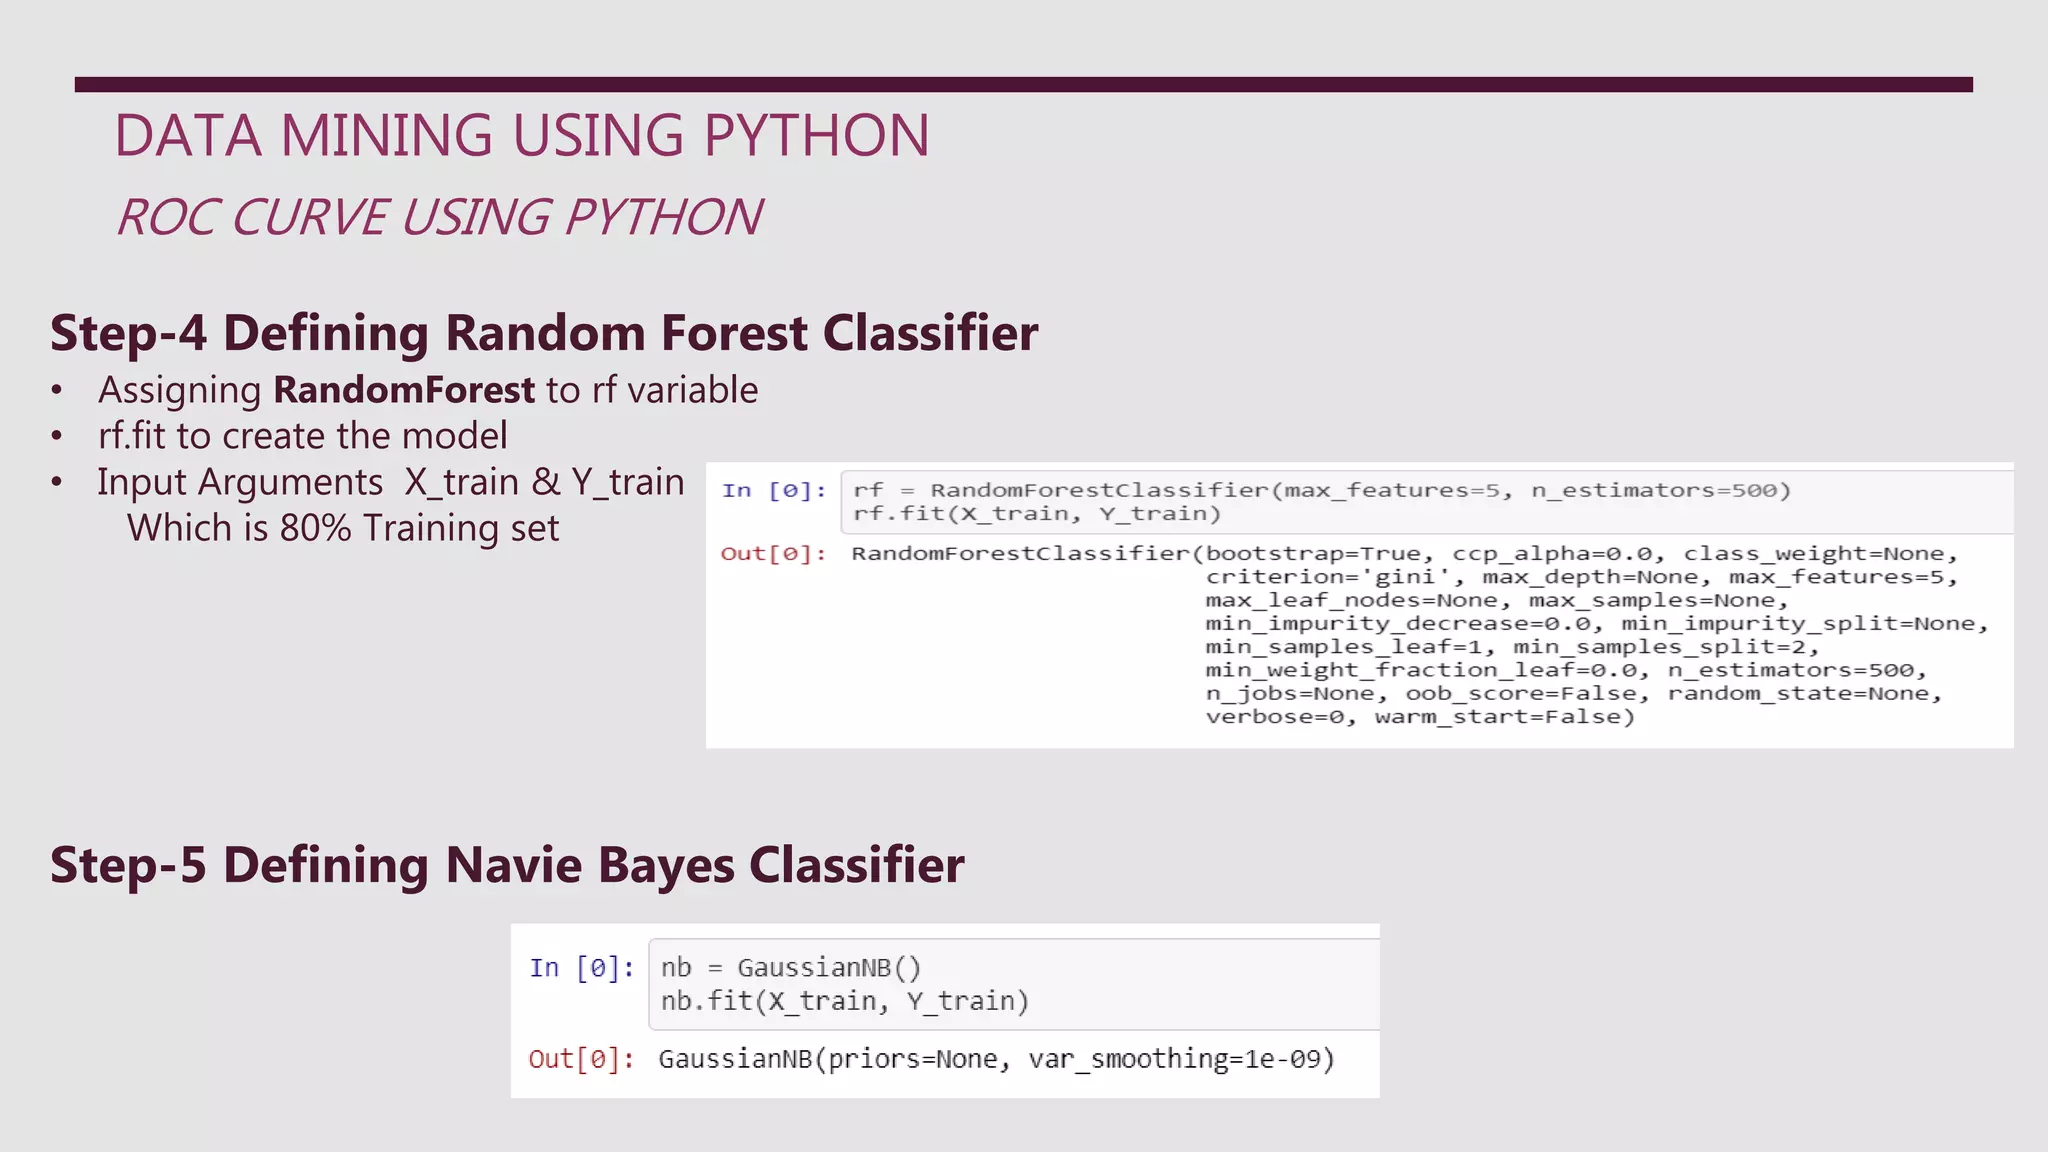
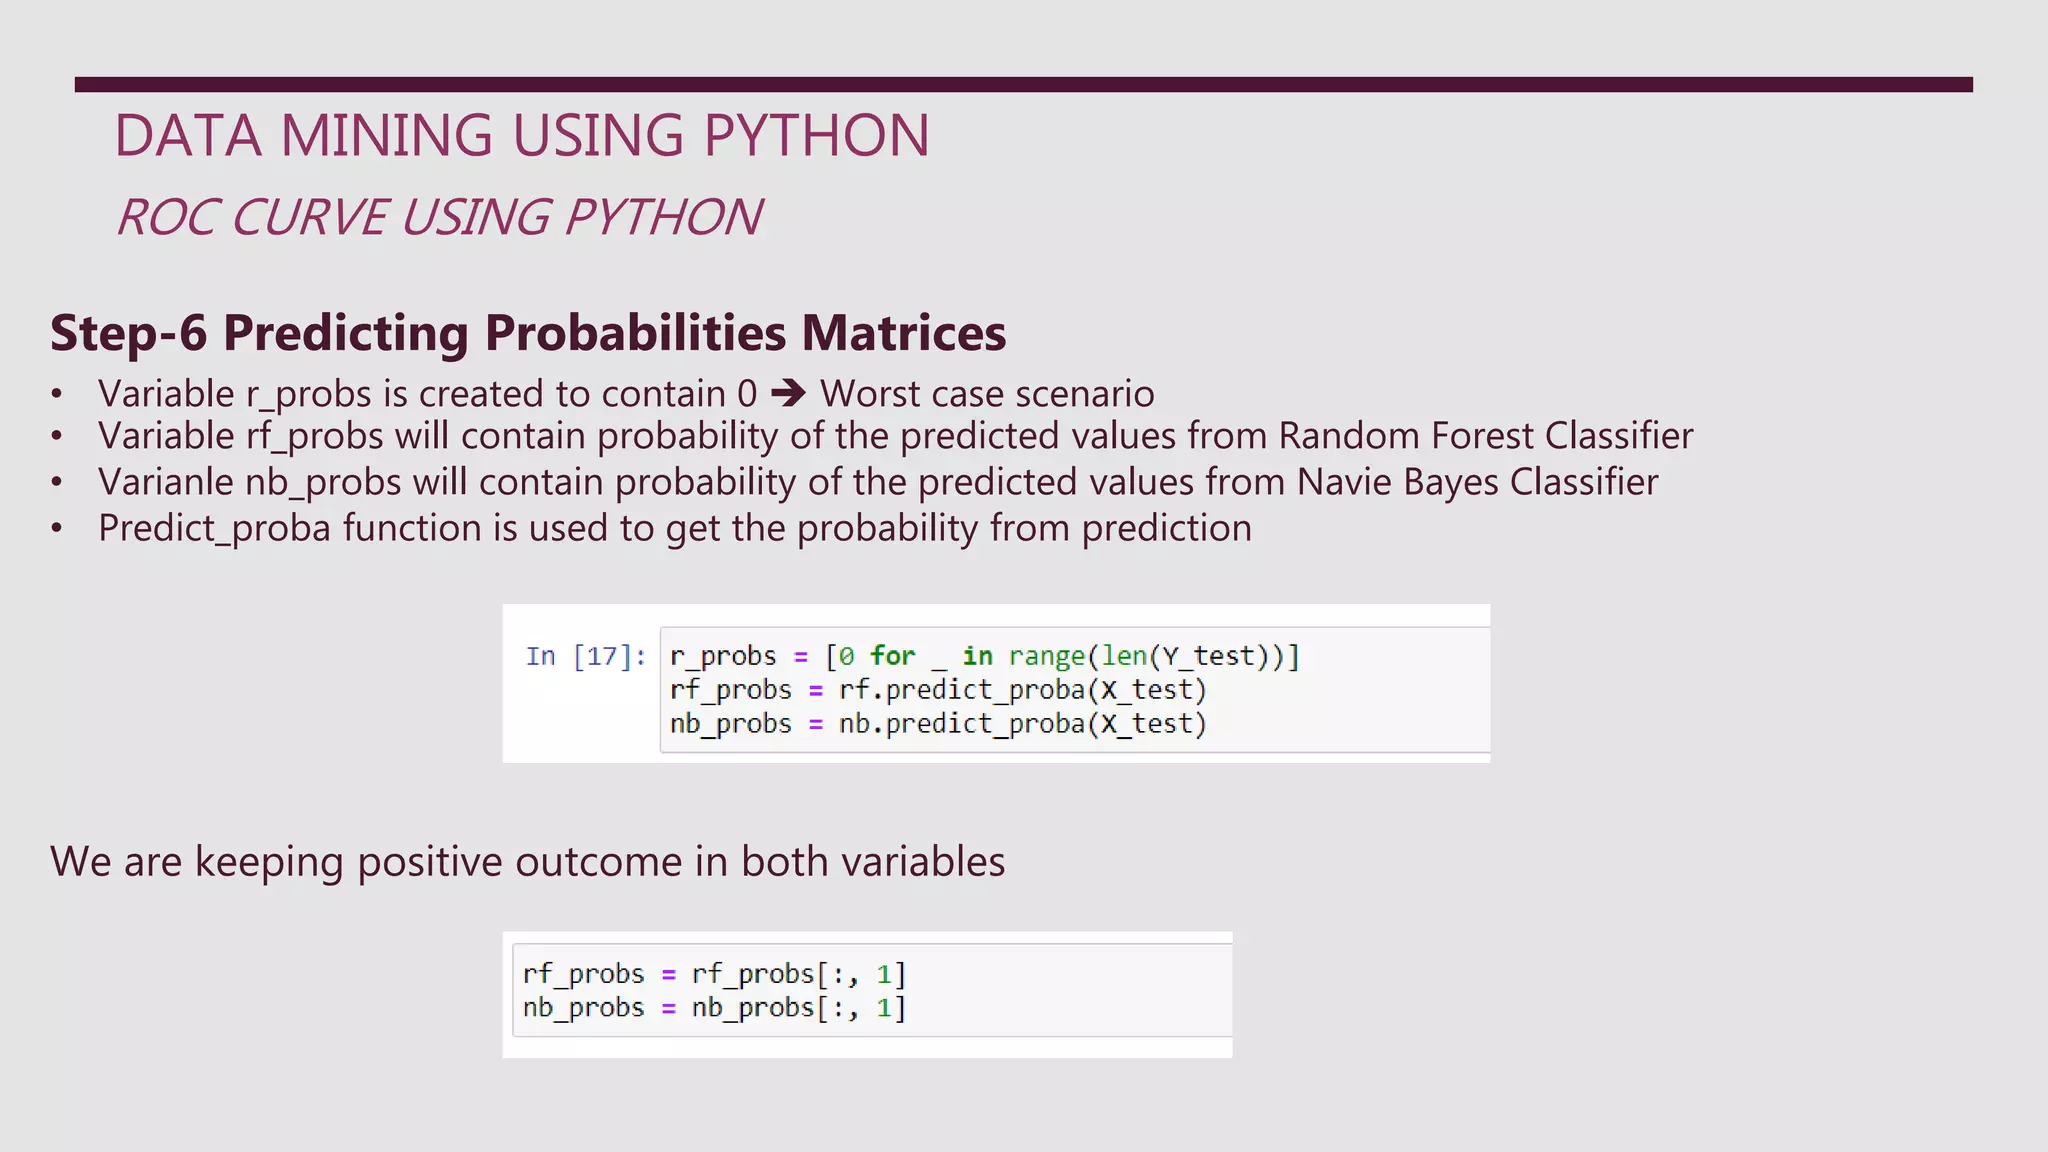
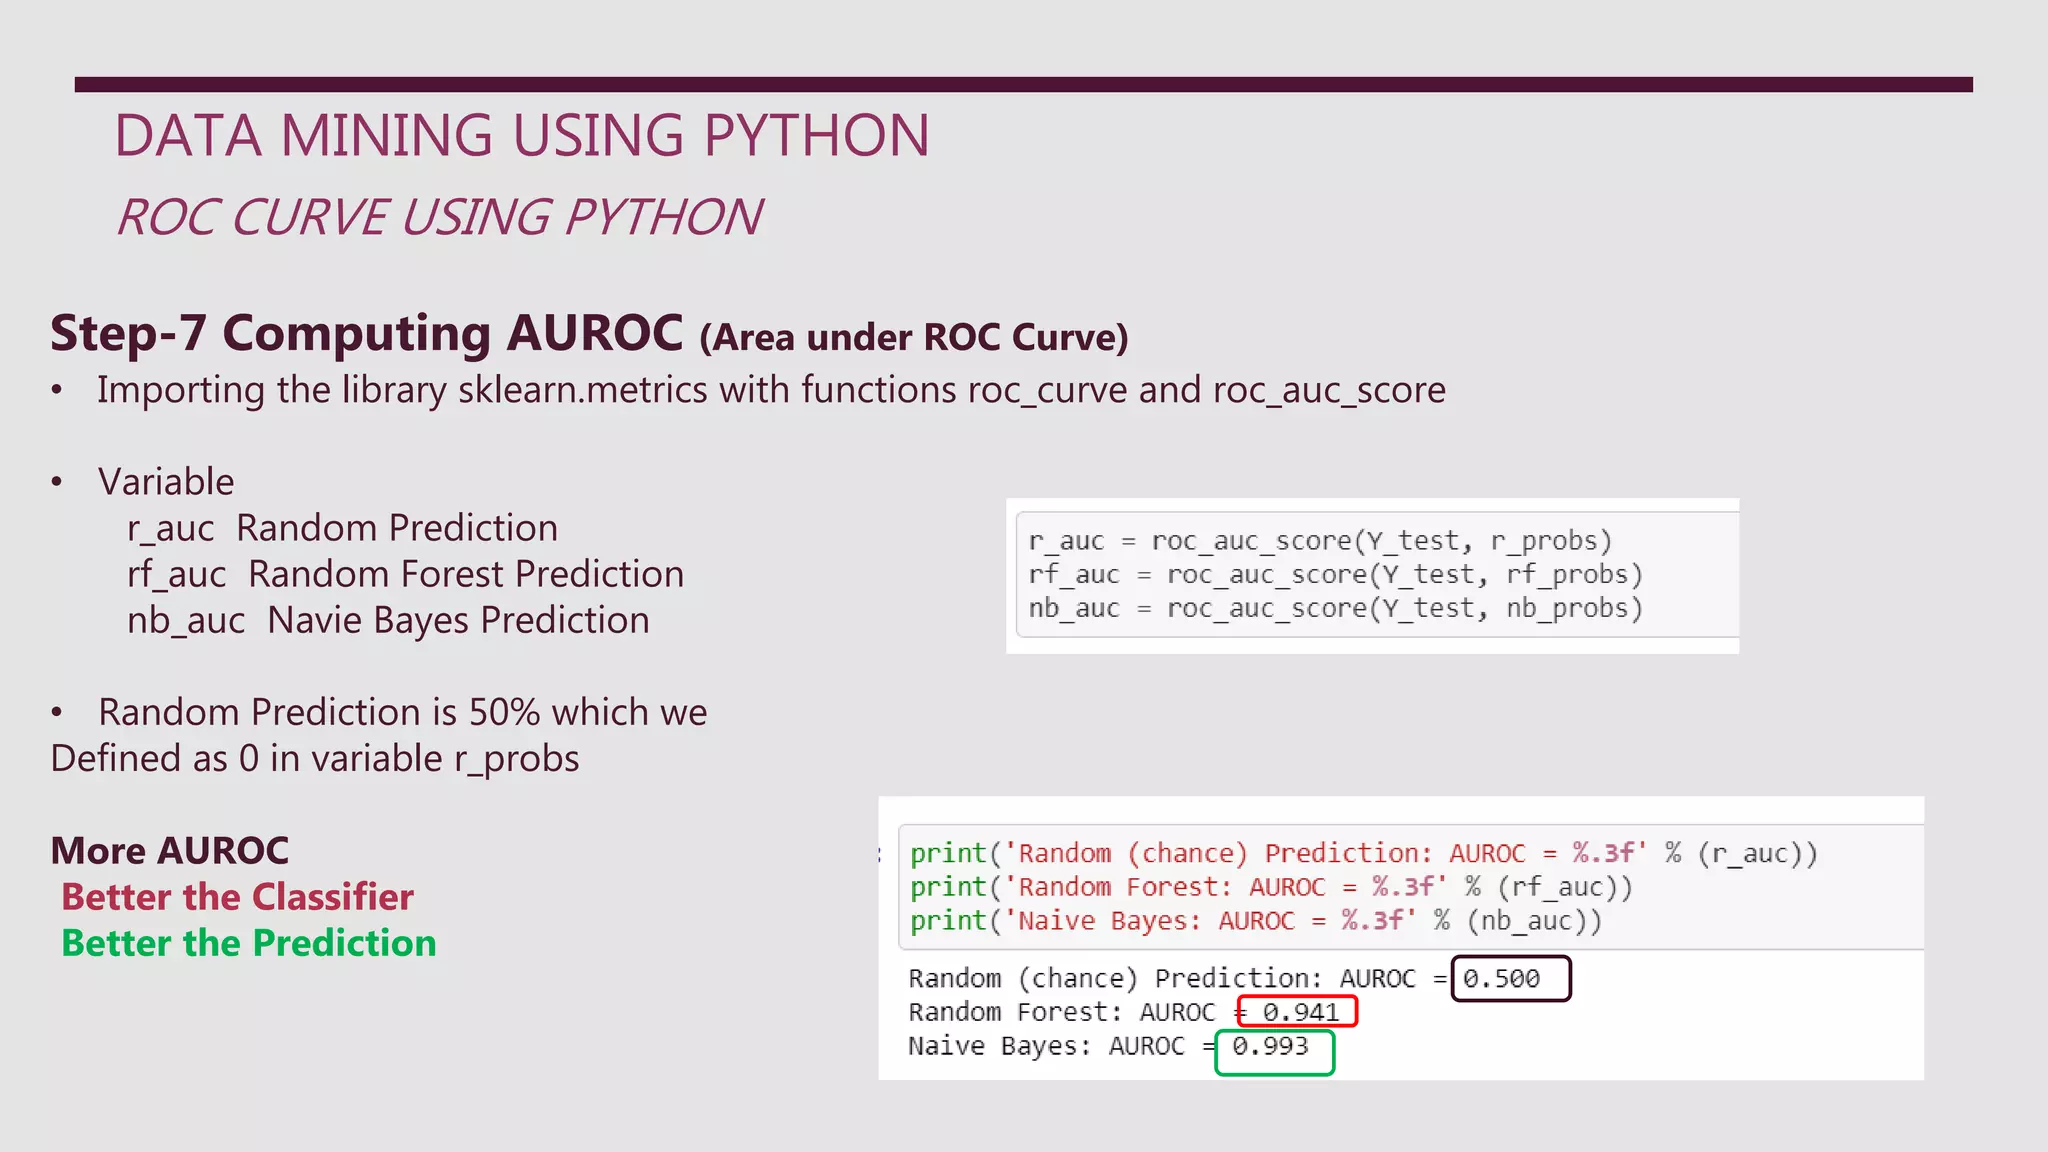
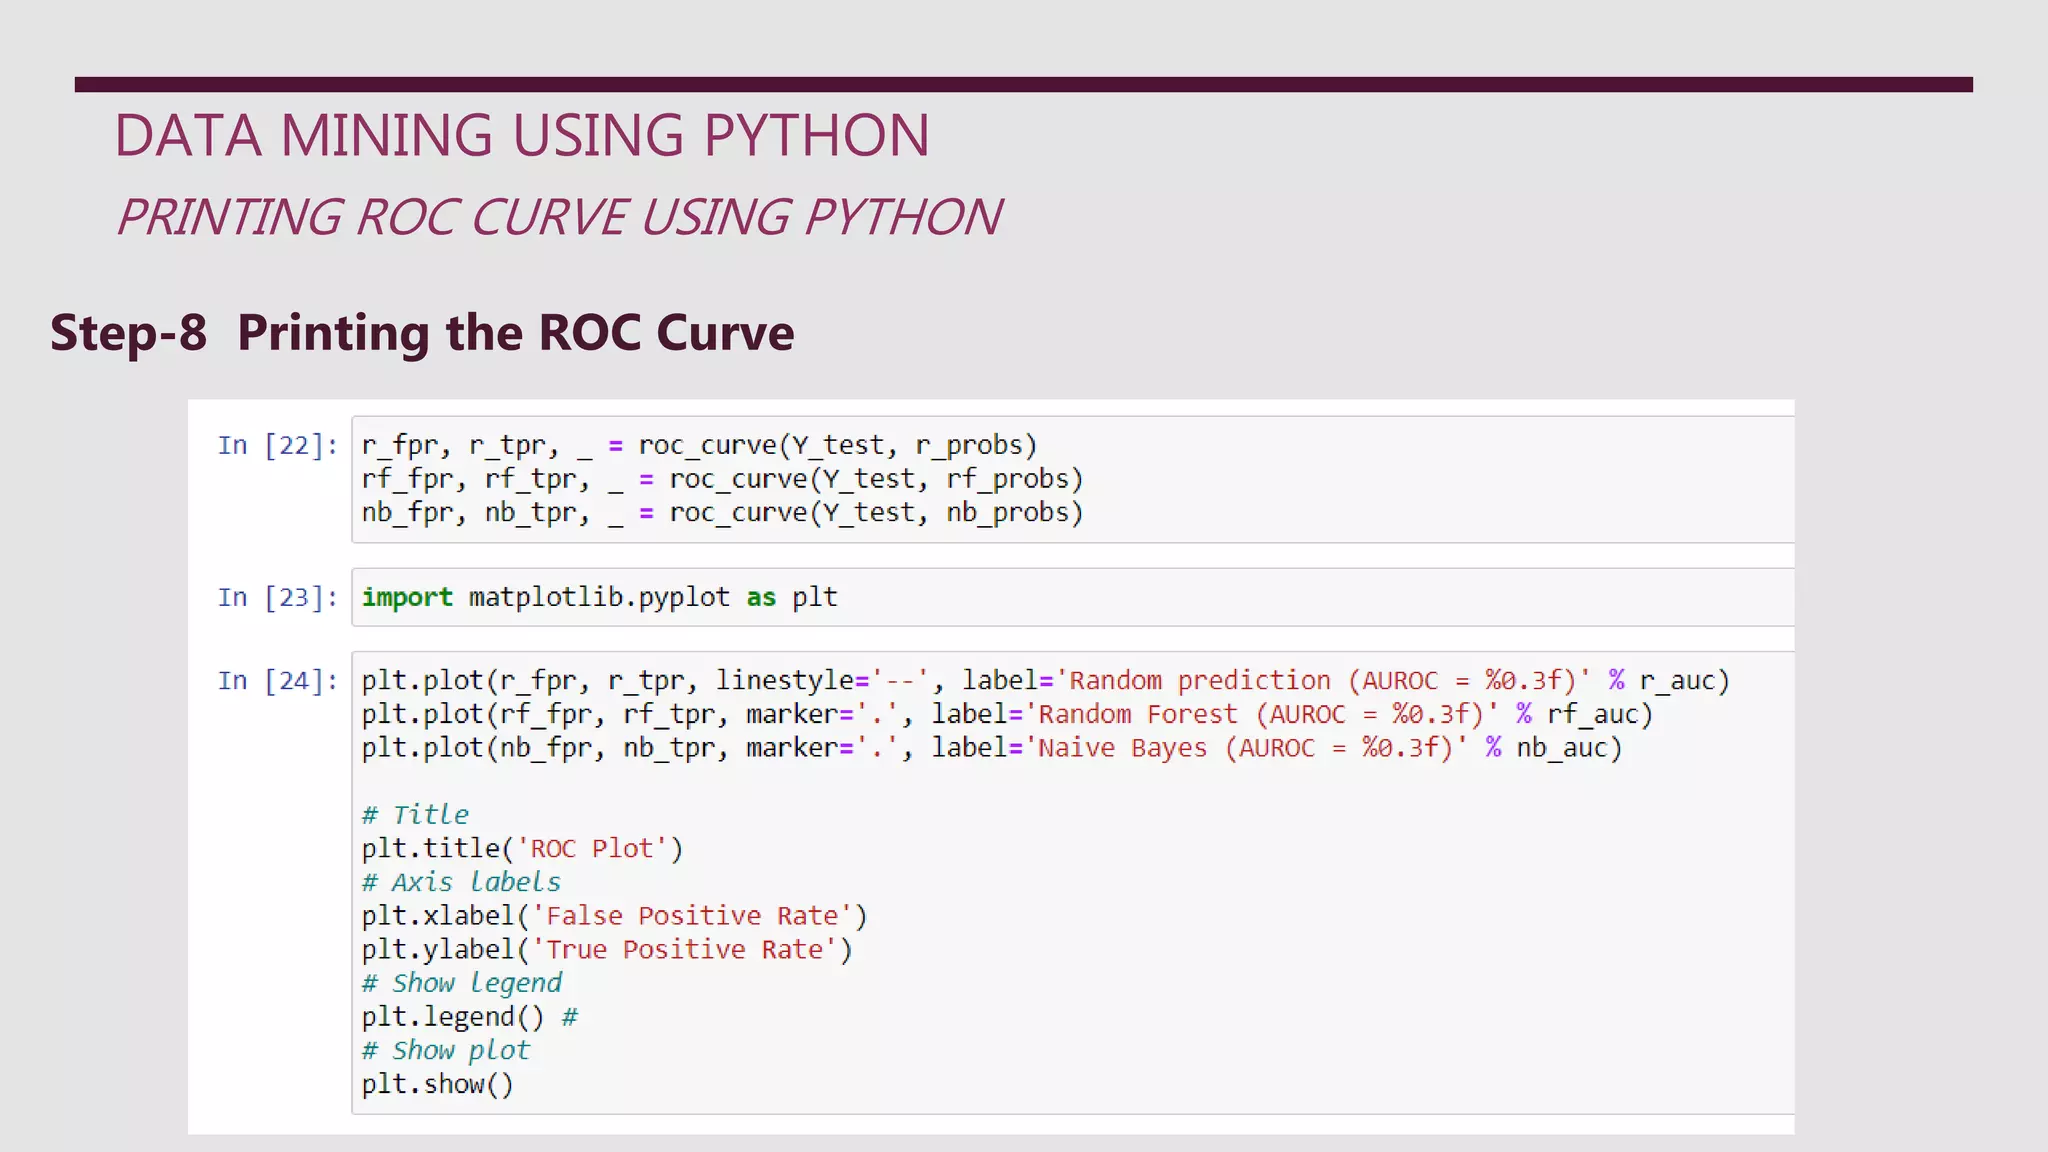
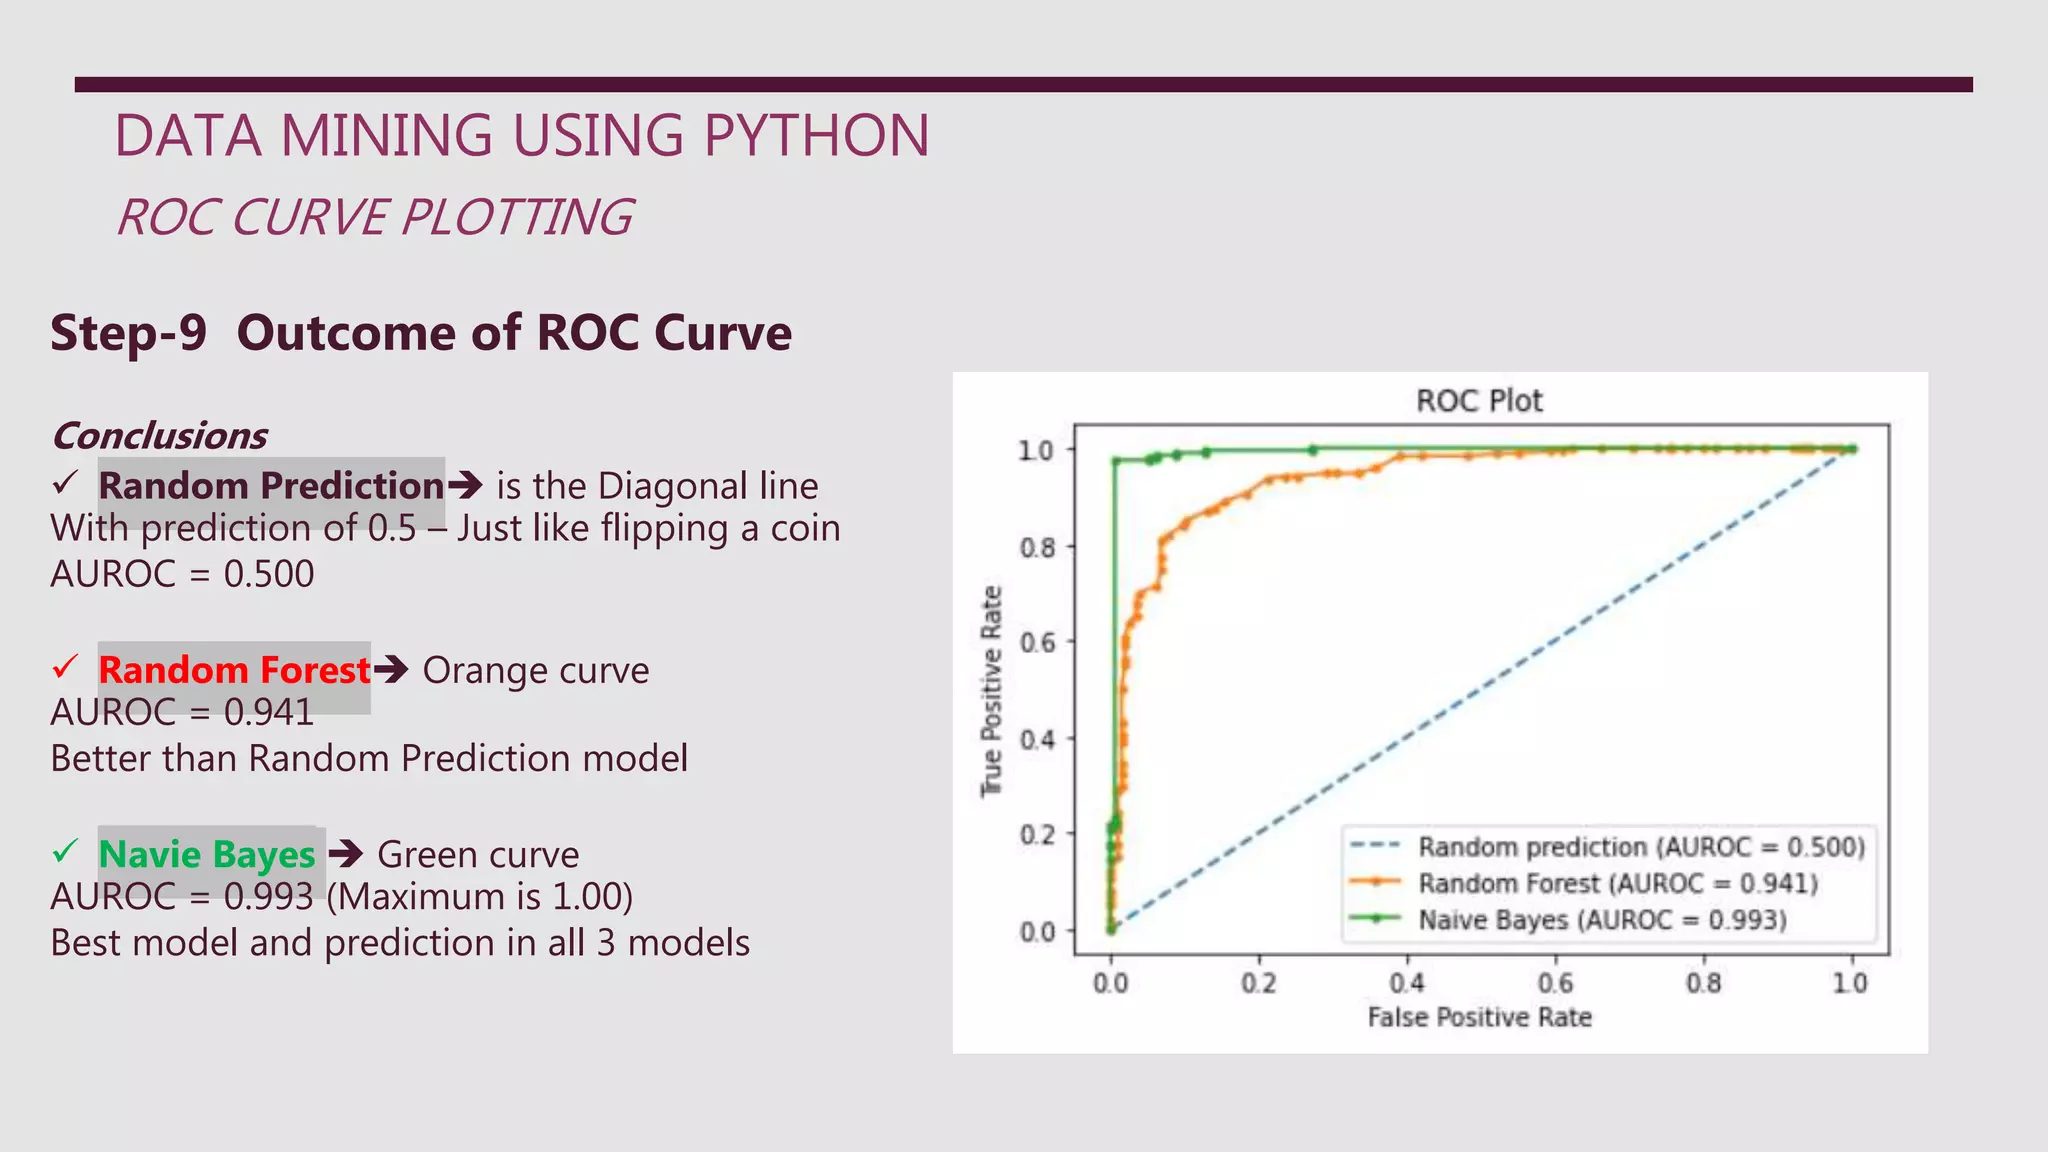
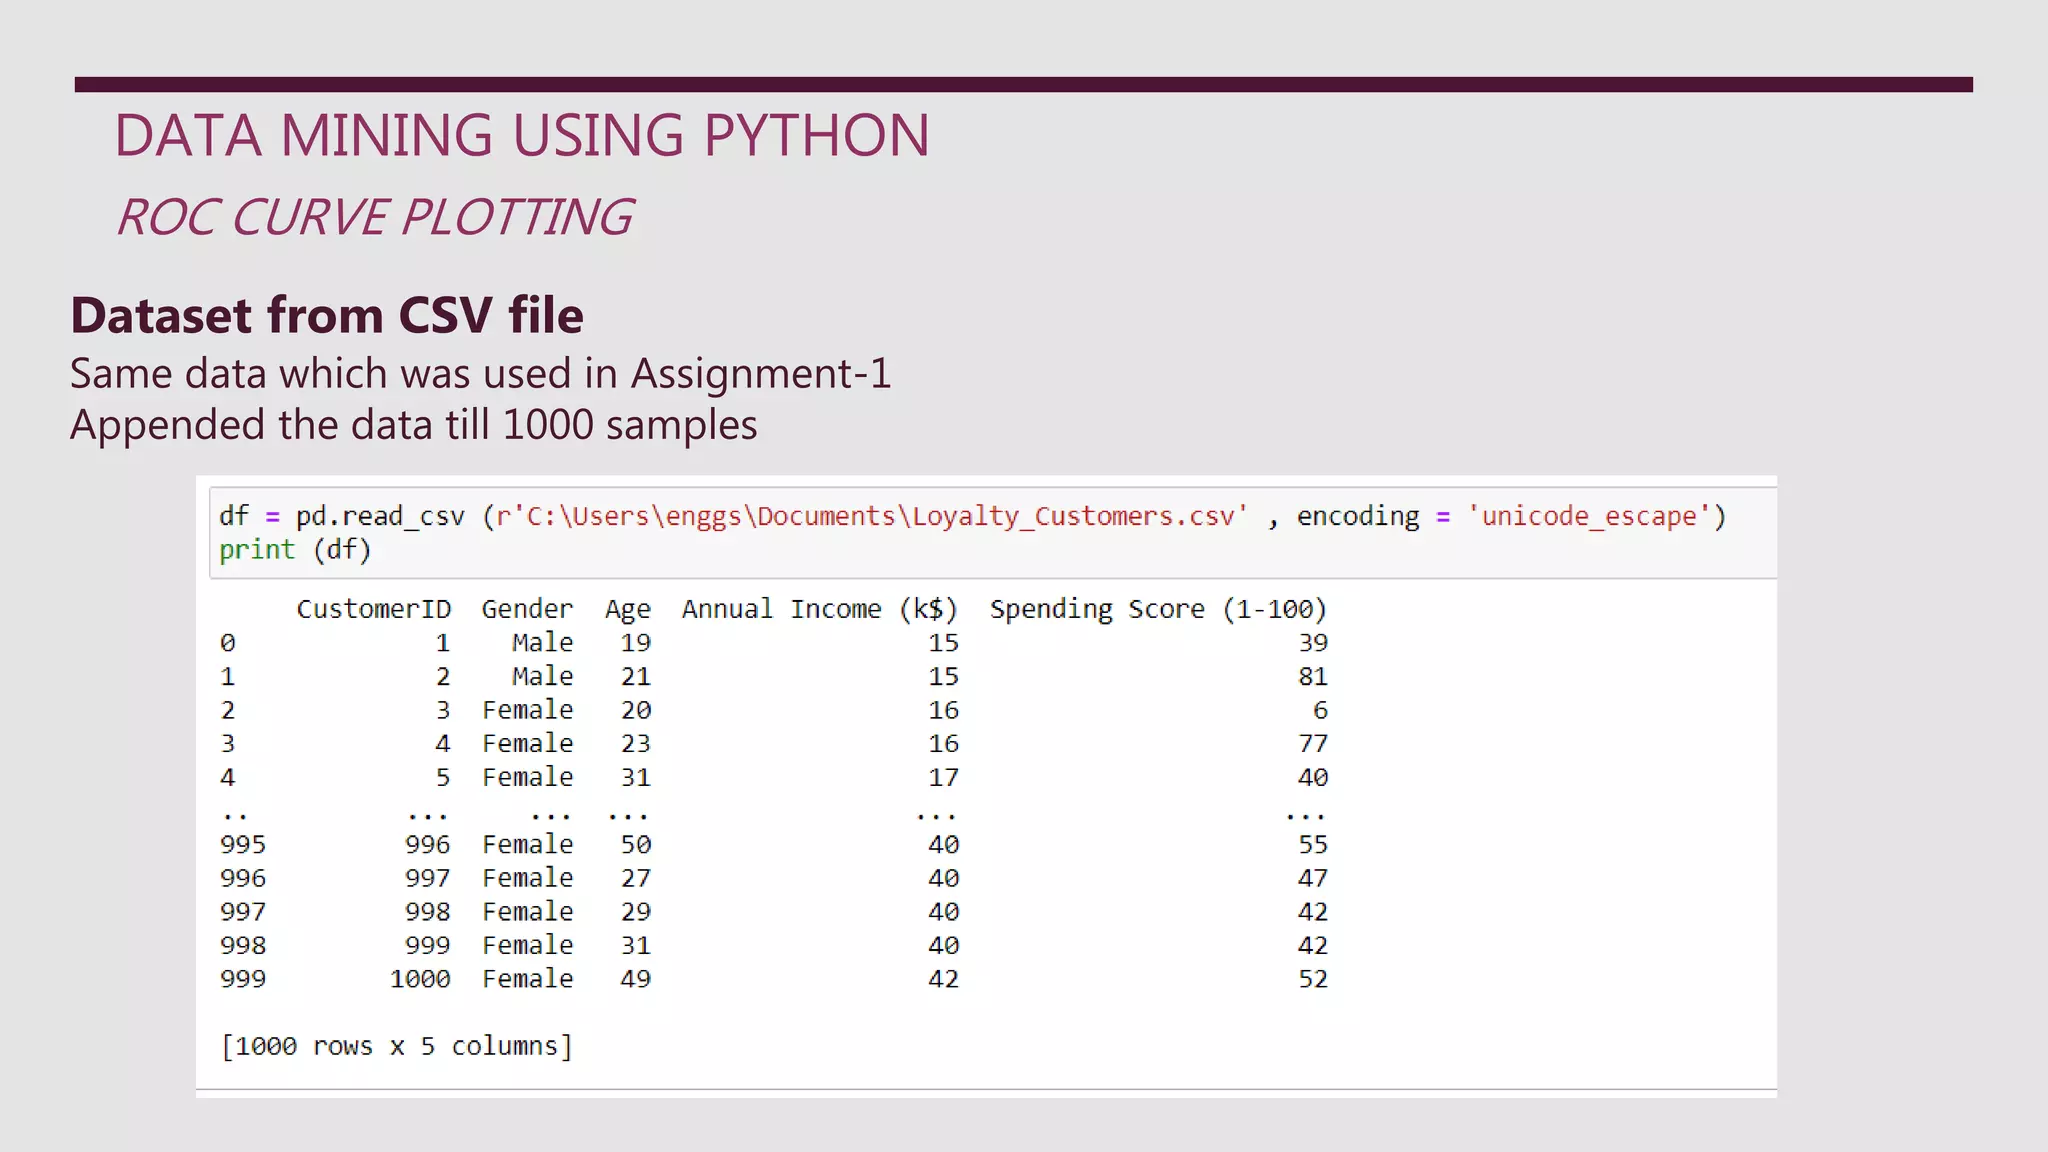
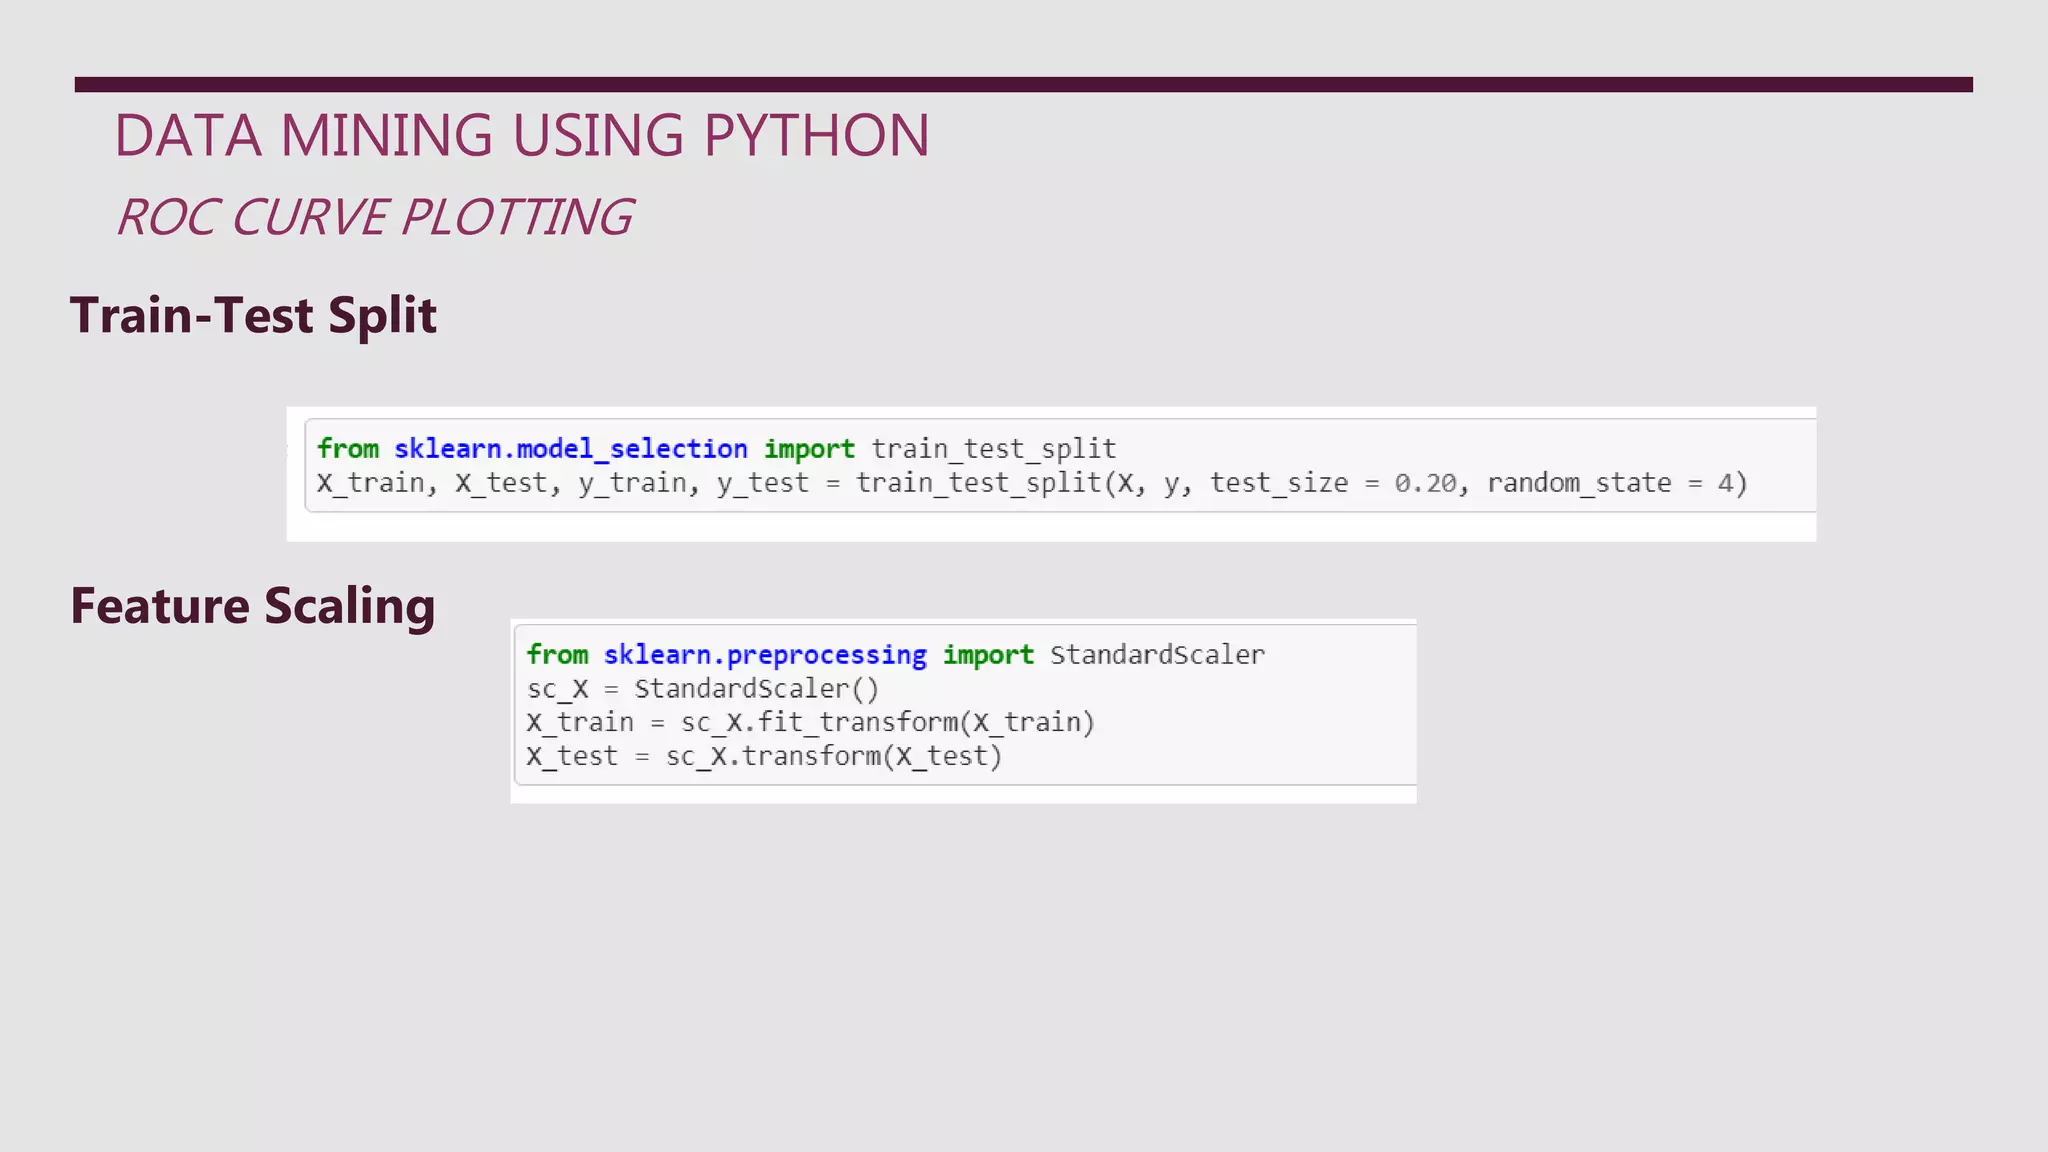
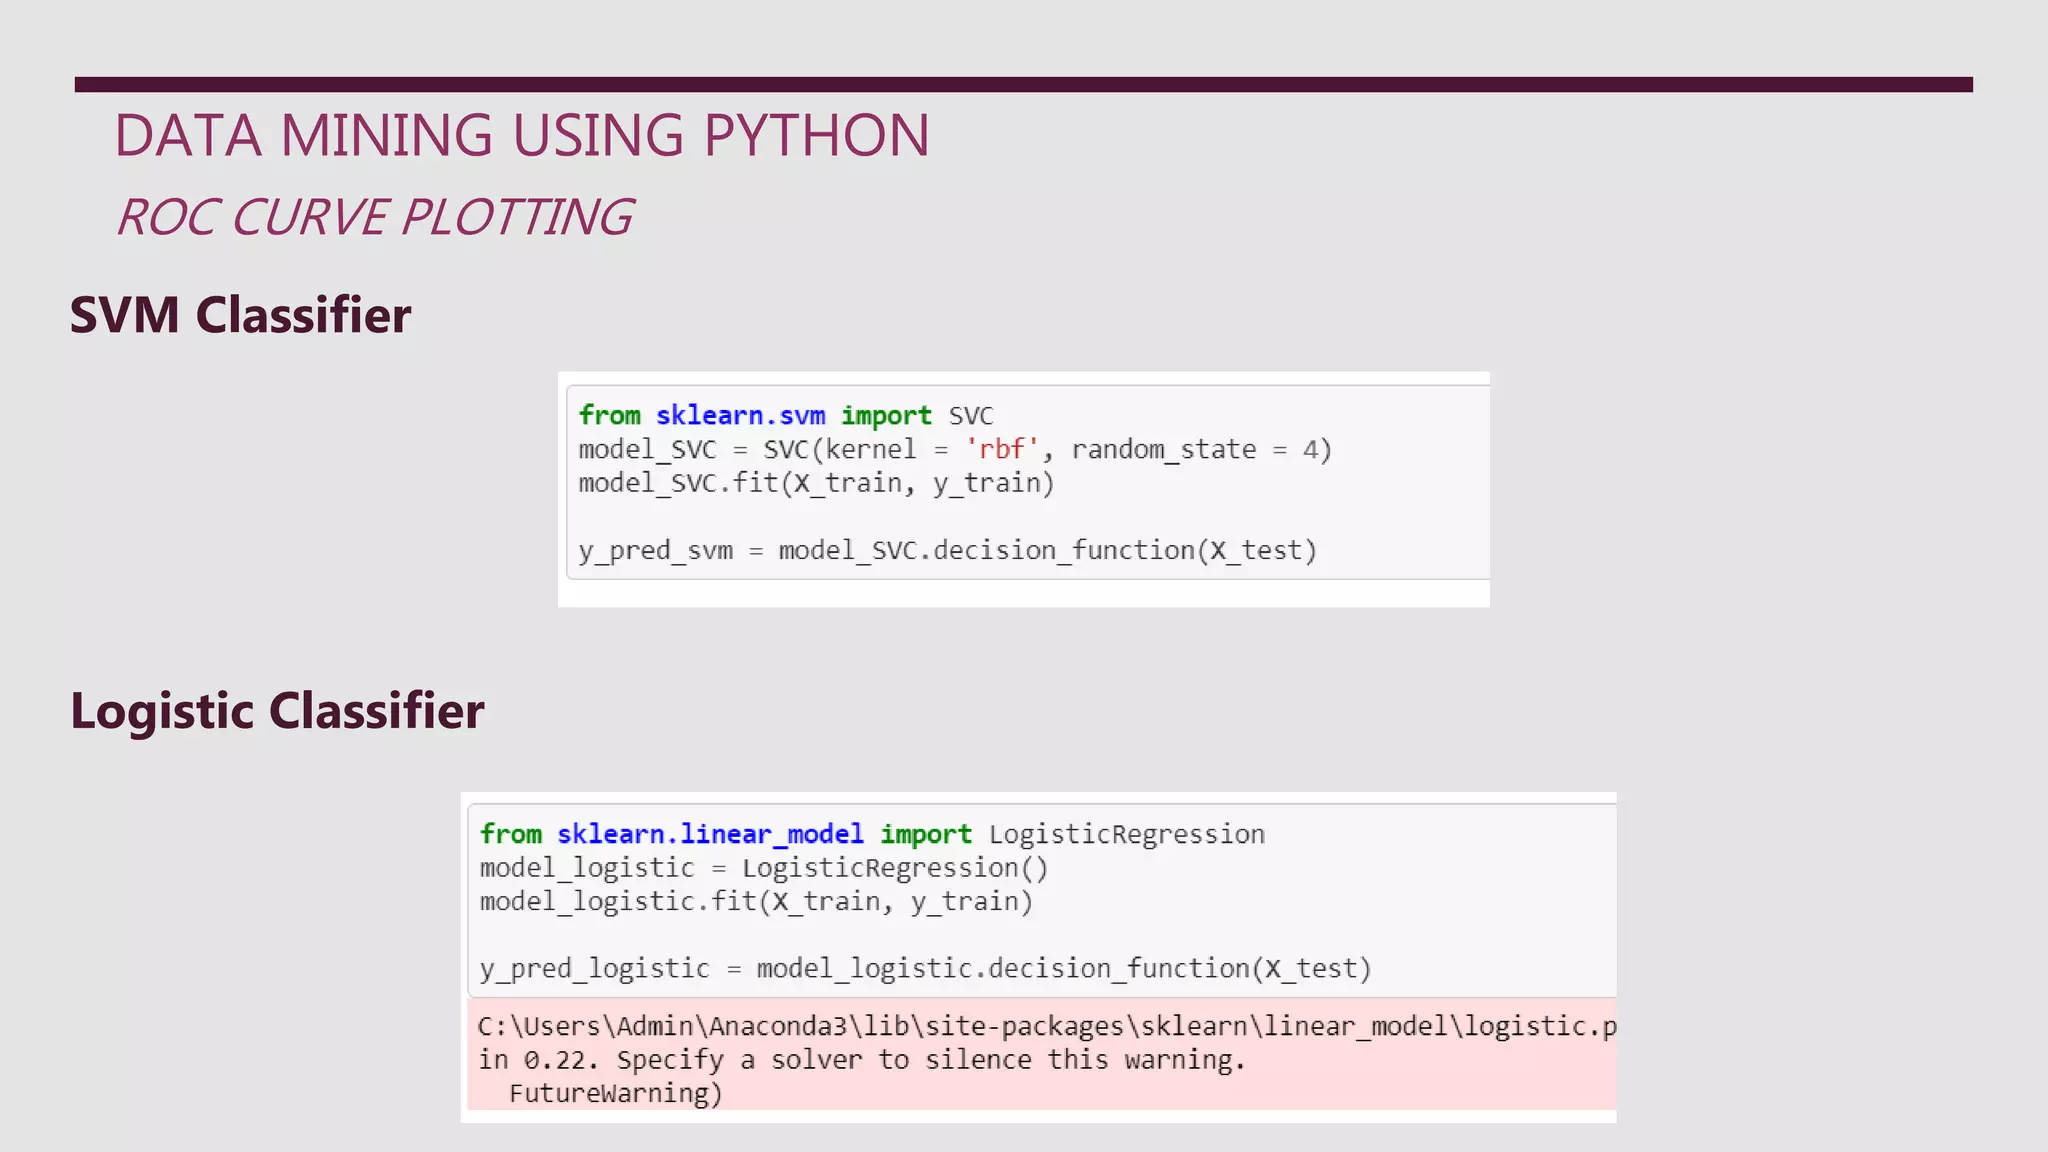
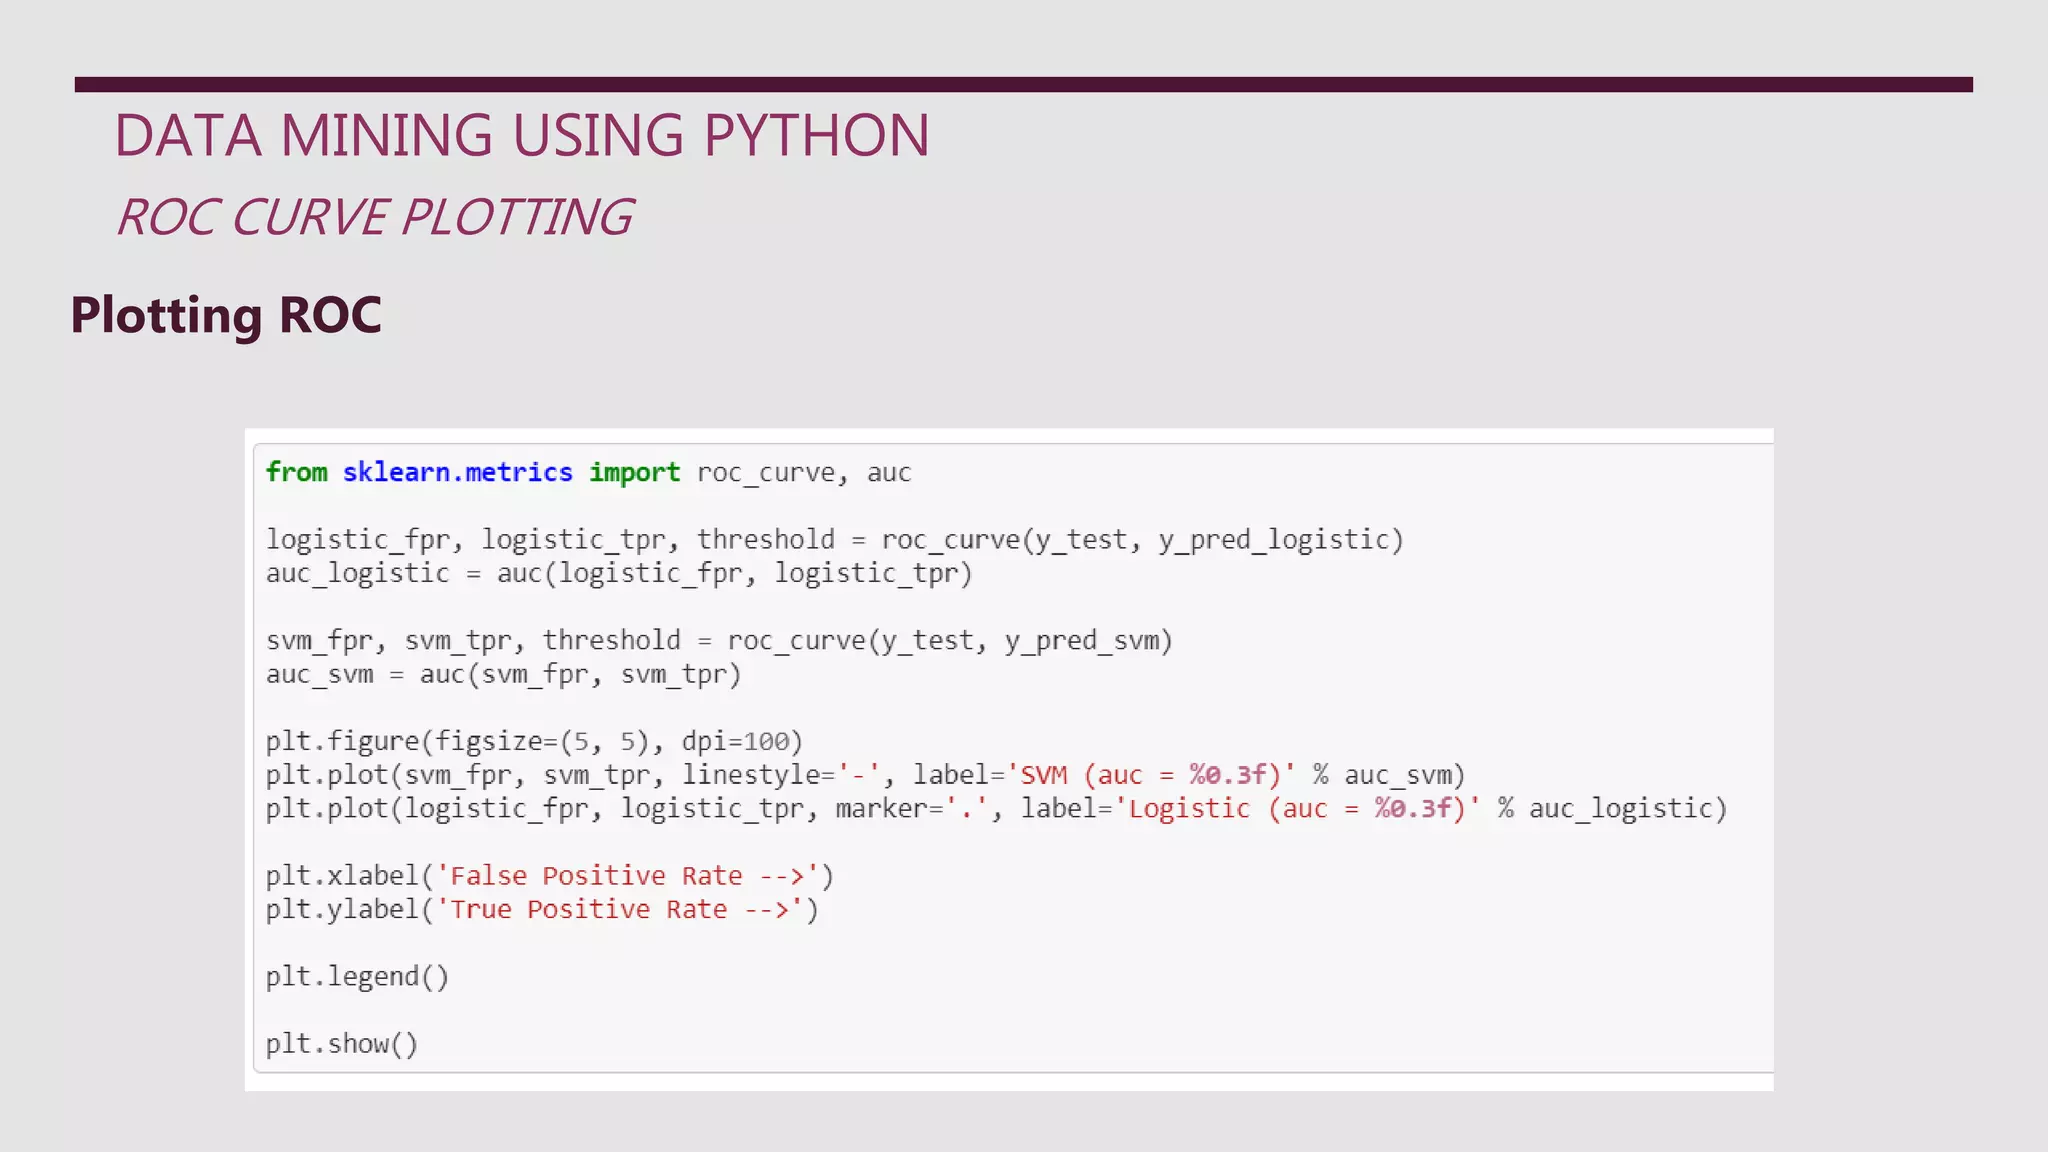
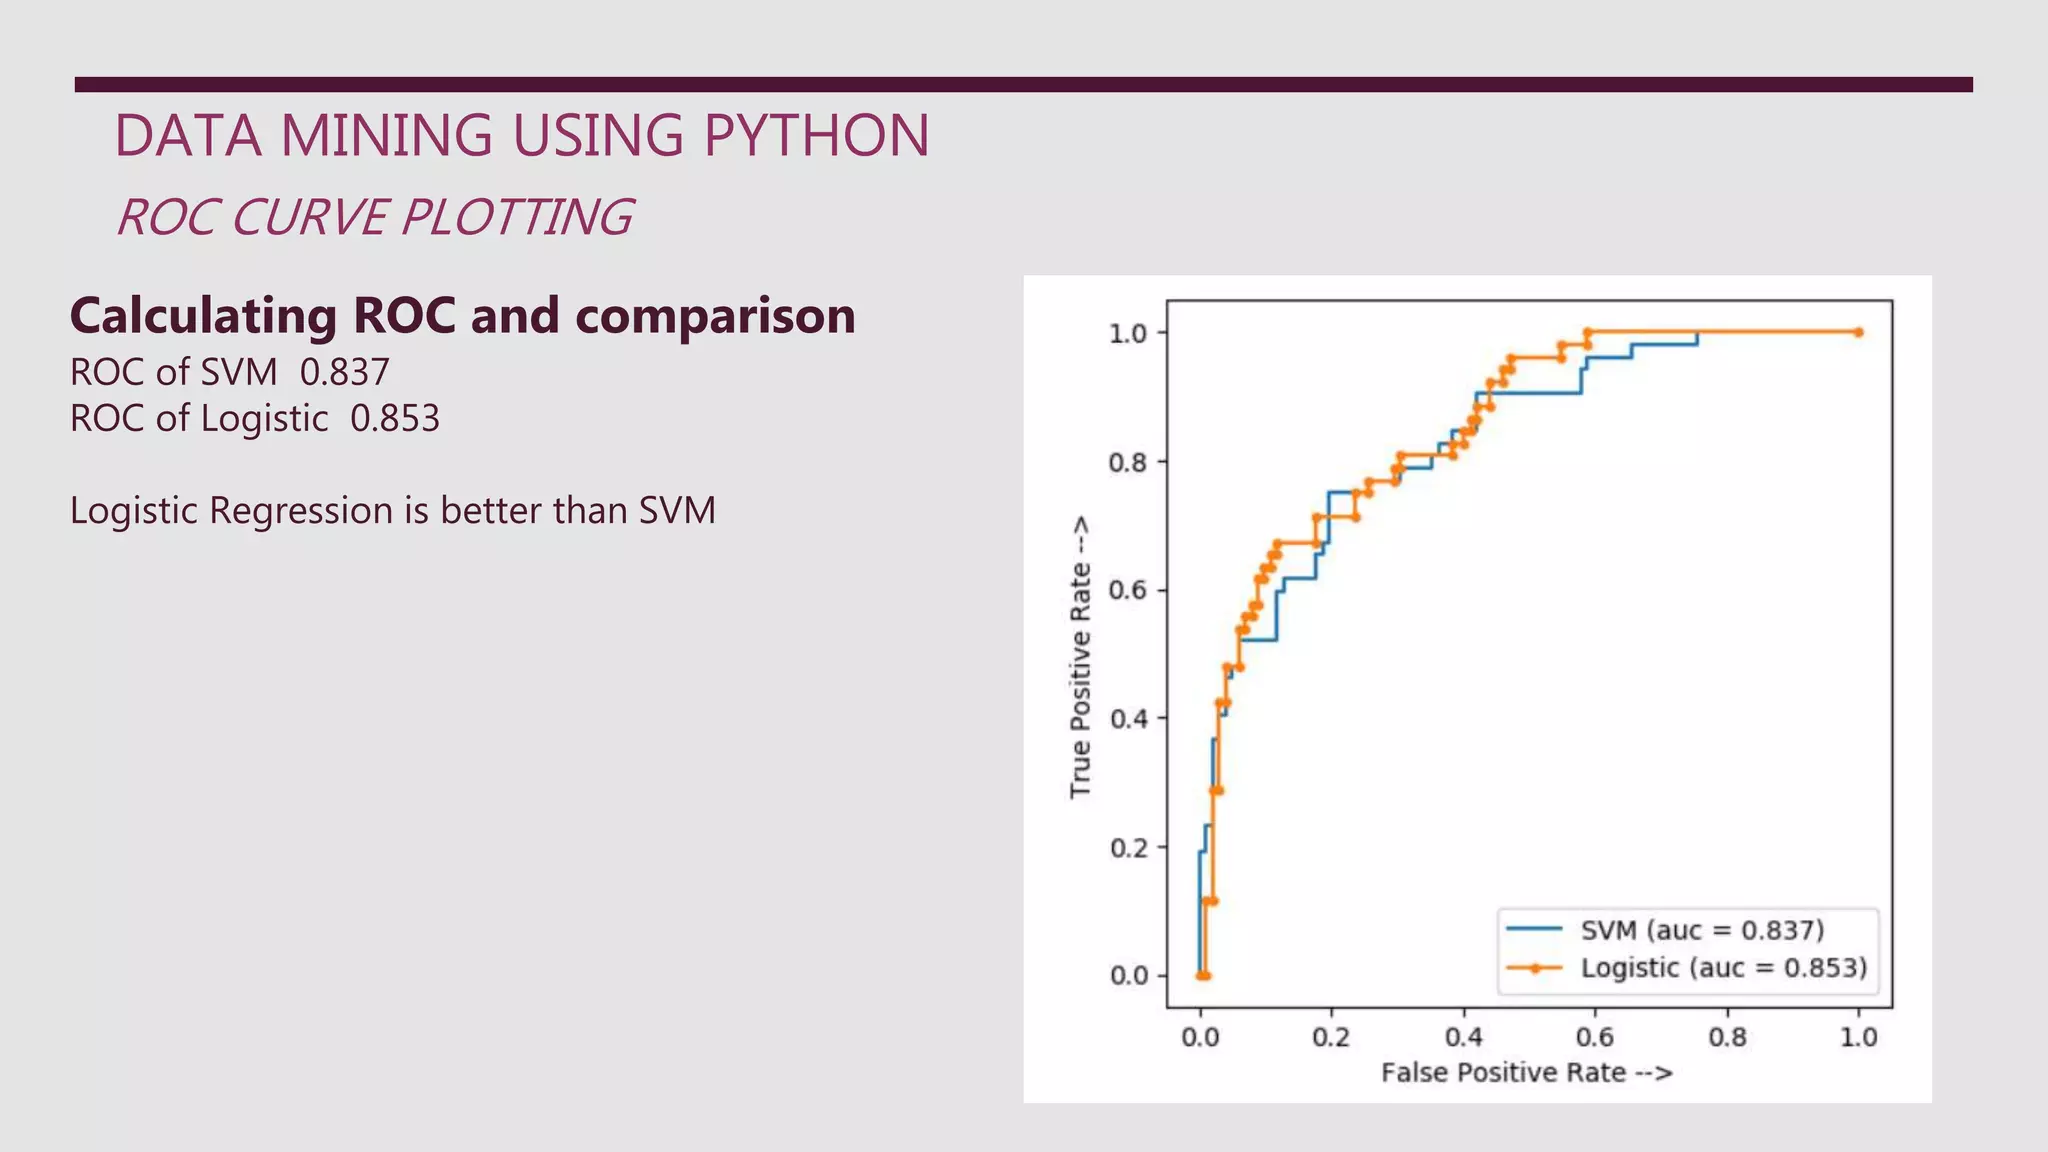

This document discusses Receiver Operating Characteristic (ROC) curves and how they are used to evaluate machine learning models and predictions. It explains that ROC curves plot the true positive rate against the false positive rate for different classification thresholds. The area under the ROC curve (AUC) indicates the model's ability to correctly classify examples, with higher values indicating better performance. The document then provides a Python example to generate ROC curves for random forest and naive Bayes classifiers trained on a synthetic dataset, finding that the naive Bayes model has the best performance with an AUC of 0.993.


![Sensor Fusion Study - Ch13. Nonlinear Kalman Filtering [Ahn Min Sung]](https://cdn.slidesharecdn.com/ss_thumbnails/nonlinearkalmanfiltering200717-200815094232-thumbnail.jpg?width=640&height=640&fit=bounds)