Project Management
Tools andTechniques
Project management tools and techniques
assist project managers and their teams in
various aspects of project management.
1. Bar chats and milestone charts
2. Network Diagram
3.
1. Bar Chartsand
Milestone Charts
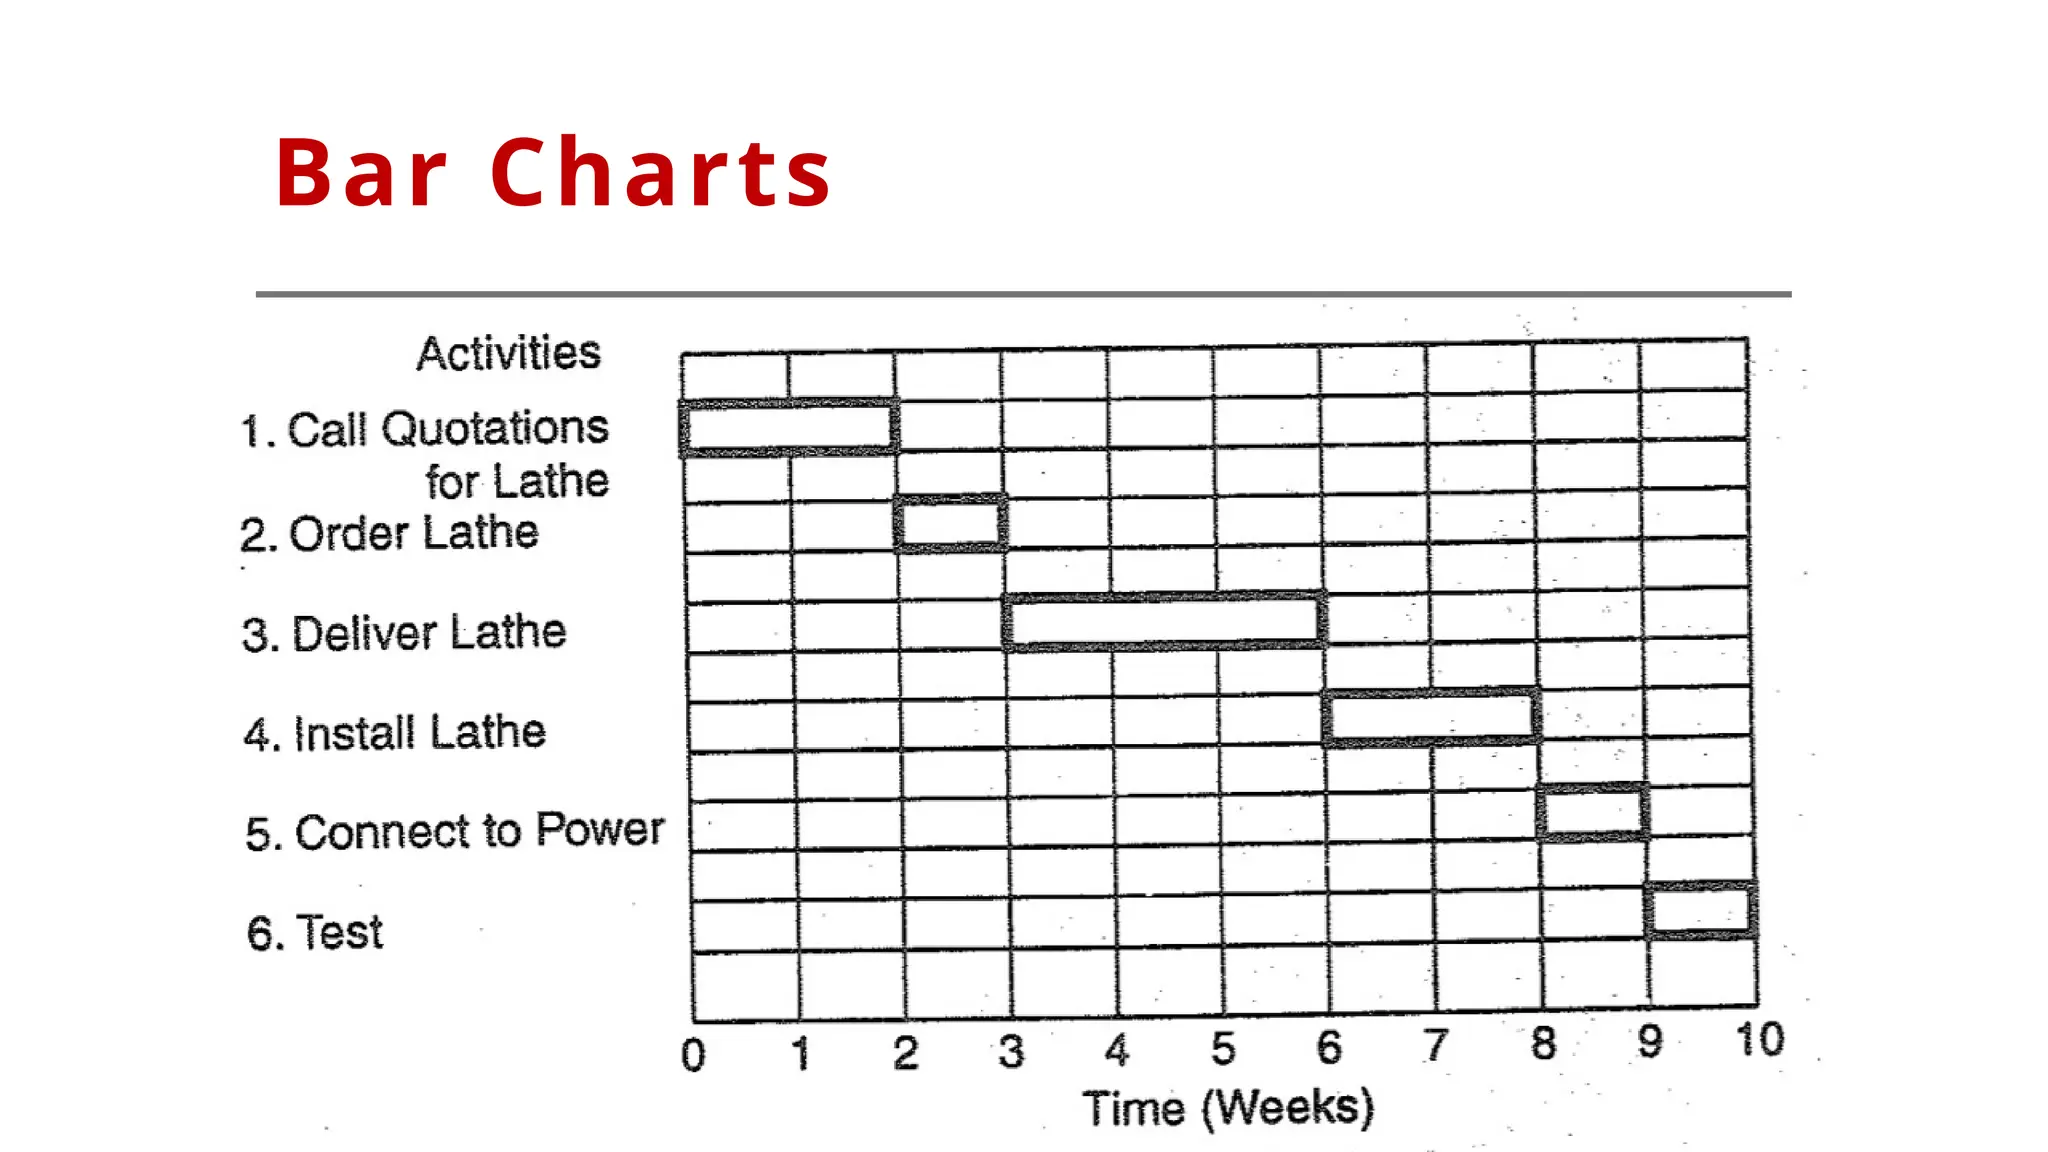
Gantt charts are "time" oriented.
Activities are graphically shown on a
calendar time scale, used primarily for
small projects.
Bars show an activities duration in its
entirety, regardless of its dependency on
other activities.
Effortless to construct, and are brief in
format.
4.
Bar Charts
Advantages
1. Itis very easy and simple to construct.
2. It is easy to understand.
3. Simplicity of updating.
4. It is very easy to show the progress of work and programme of
work.
5. Easy to incorporate resource plan in terms of the plant schedule,
material schedule and labour schedule required for the project.
5.
Bar Charts
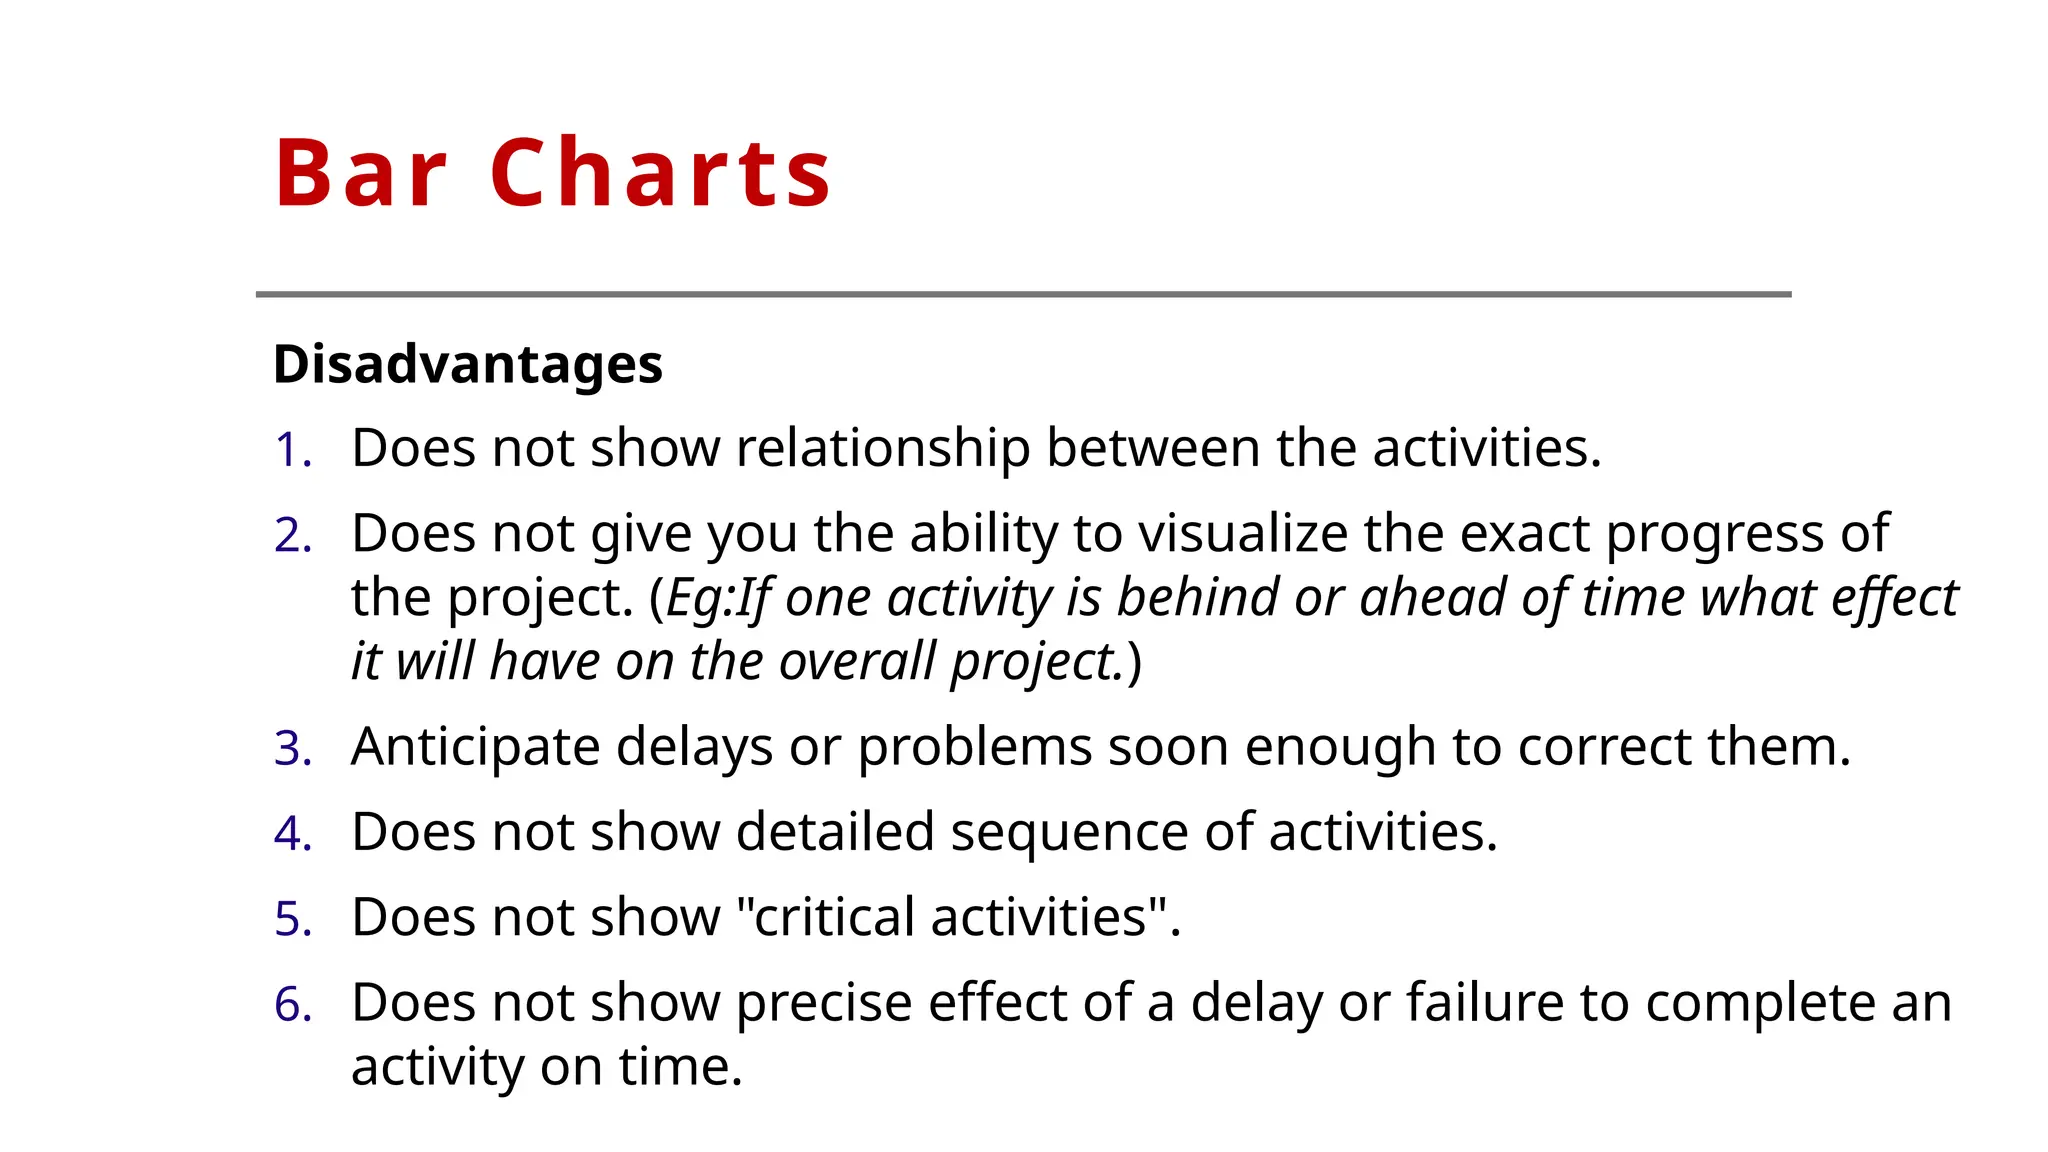
Disadvantages
1. Doesnot show relationship between the activities.
2. Does not give you the ability to visualize the exact progress of
the project. (Eg:If one activity is behind or ahead of time what effect
it will have on the overall project.)
3. Anticipate delays or problems soon enough to correct them.
4. Does not show detailed sequence of activities.
5. Does not show "critical activities".
6. Does not show precise effect of a delay or failure to complete an
activity on time.
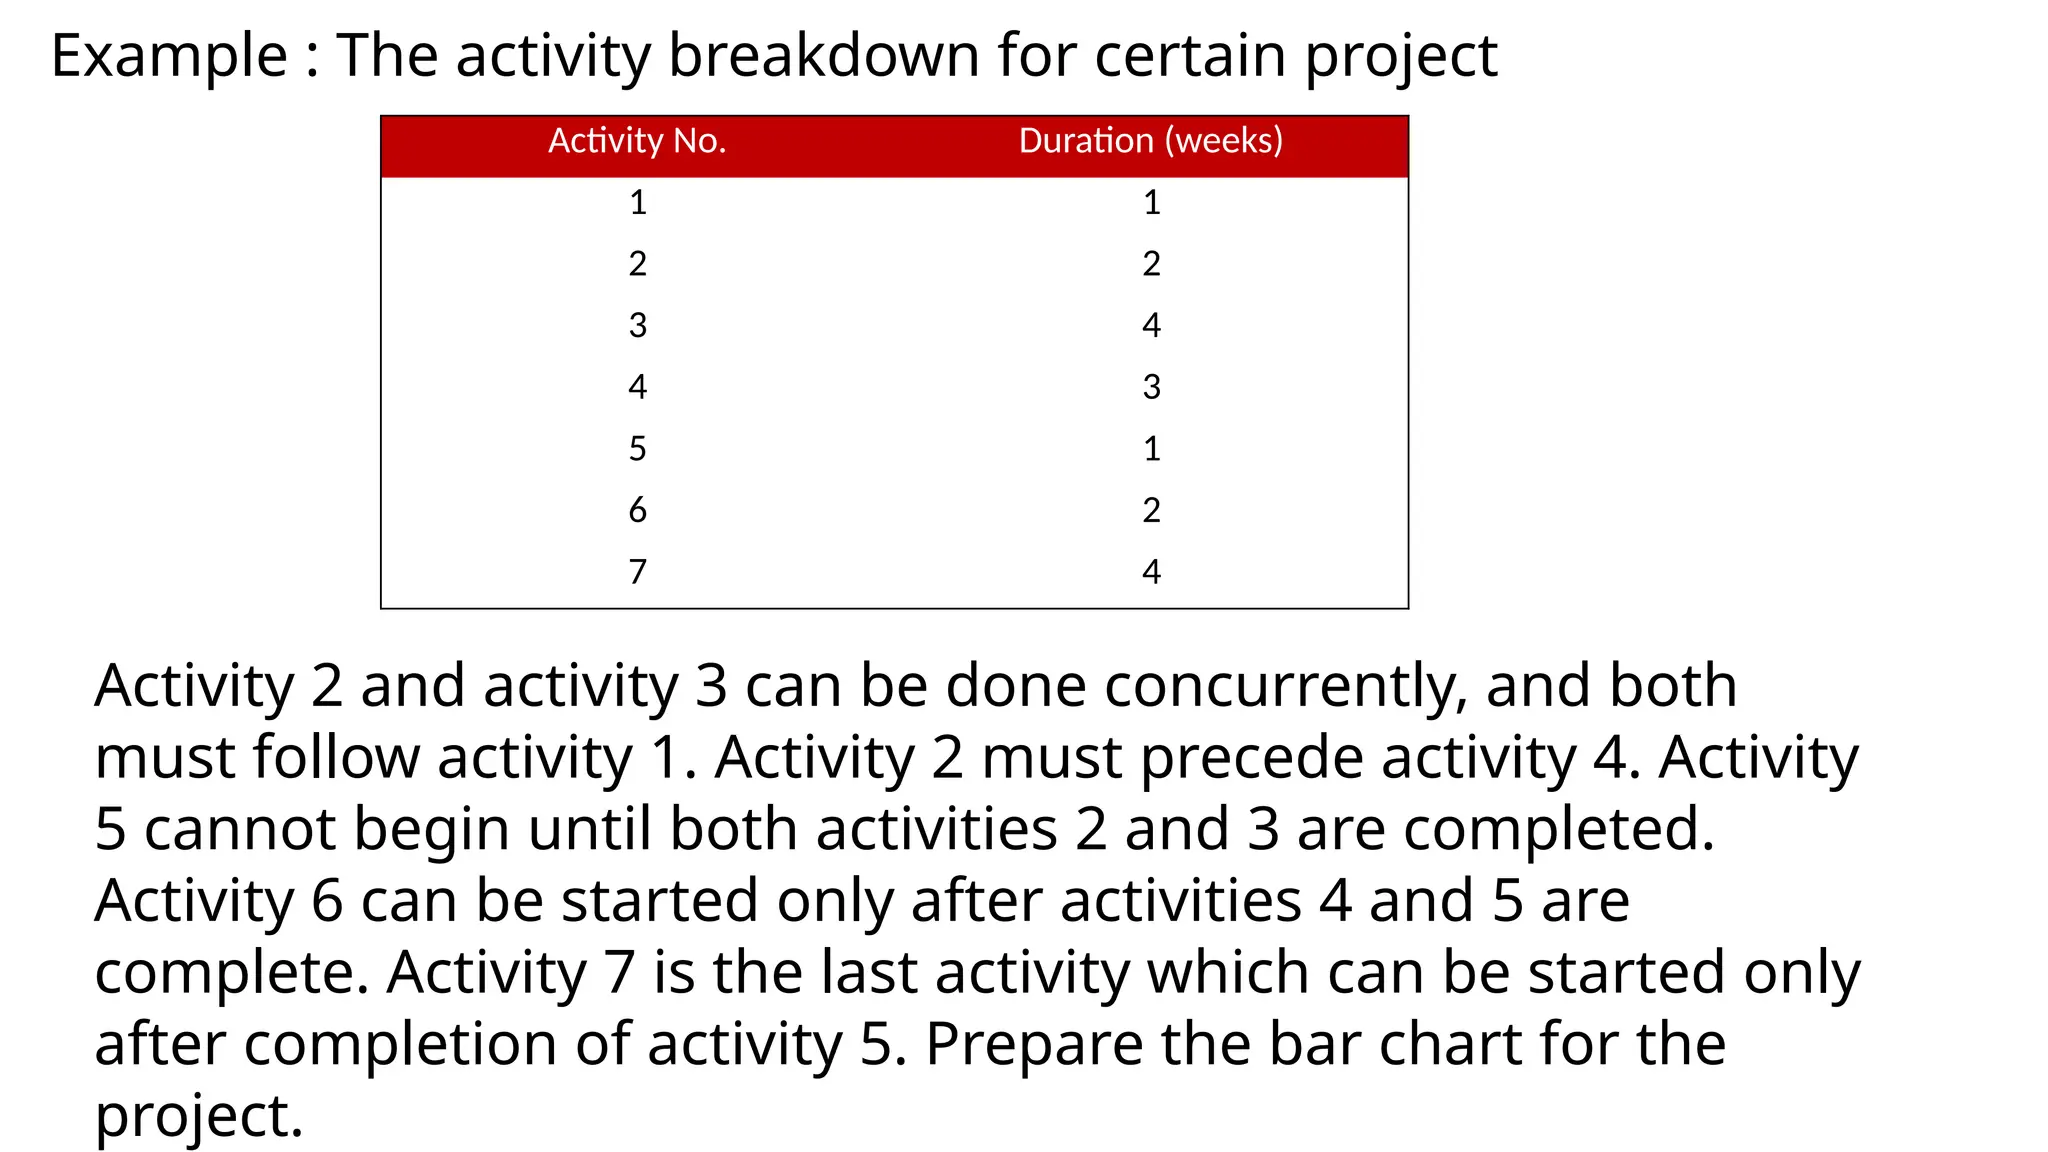
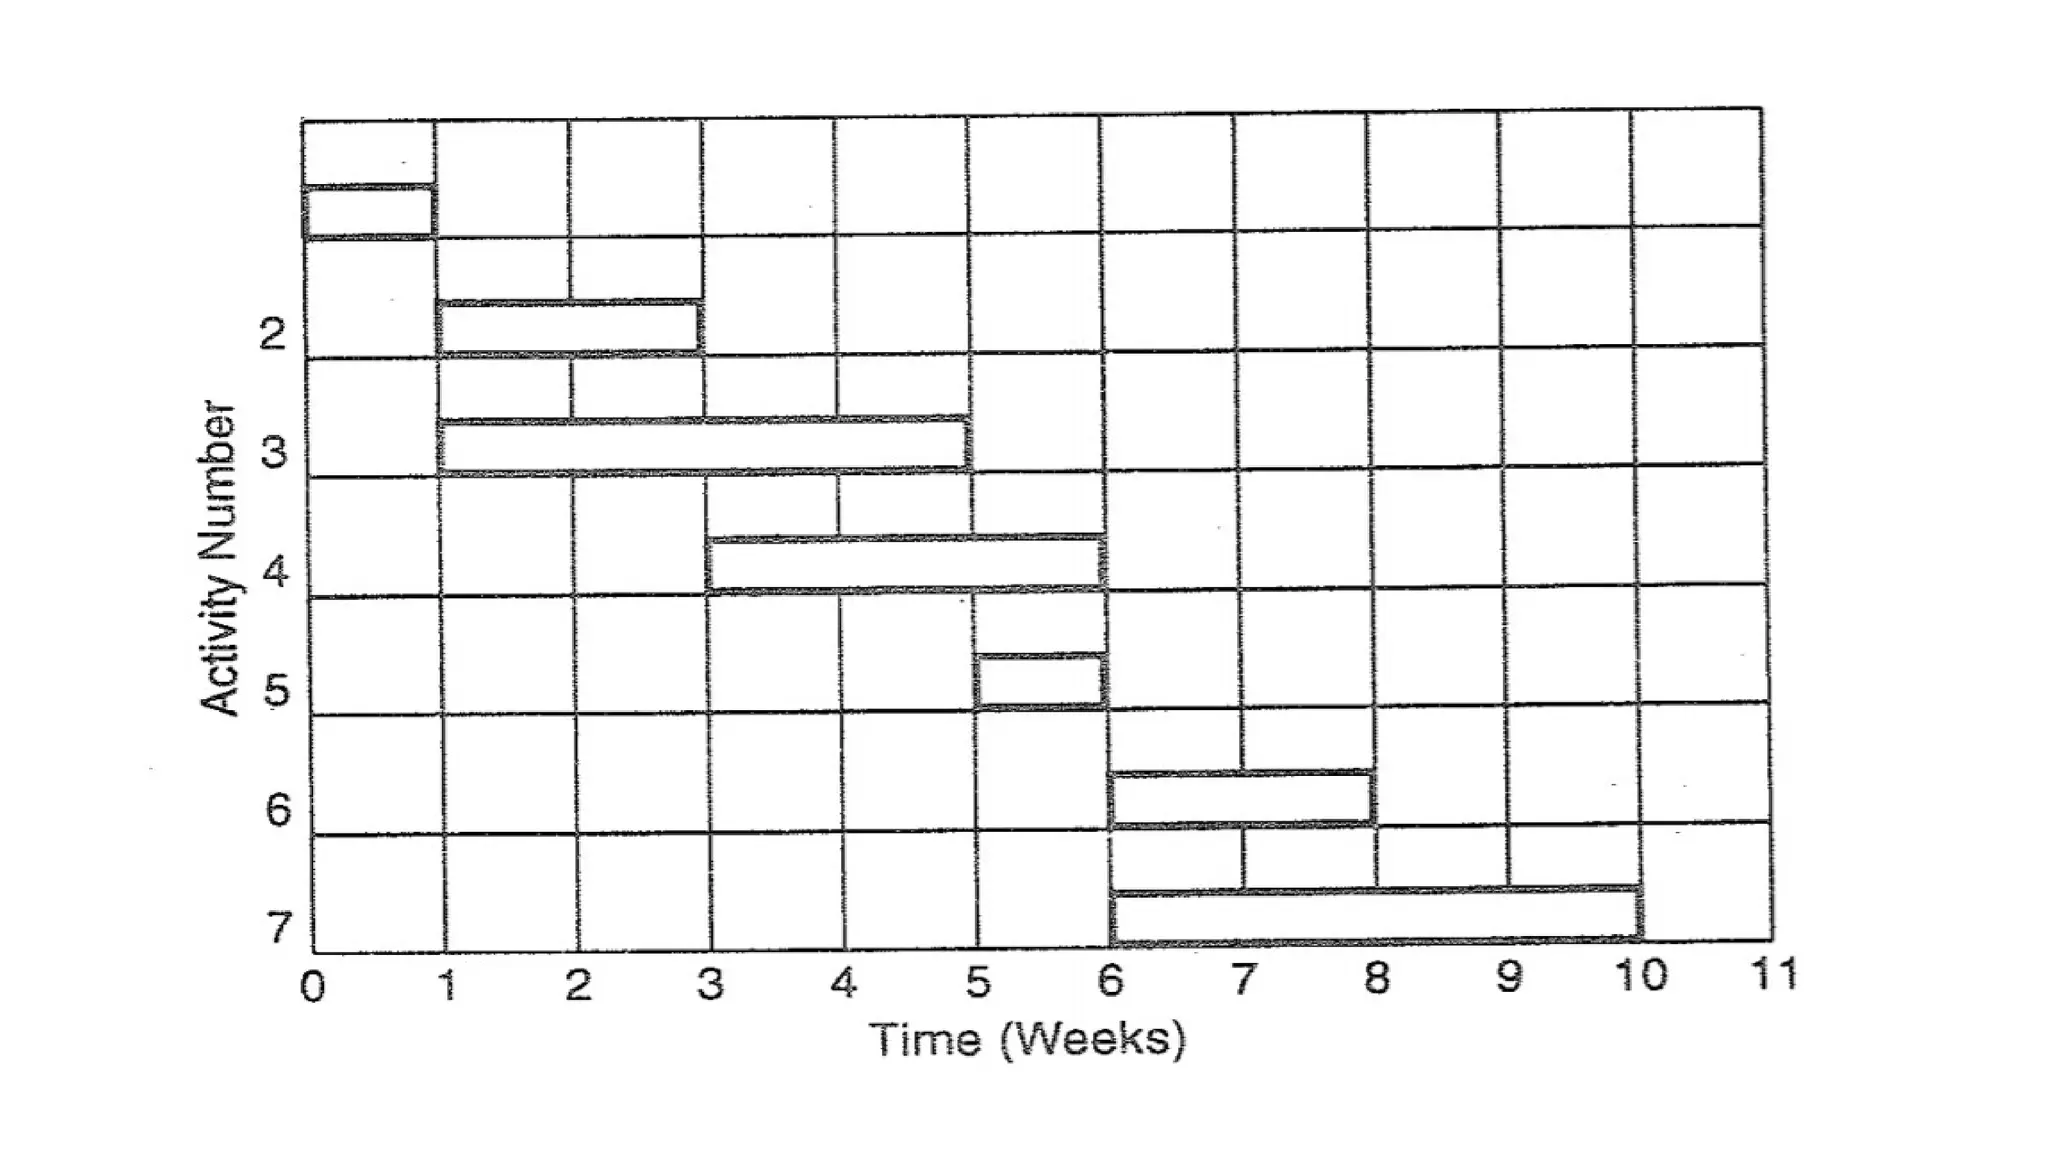
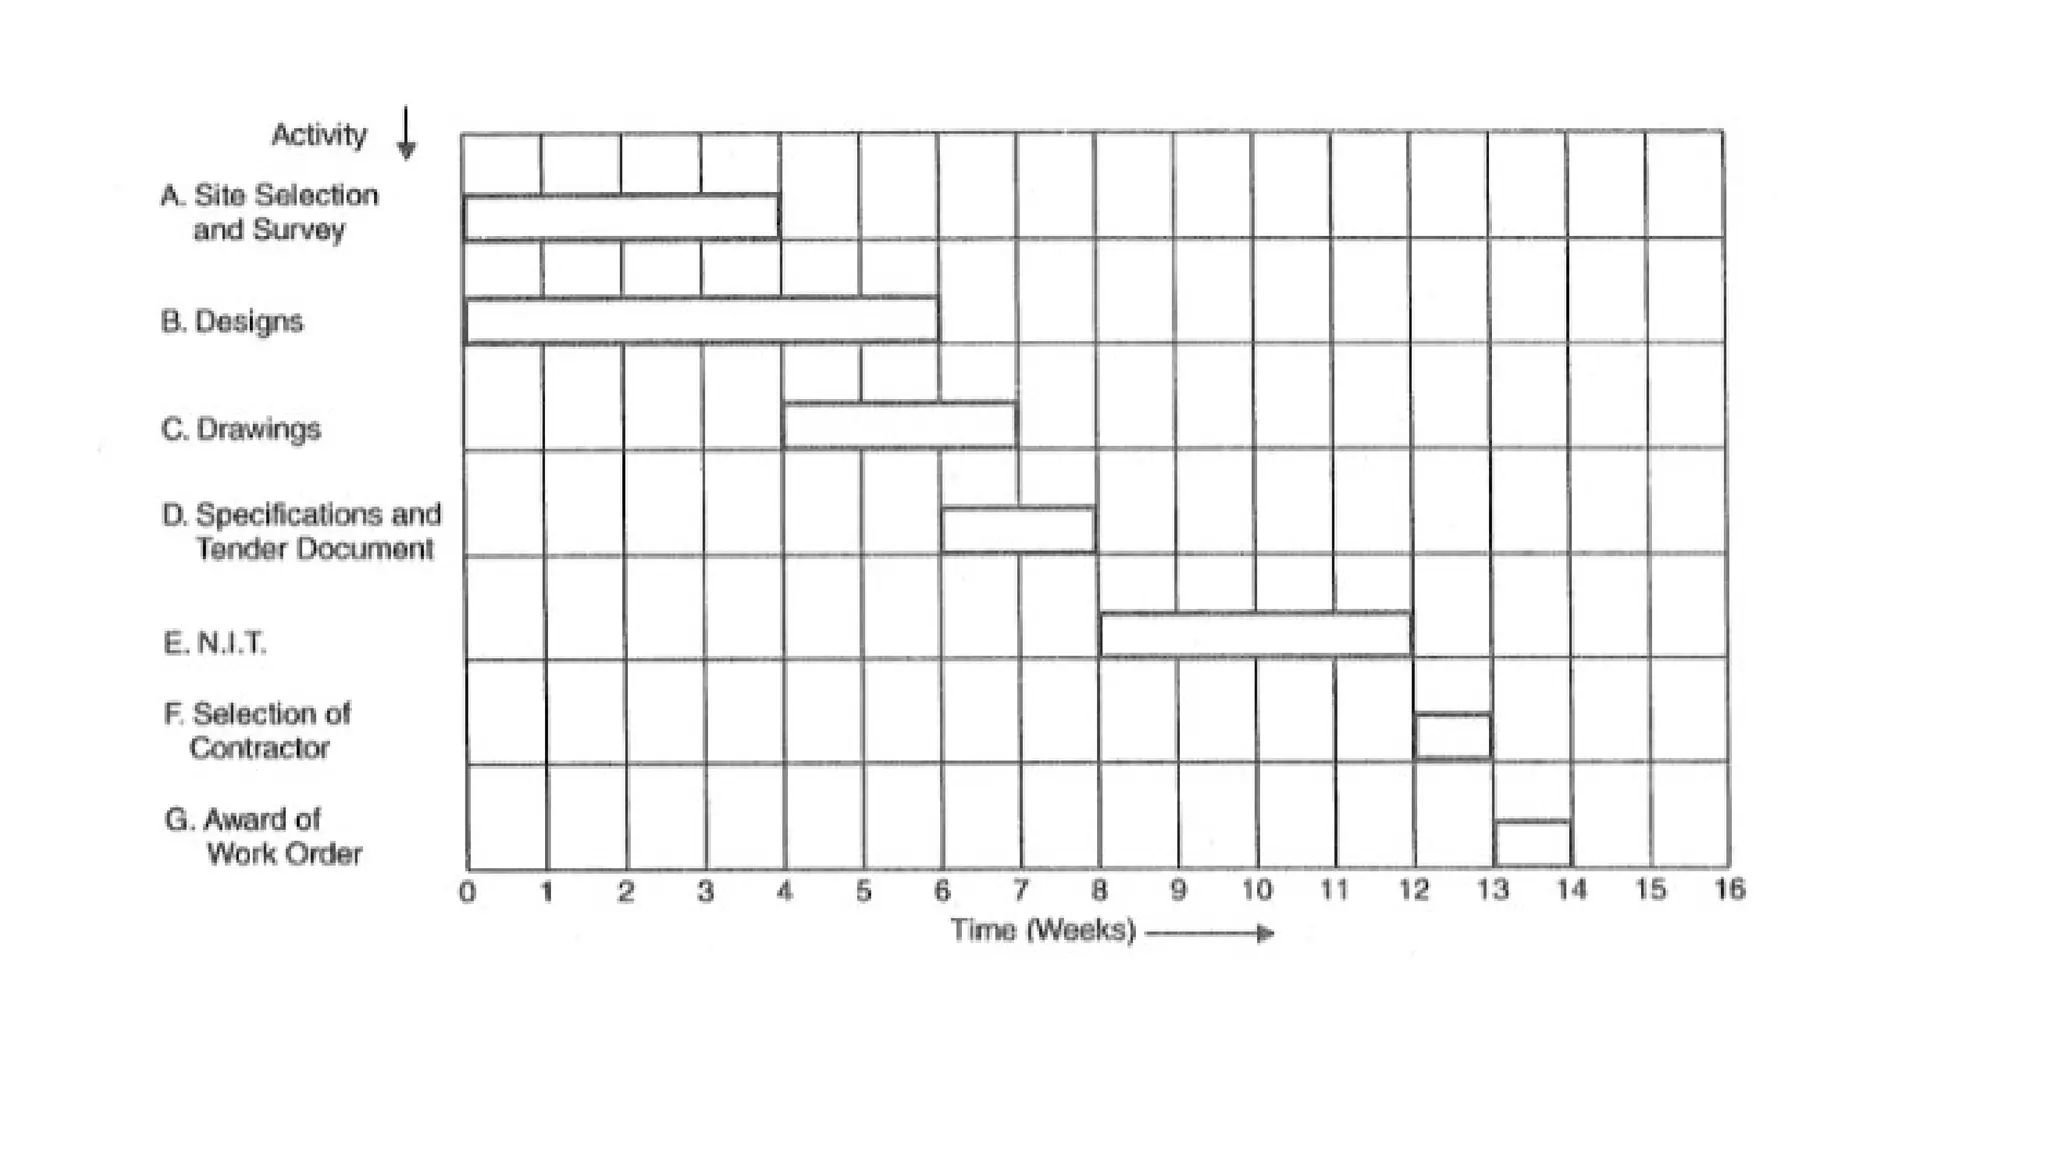
Example : Theactivity breakdown for certain project
Activity 2 and activity 3 can be done concurrently, and both
must follow activity 1. Activity 2 must precede activity 4. Activity
5 cannot begin until both activities 2 and 3 are completed.
Activity 6 can be started only after activities 4 and 5 are
complete. Activity 7 is the last activity which can be started only
after completion of activity 5. Prepare the bar chart for the
project.
Activity No. Duration (weeks)
1 1
2 2
3 4
4 3
5 1
6 2
7 4
10.
Milestone Charts
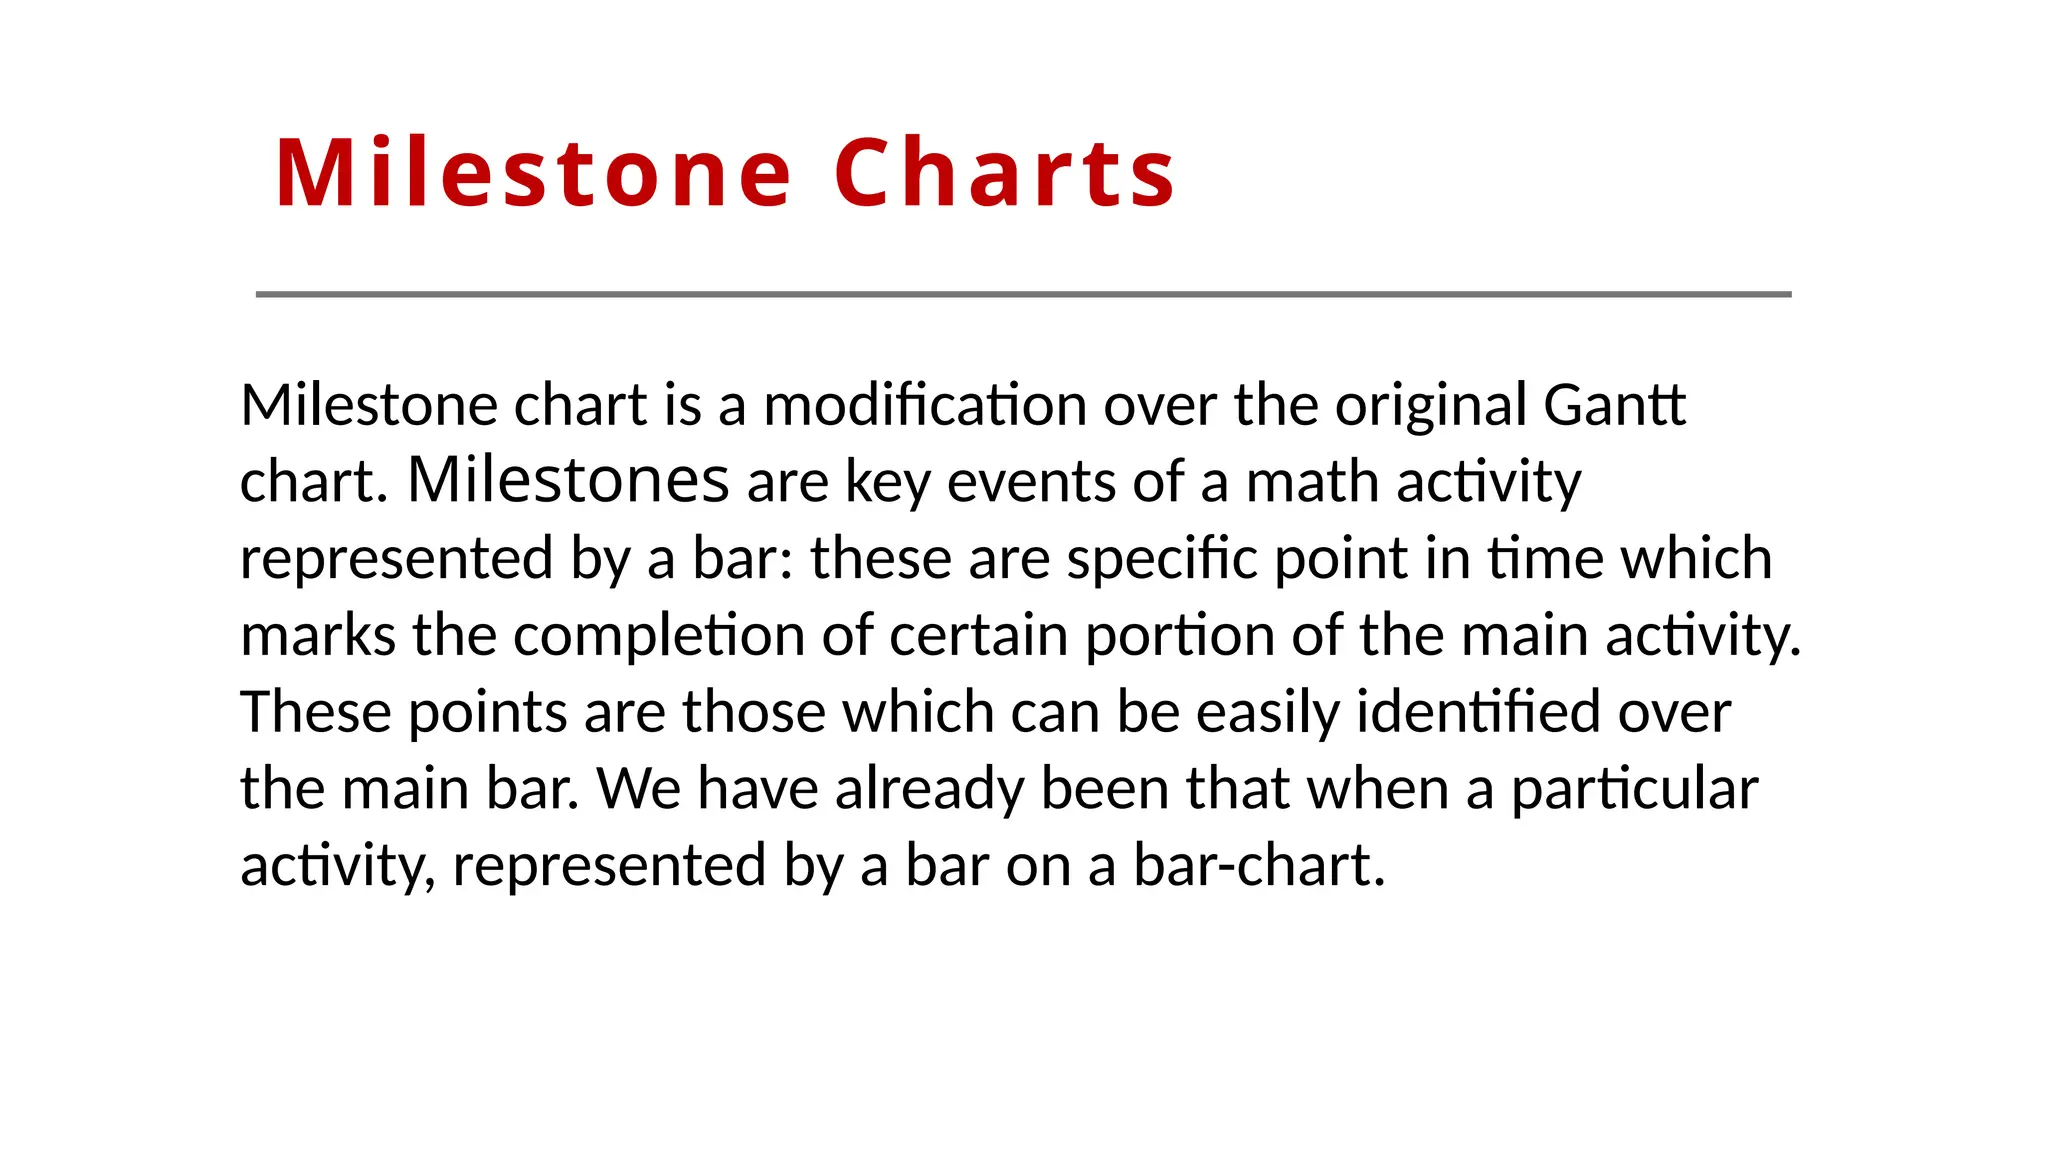
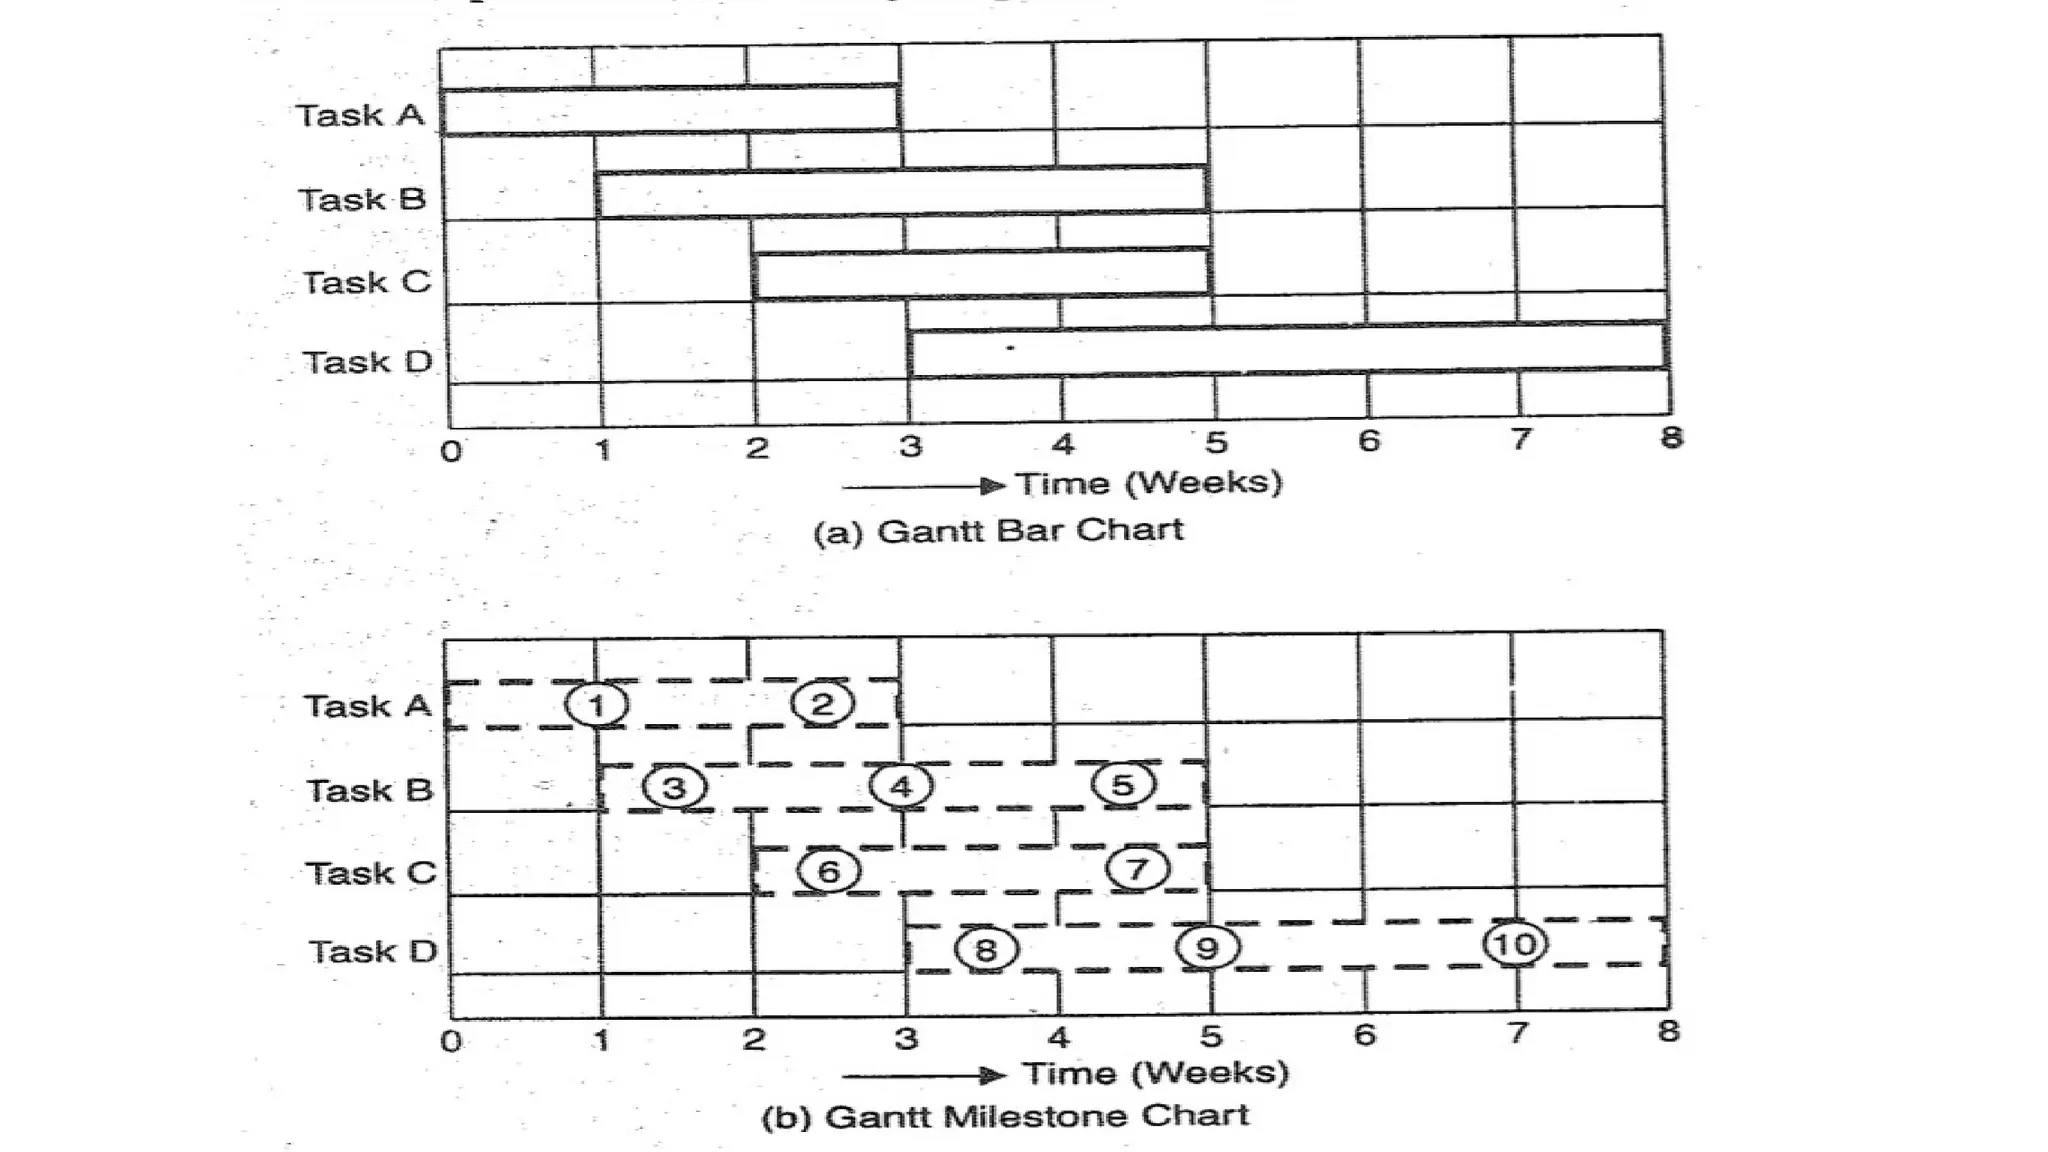
Milestone chartis a modification over the original Gantt
chart. Milestones are key events of a math activity
represented by a bar: these are specific point in time which
marks the completion of certain portion of the main activity.
These points are those which can be easily identified over
the main bar. We have already been that when a particular
activity, represented by a bar on a bar-chart.
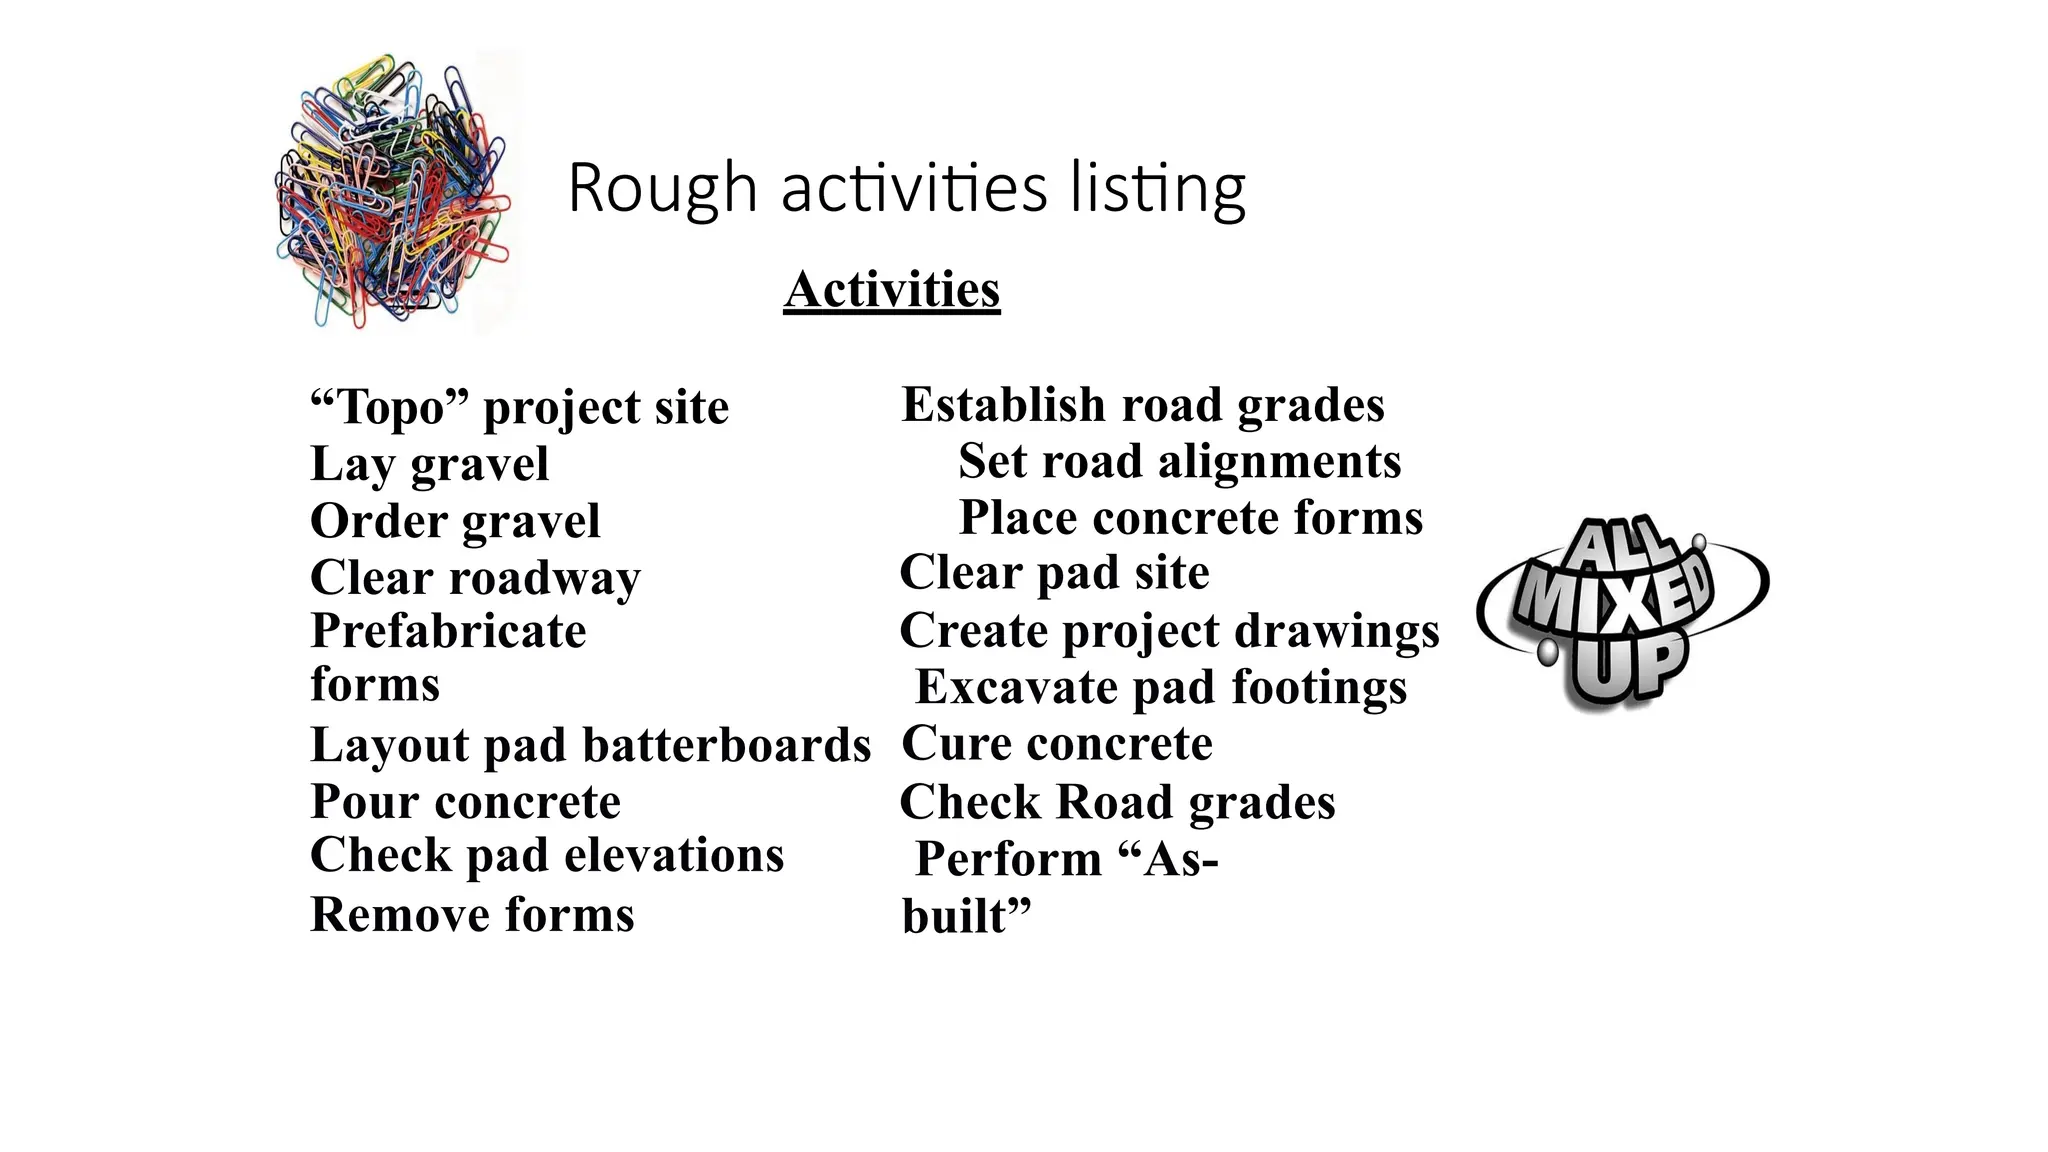
Activities
“Topo” project site
Laygravel
Order gravel
Clear roadway
Prefabricate
forms
Layout pad batterboards
Pour concrete
Check pad elevations
Remove forms
Establish road grades
Set road alignments
Place concrete forms
Clear pad site
Create project drawings
Excavate pad footings
Cure concrete
Check Road grades
Perform “As-
built”
Rough activities listing
14.
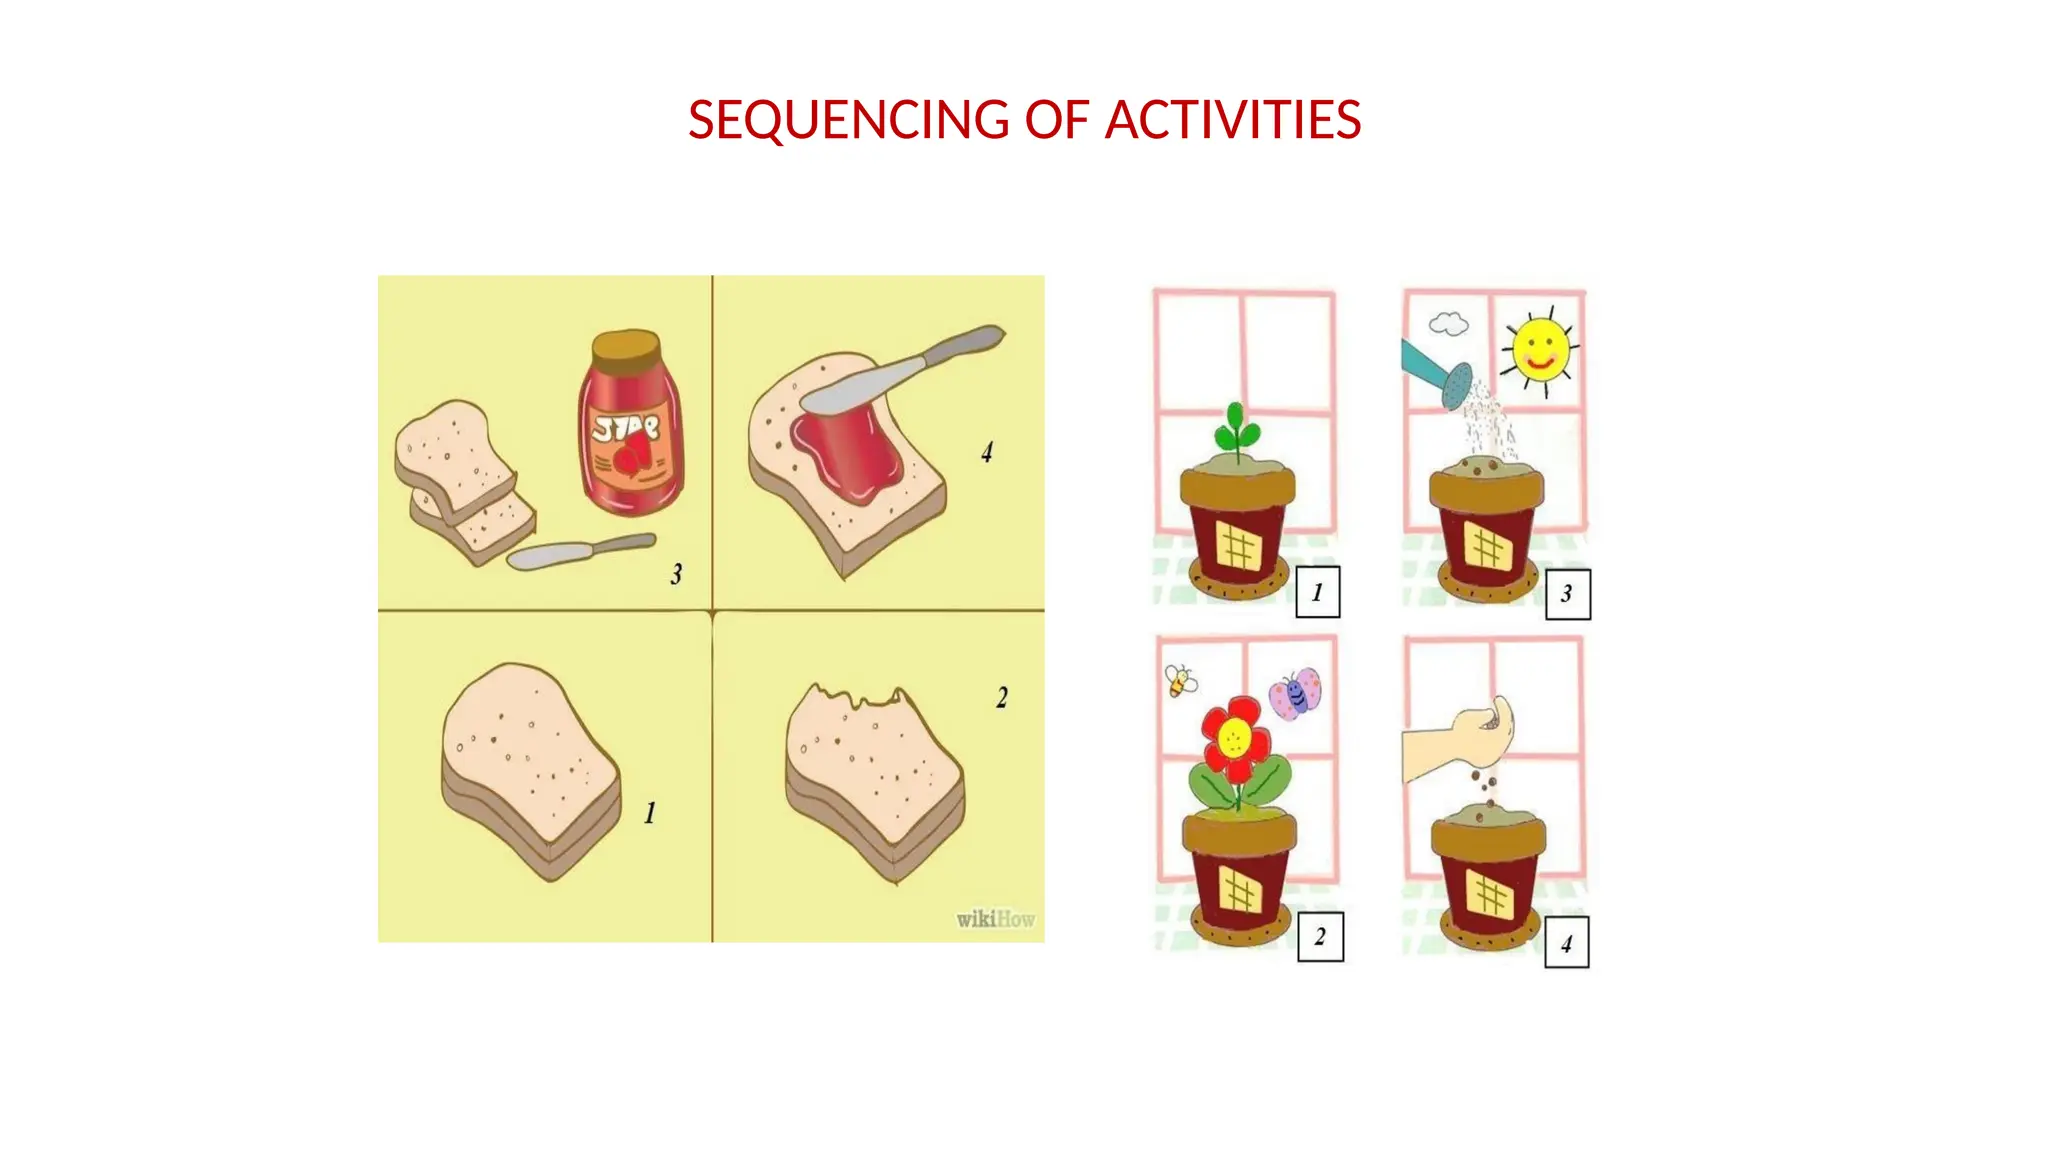
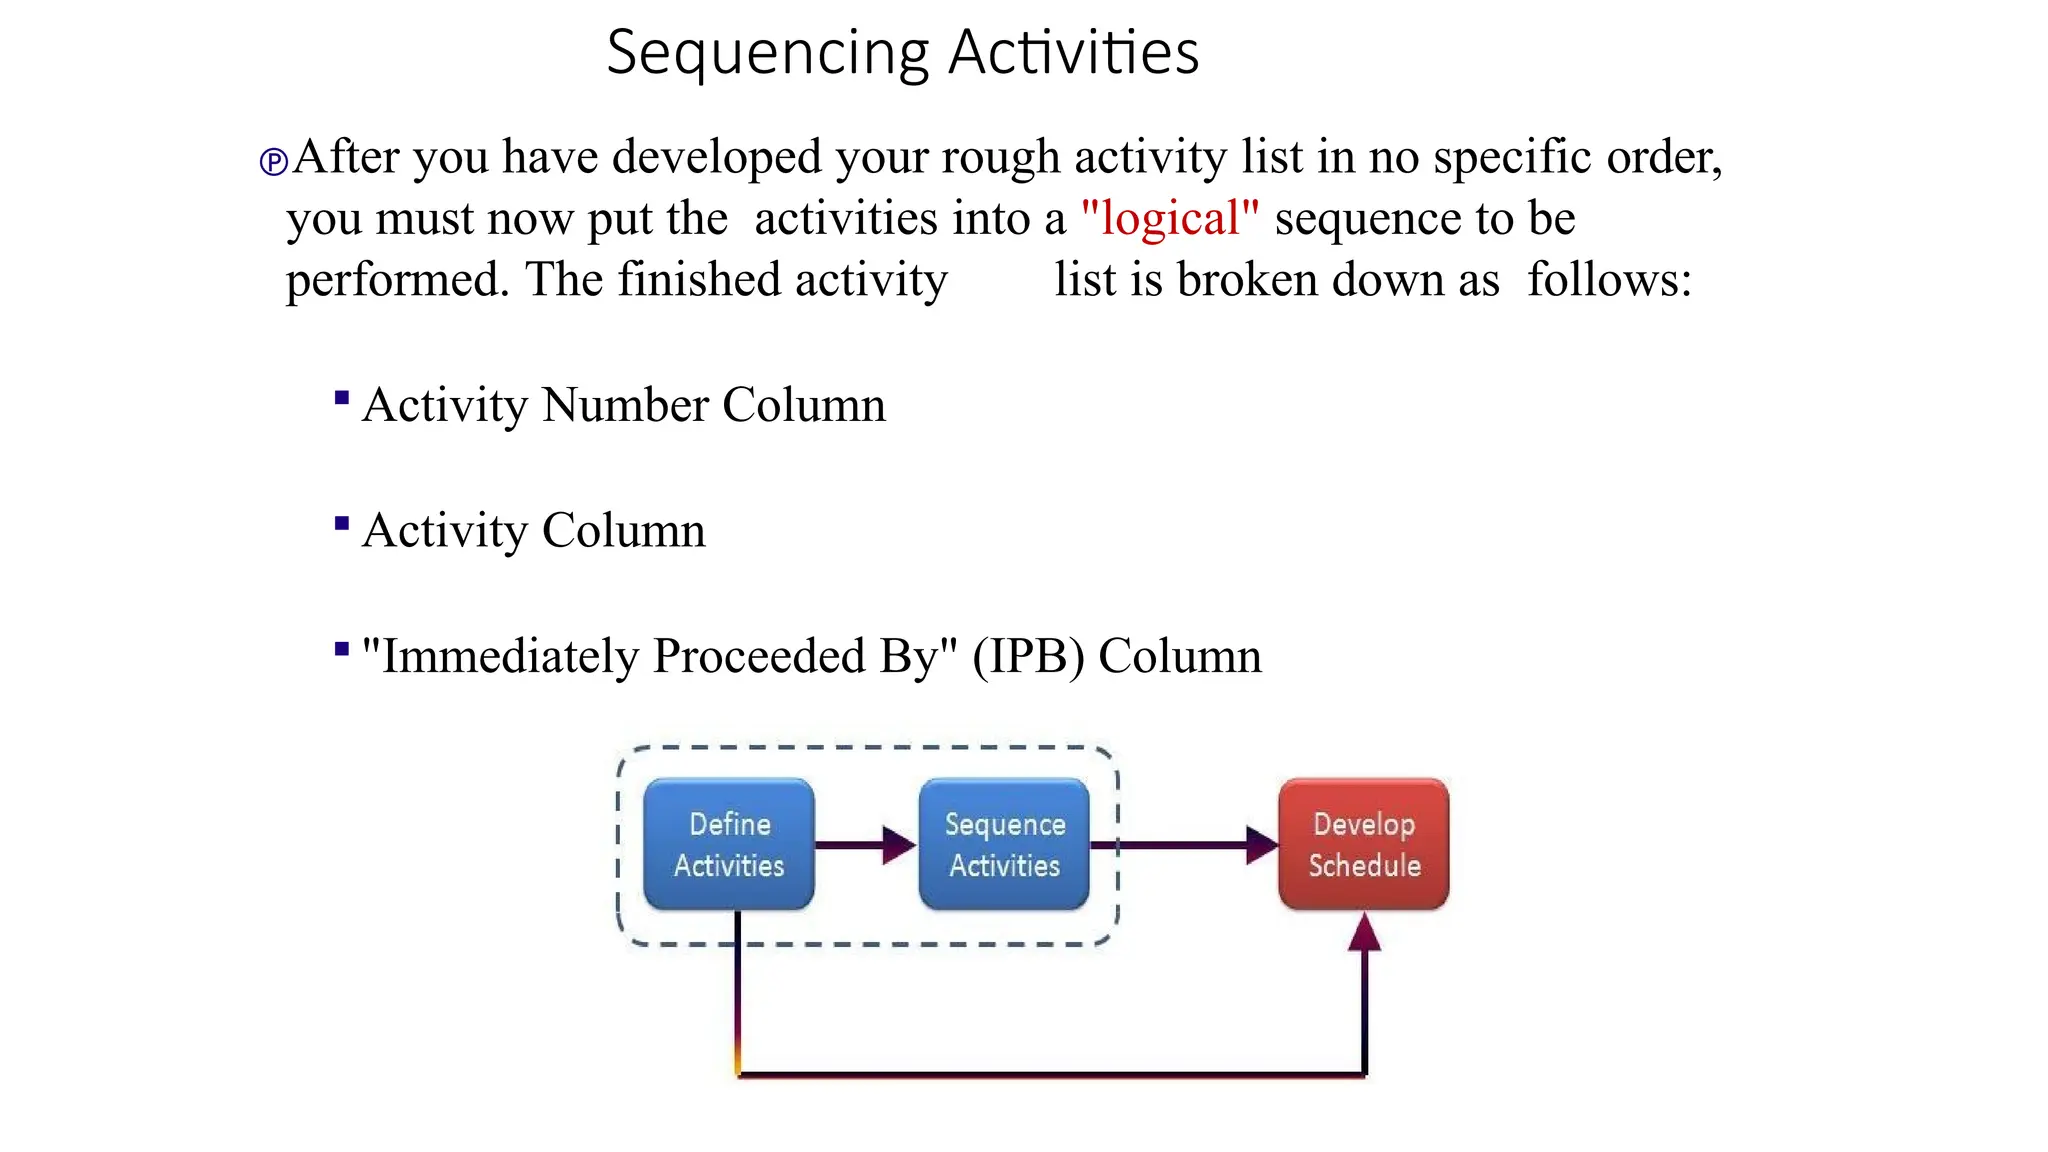
Sequencing Activities
After youhave developed your rough activity list in no specific order,
you must now put the activities into a "logical" sequence to be
performed. The finished activity list is broken down as follows:
Activity Number Column
Activity Column
"Immediately Proceeded By" (IPB) Column
15.
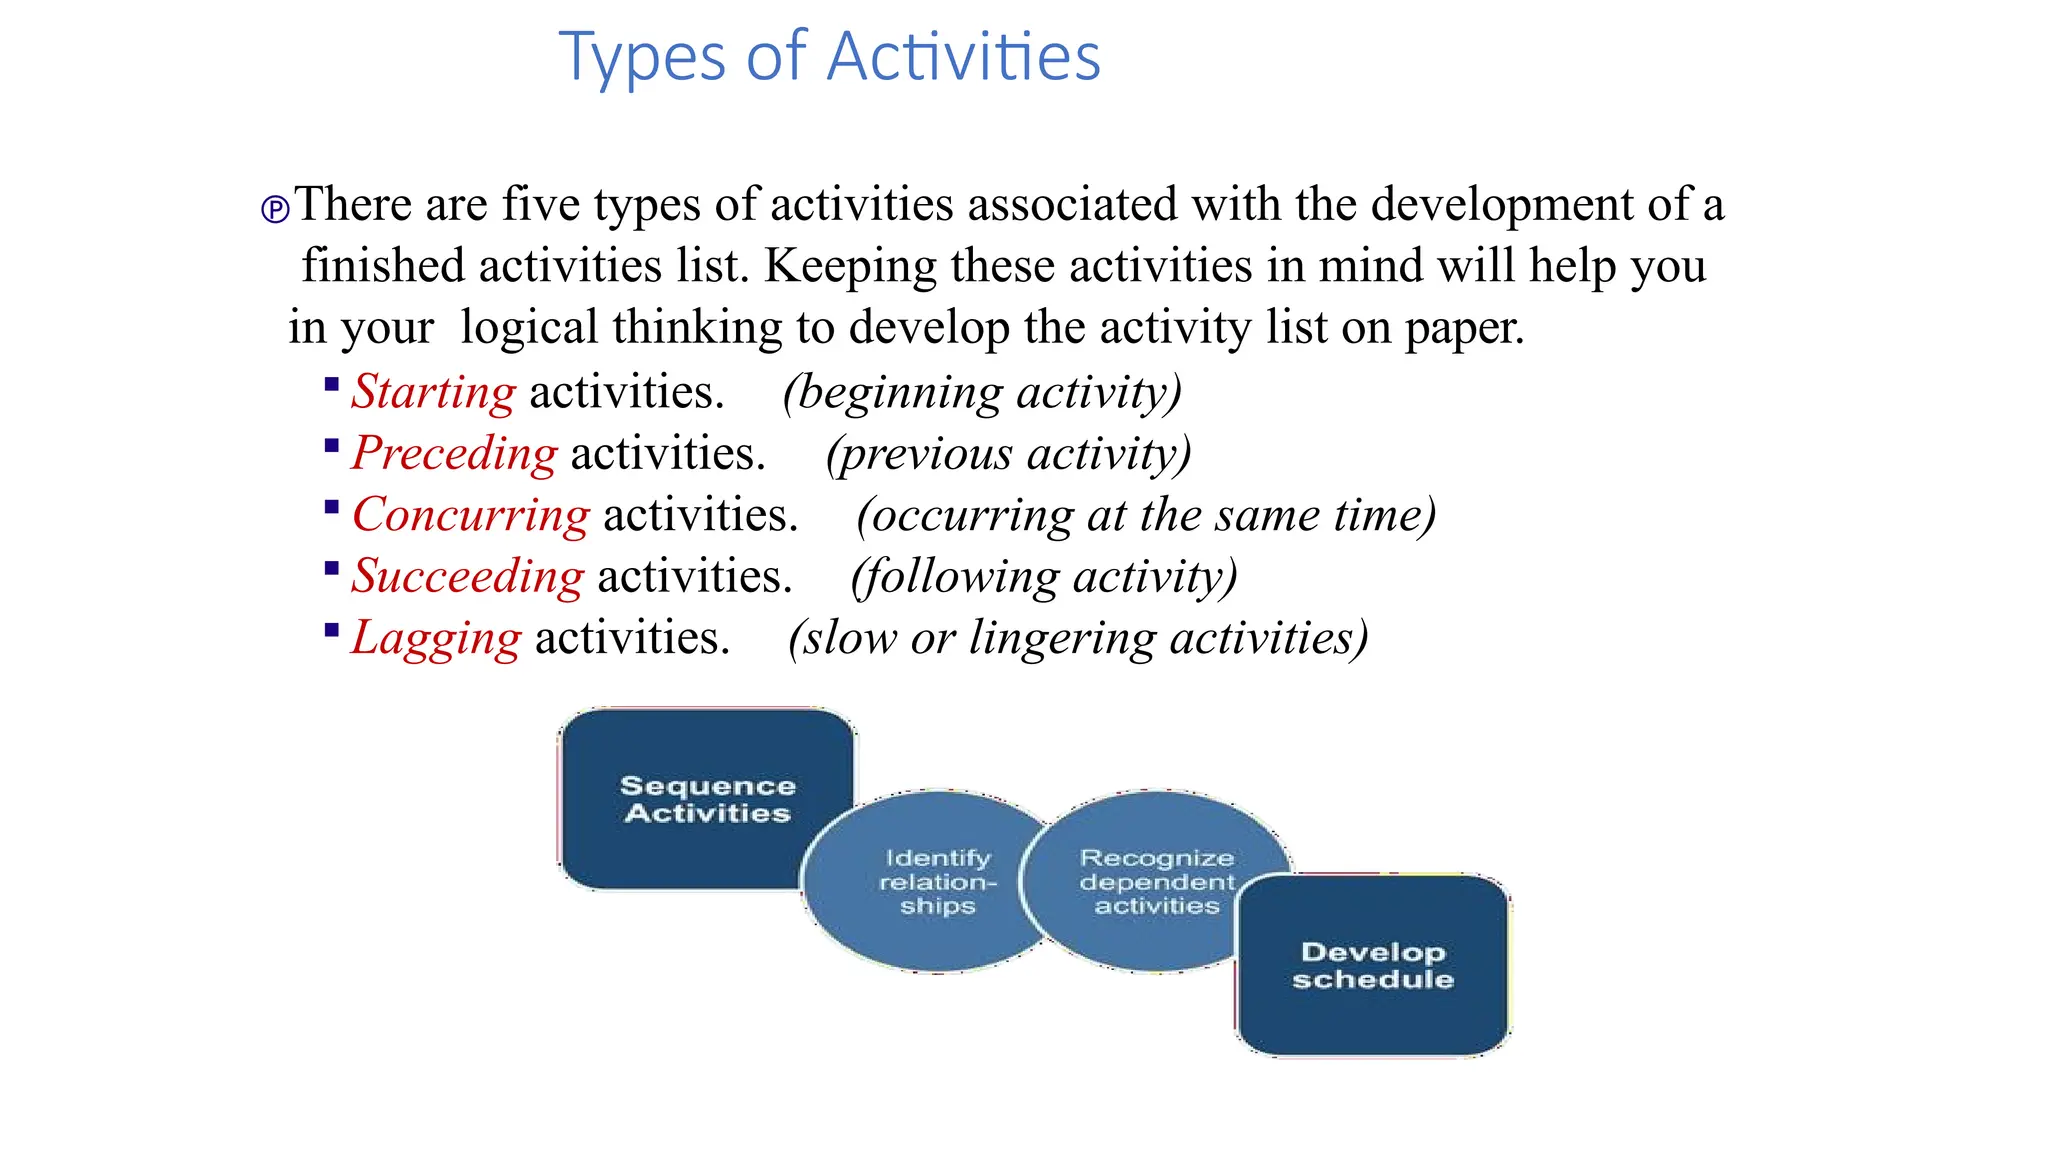
There are fivetypes of activities associated with the development of a
finished activities list. Keeping these activities in mind will help you
in your logical thinking to develop the activity list on paper.
Starting activities. (beginning activity)
Preceding activities. (previous activity)
Concurring activities. (occurring at the same time)
Succeeding activities. (following activity)
Lagging activities. (slow or lingering activities)
Types of Activities
17.
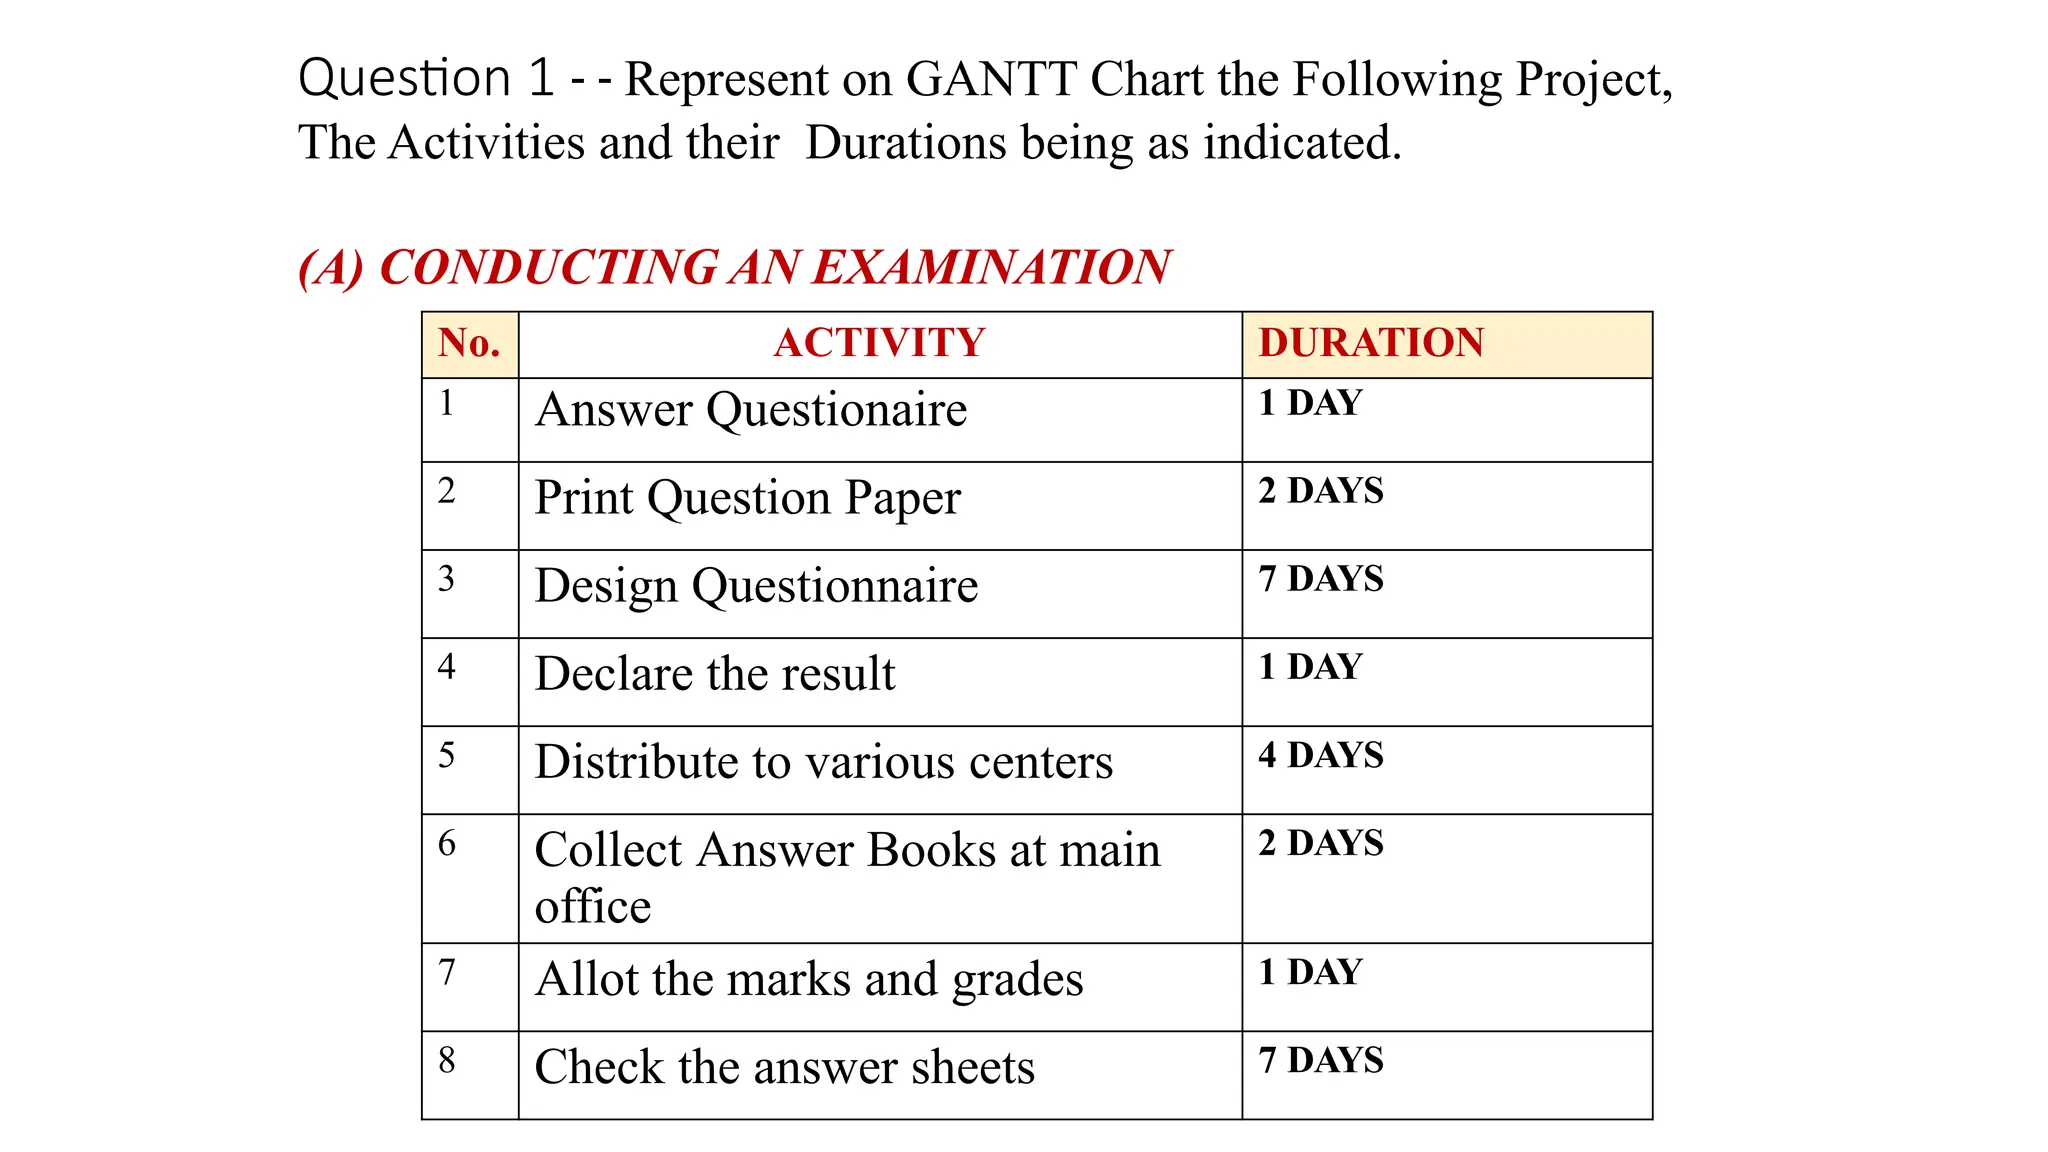
Question 1 -- Represent on GANTT Chart the Following Project,
The Activities and their Durations being as indicated.
(A) CONDUCTING AN EXAMINATION
No. ACTIVITY DURATION
1 Answer Questionaire 1 DAY
2 Print Question Paper 2 DAYS
3 Design Questionnaire 7 DAYS
4 Declare the result 1 DAY
5 Distribute to various centers 4 DAYS
6 Collect Answer Books at main
office
2 DAYS
7 Allot the marks and grades 1 DAY
8 Check the answer sheets 7 DAYS
18.
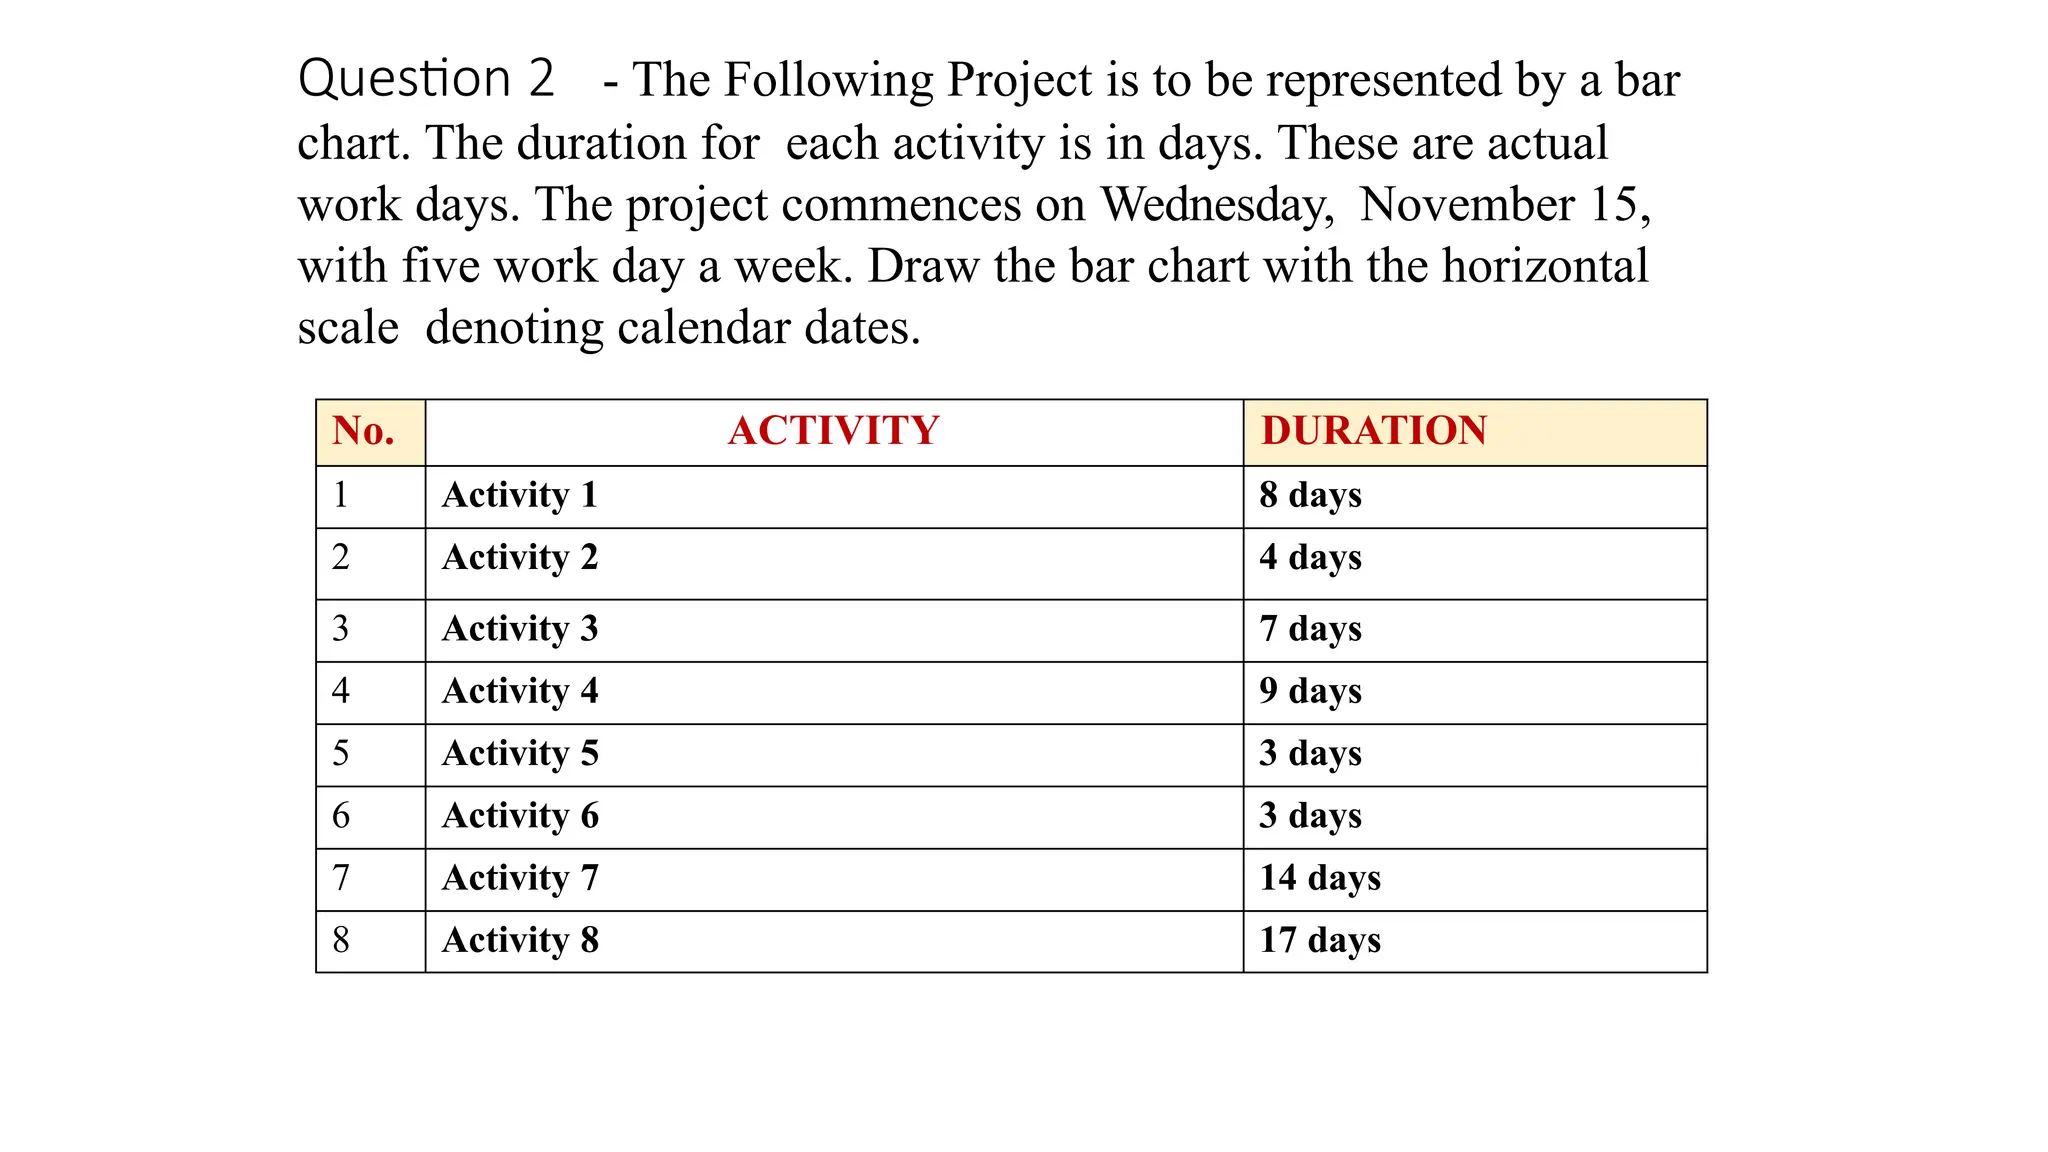
Question 2 -The Following Project is to be represented by a bar
chart. The duration for each activity is in days. These are actual
work days. The project commences on Wednesday, November 15,
with five work day a week. Draw the bar chart with the horizontal
scale denoting calendar dates.
No. ACTIVITY DURATION
1 Activity 1 8 days
2 Activity 2 4 days
3 Activity 3 7 days
4 Activity 4 9 days
5 Activity 5 3 days
6 Activity 6 3 days
7 Activity 7 14 days
8 Activity 8 17 days
19.
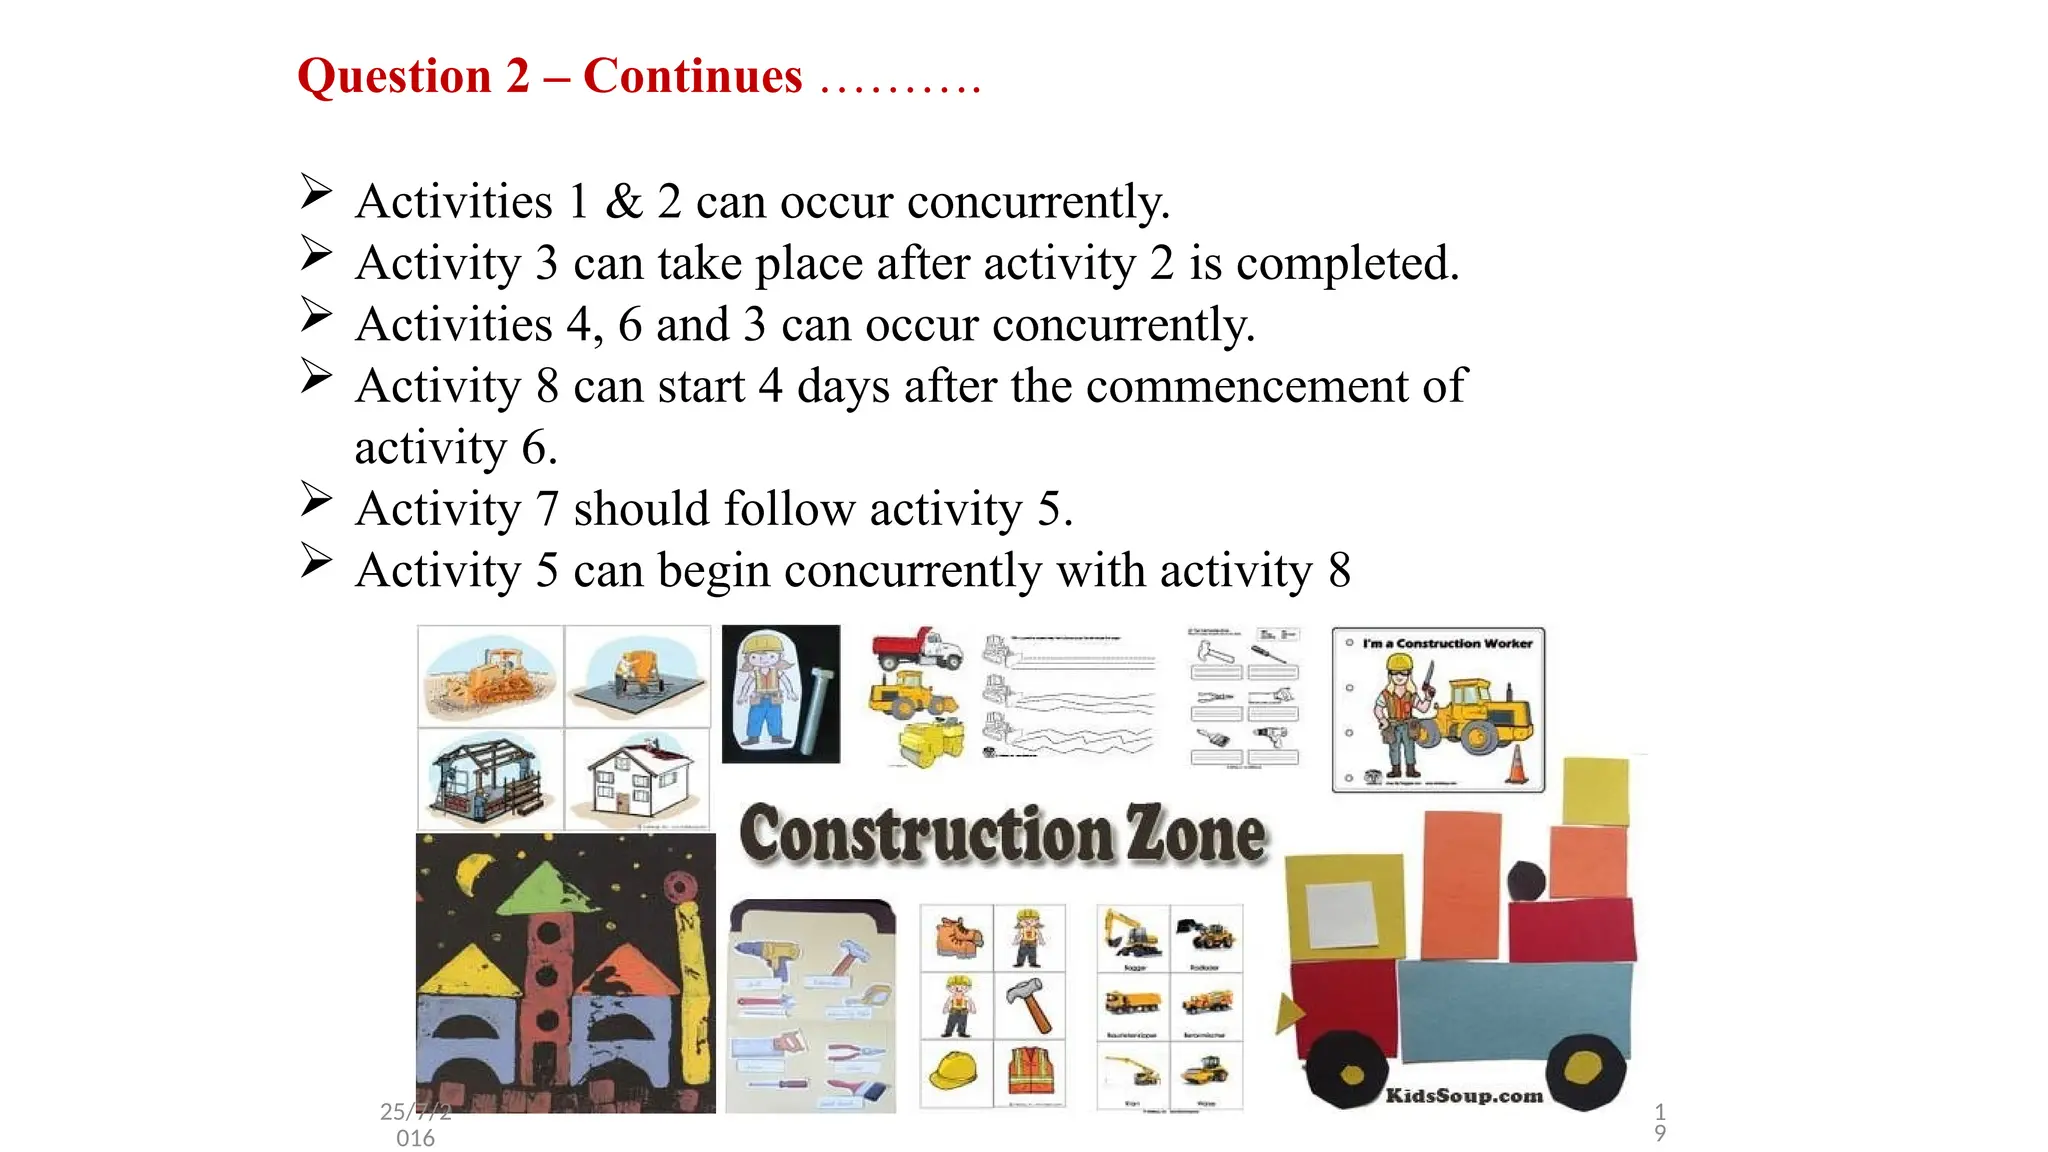
Question 2 –Continues ……….
Activities 1 & 2 can occur concurrently.
Activity 3 can take place after activity 2 is completed.
Activities 4, 6 and 3 can occur concurrently.
Activity 8 can start 4 days after the commencement of
activity 6.
Activity 7 should follow activity 5.
Activity 5 can begin concurrently with activity 8
25/7/2
016
1
9
20.
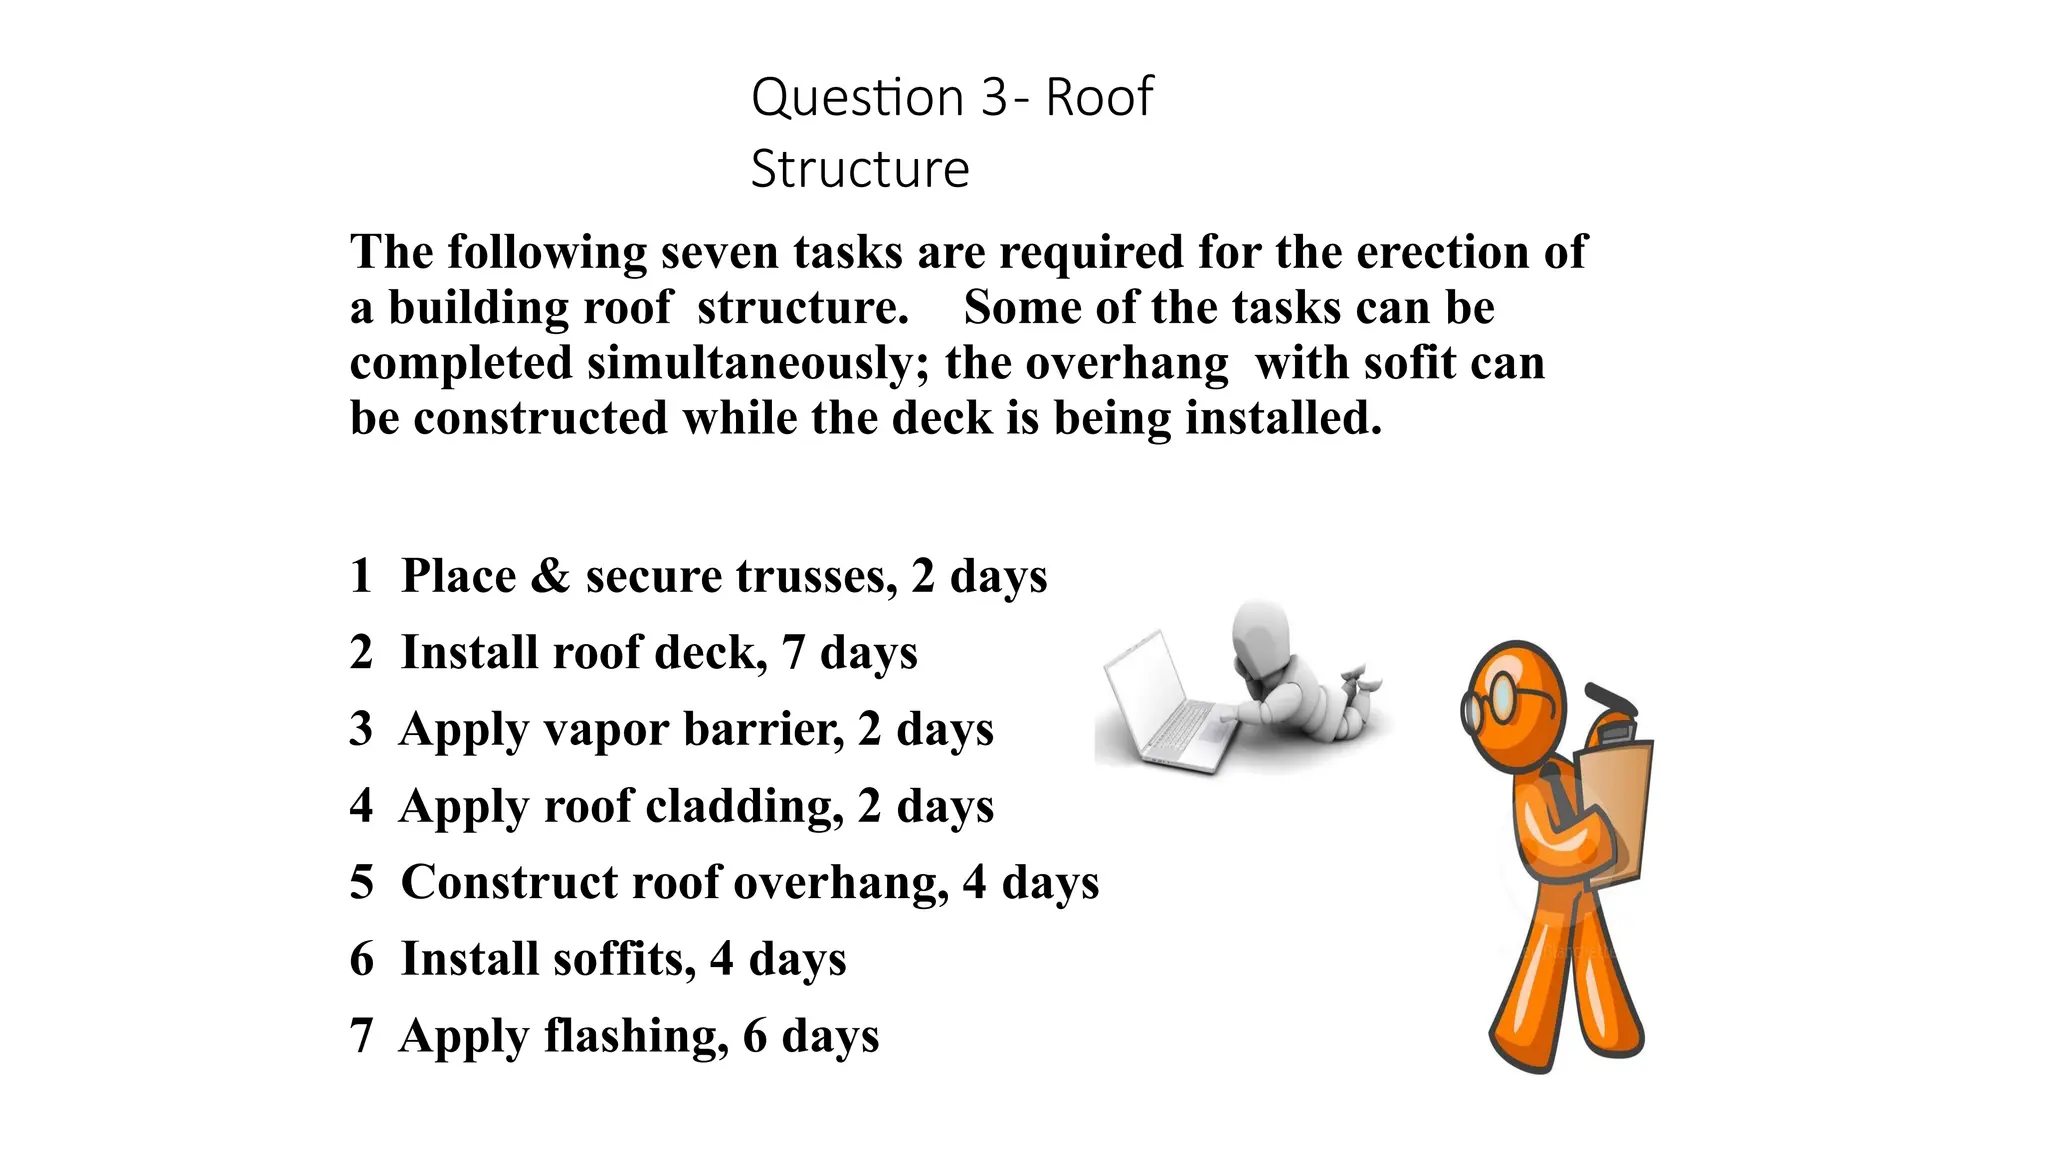
Question 3- Roof
Structure
Thefollowing seven tasks are required for the erection of
a building roof structure. Some of the tasks can be
completed simultaneously; the overhang with sofit can
be constructed while the deck is being installed.
1 Place & secure trusses, 2 days
2 Install roof deck, 7 days
3 Apply vapor barrier, 2 days
4 Apply roof cladding, 2 days
5 Construct roof overhang, 4 days
6 Install soffits, 4 days
7 Apply flashing, 6 days
21.
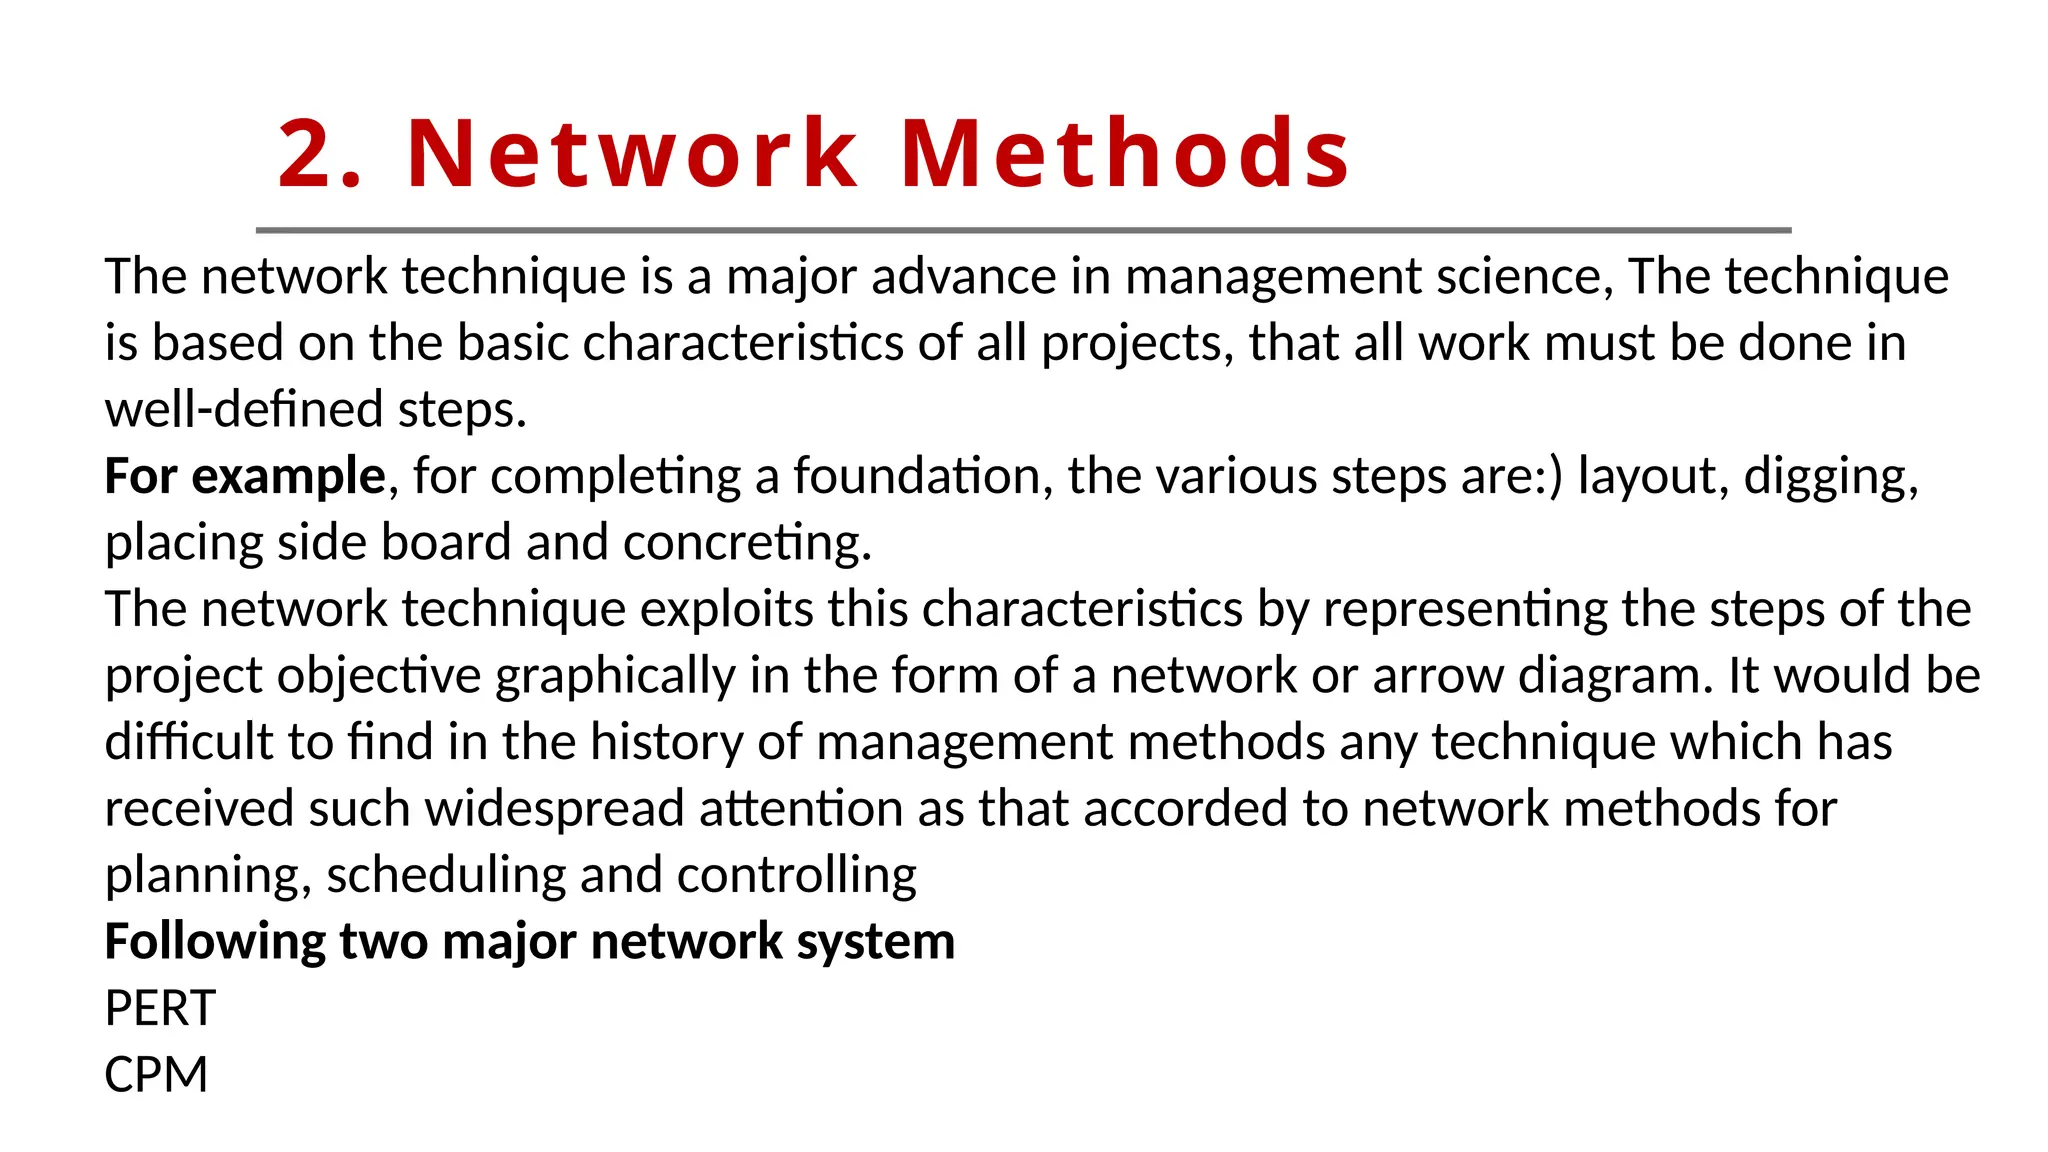
2. Network Methods
Thenetwork technique is a major advance in management science, The technique
is based on the basic characteristics of all projects, that all work must be done in
well-defined steps.
For example, for completing a foundation, the various steps are:) layout, digging,
placing side board and concreting.
The network technique exploits this characteristics by representing the steps of the
project objective graphically in the form of a network or arrow diagram. It would be
difficult to find in the history of management methods any technique which has
received such widespread attention as that accorded to network methods for
planning, scheduling and controlling
Following two major network system
PERT
CPM
22.
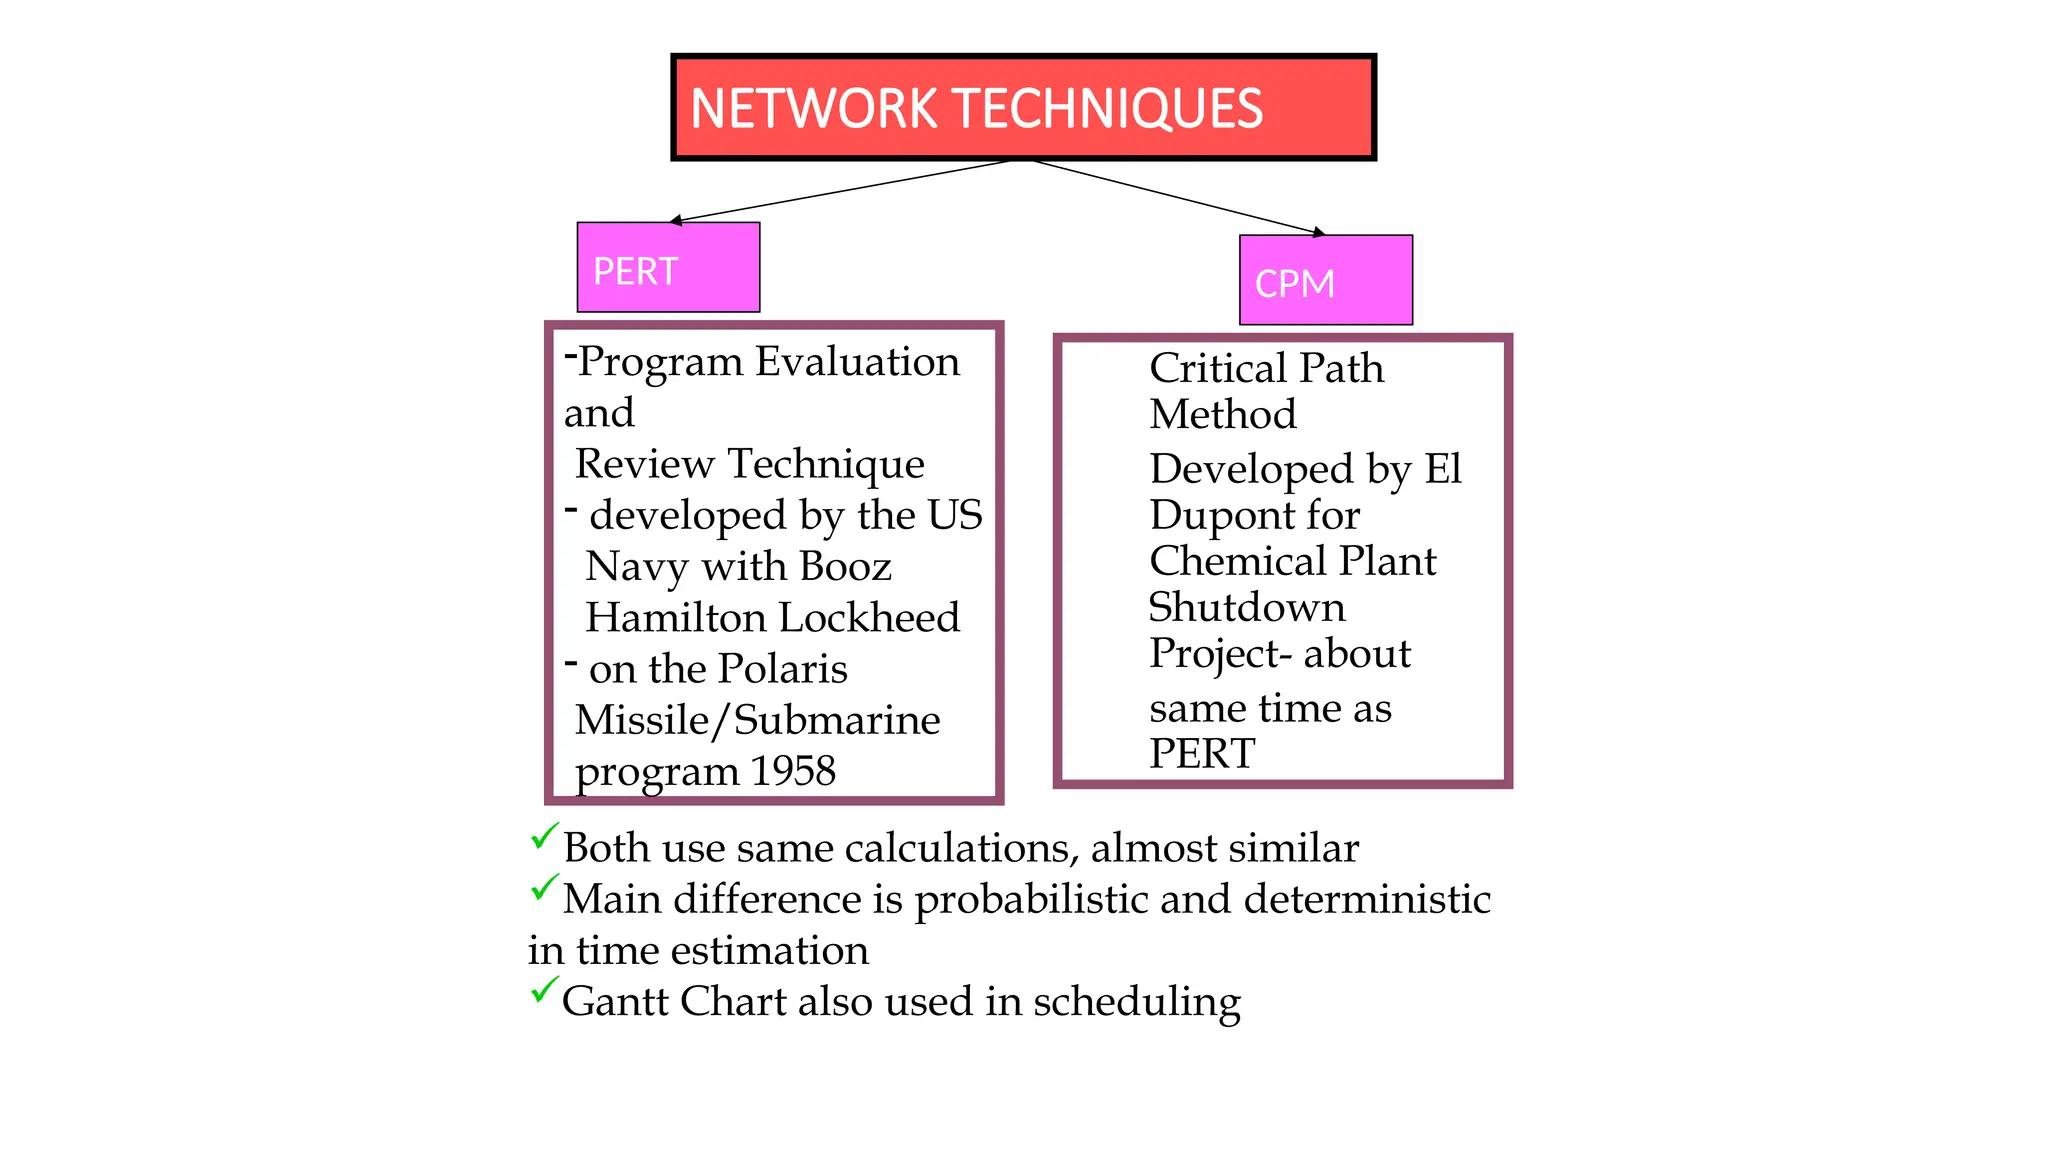
NETWORK TECHNIQUES
PERT CPM
-ProgramEvaluation
and
Review Technique
- developed by the US
Navy with Booz
Hamilton Lockheed
- on the Polaris
Missile/Submarine
program 1958
Critical Path
Method
Developed by El
Dupont for
Chemical Plant
Shutdown
Project- about
same time as
PERT
Both use same calculations, almost similar
Main difference is probabilistic and deterministic
in time estimation
Gantt Chart also used in scheduling
23.
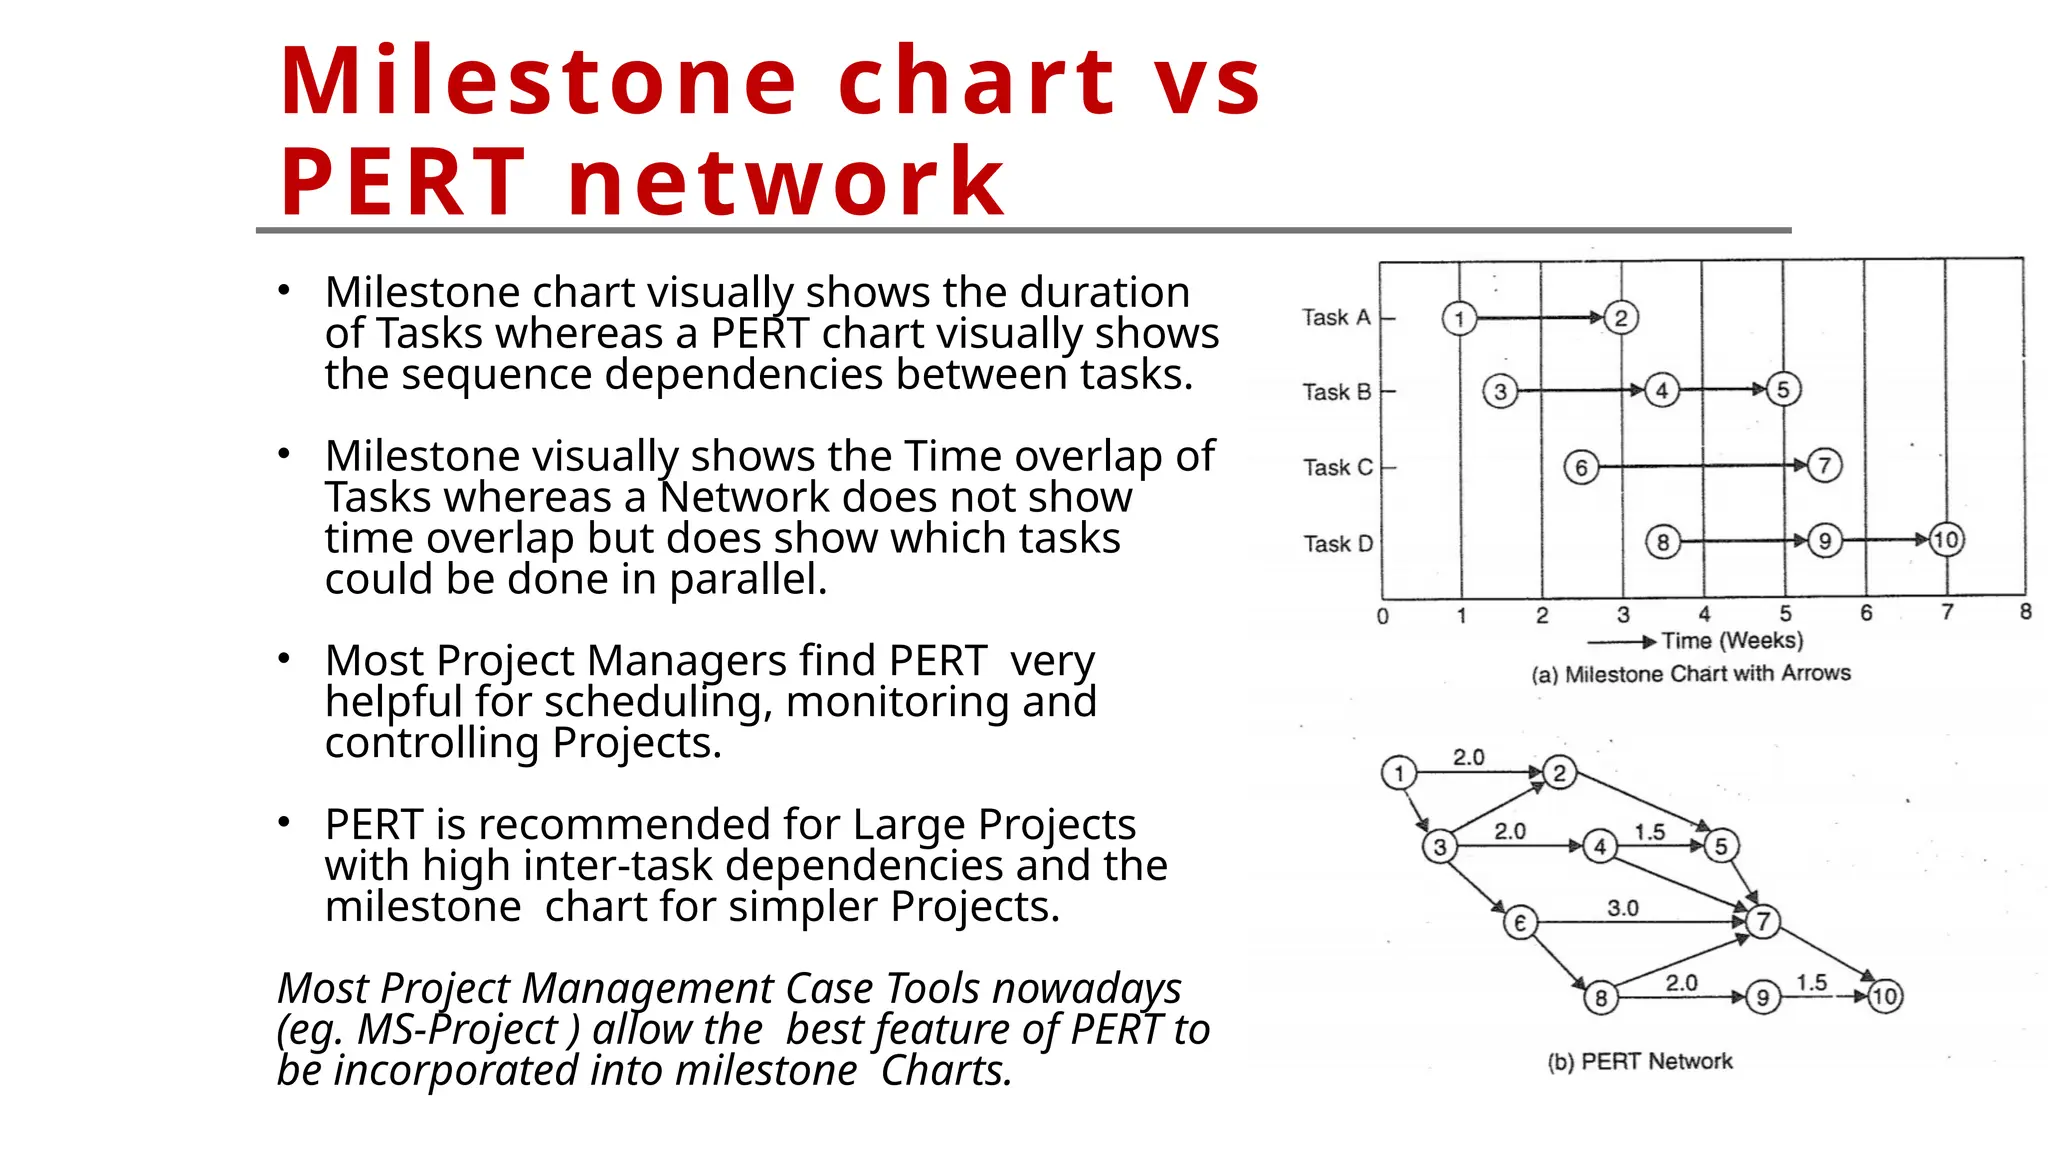
Milestone chart vs
PERTnetwork
• Milestone chart visually shows the duration
of Tasks whereas a PERT chart visually shows
the sequence dependencies between tasks.
• Milestone visually shows the Time overlap of
Tasks whereas a Network does not show
time overlap but does show which tasks
could be done in parallel.
• Most Project Managers find PERT very
helpful for scheduling, monitoring and
controlling Projects.
• PERT is recommended for Large Projects
with high inter-task dependencies and the
milestone chart for simpler Projects.
Most Project Management Case Tools nowadays
(eg. MS-Project ) allow the best feature of PERT to
be incorporated into milestone Charts.
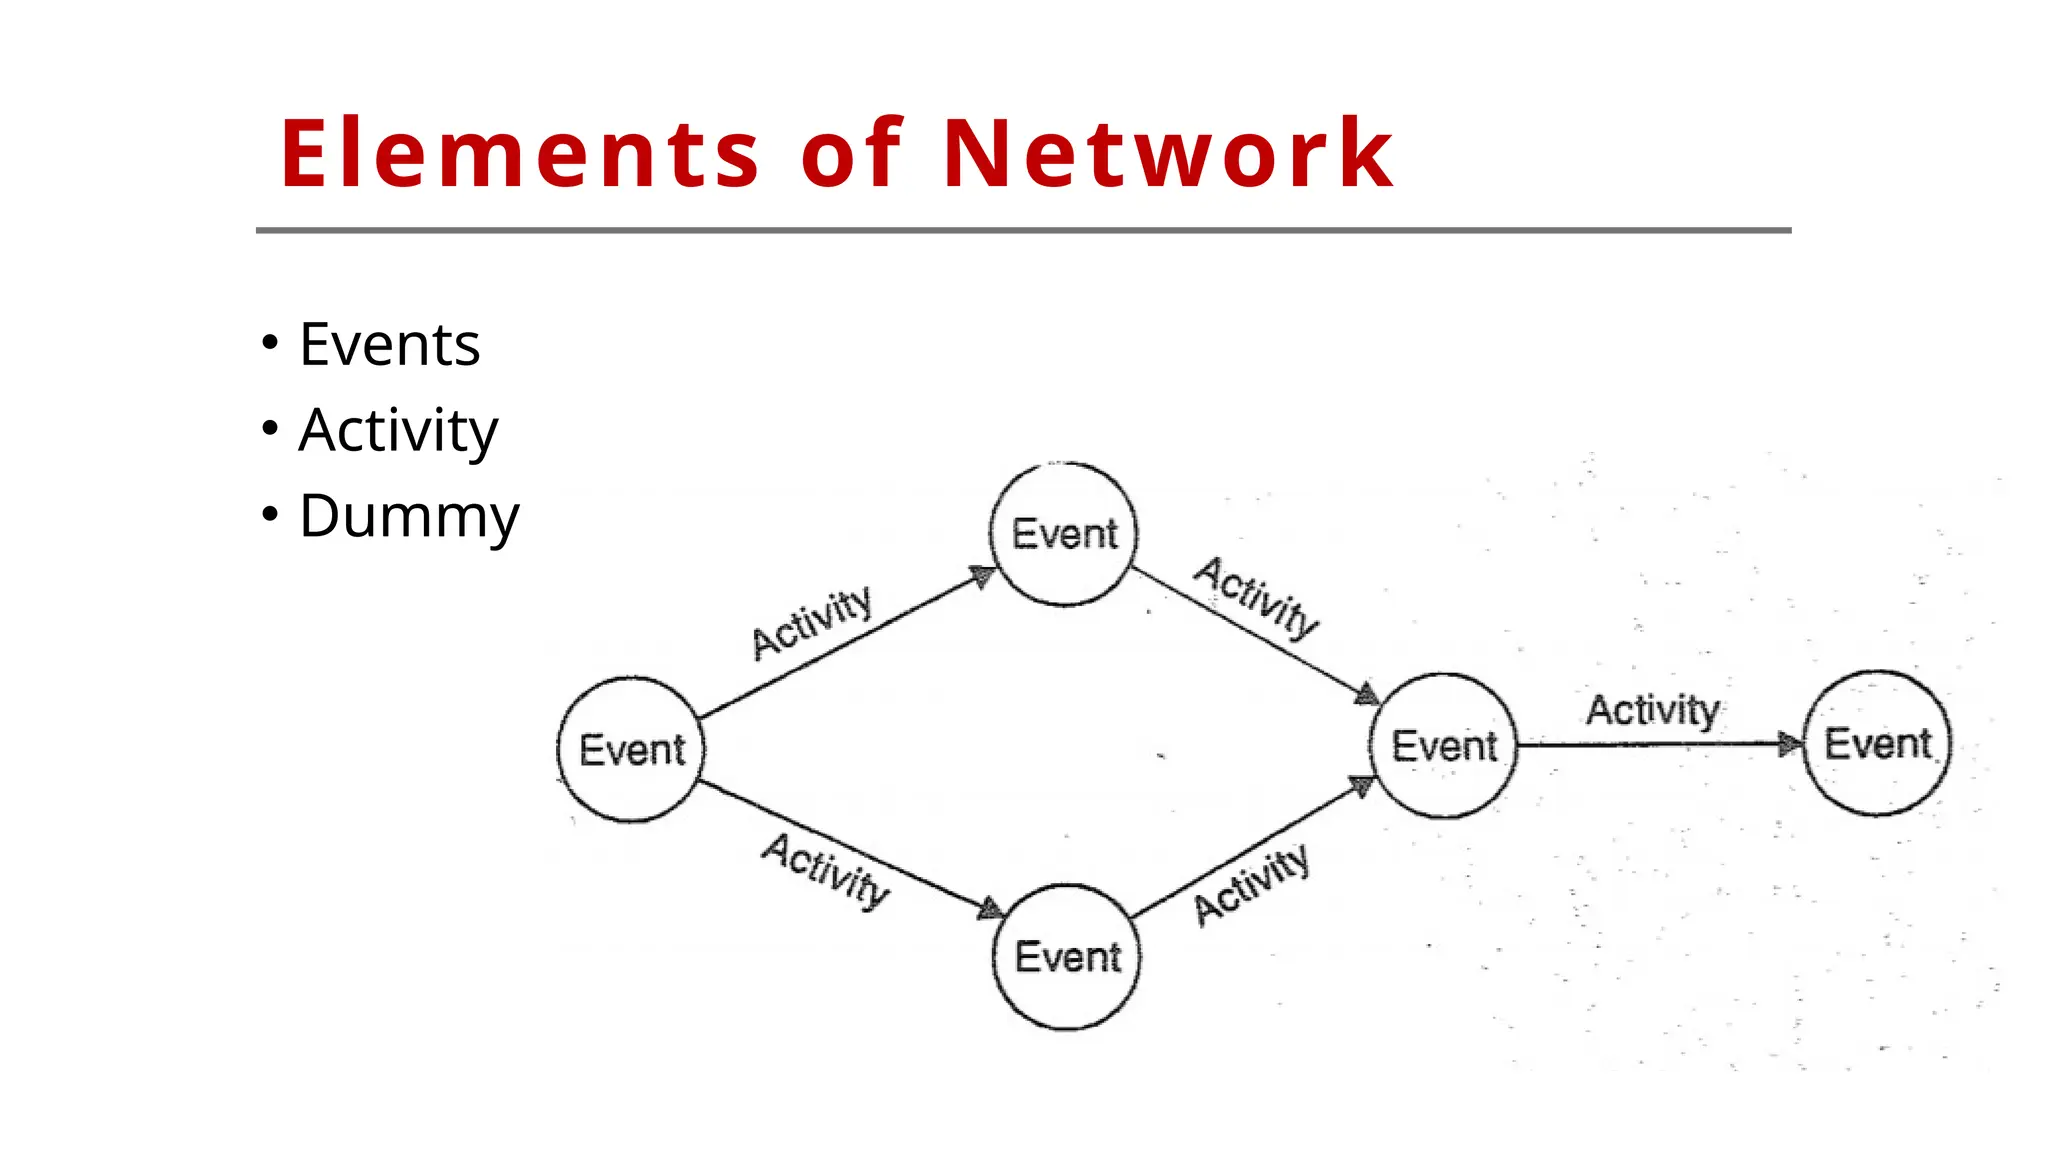
Event
An event iseither start or completion stage of an
activity.
It doesn’t require time and resources.
Examples of Events:-
• Design completed
• Excavation completed
• Lathe installed
• Parts assembled
• Excavated Foundation (Not an event )
26.
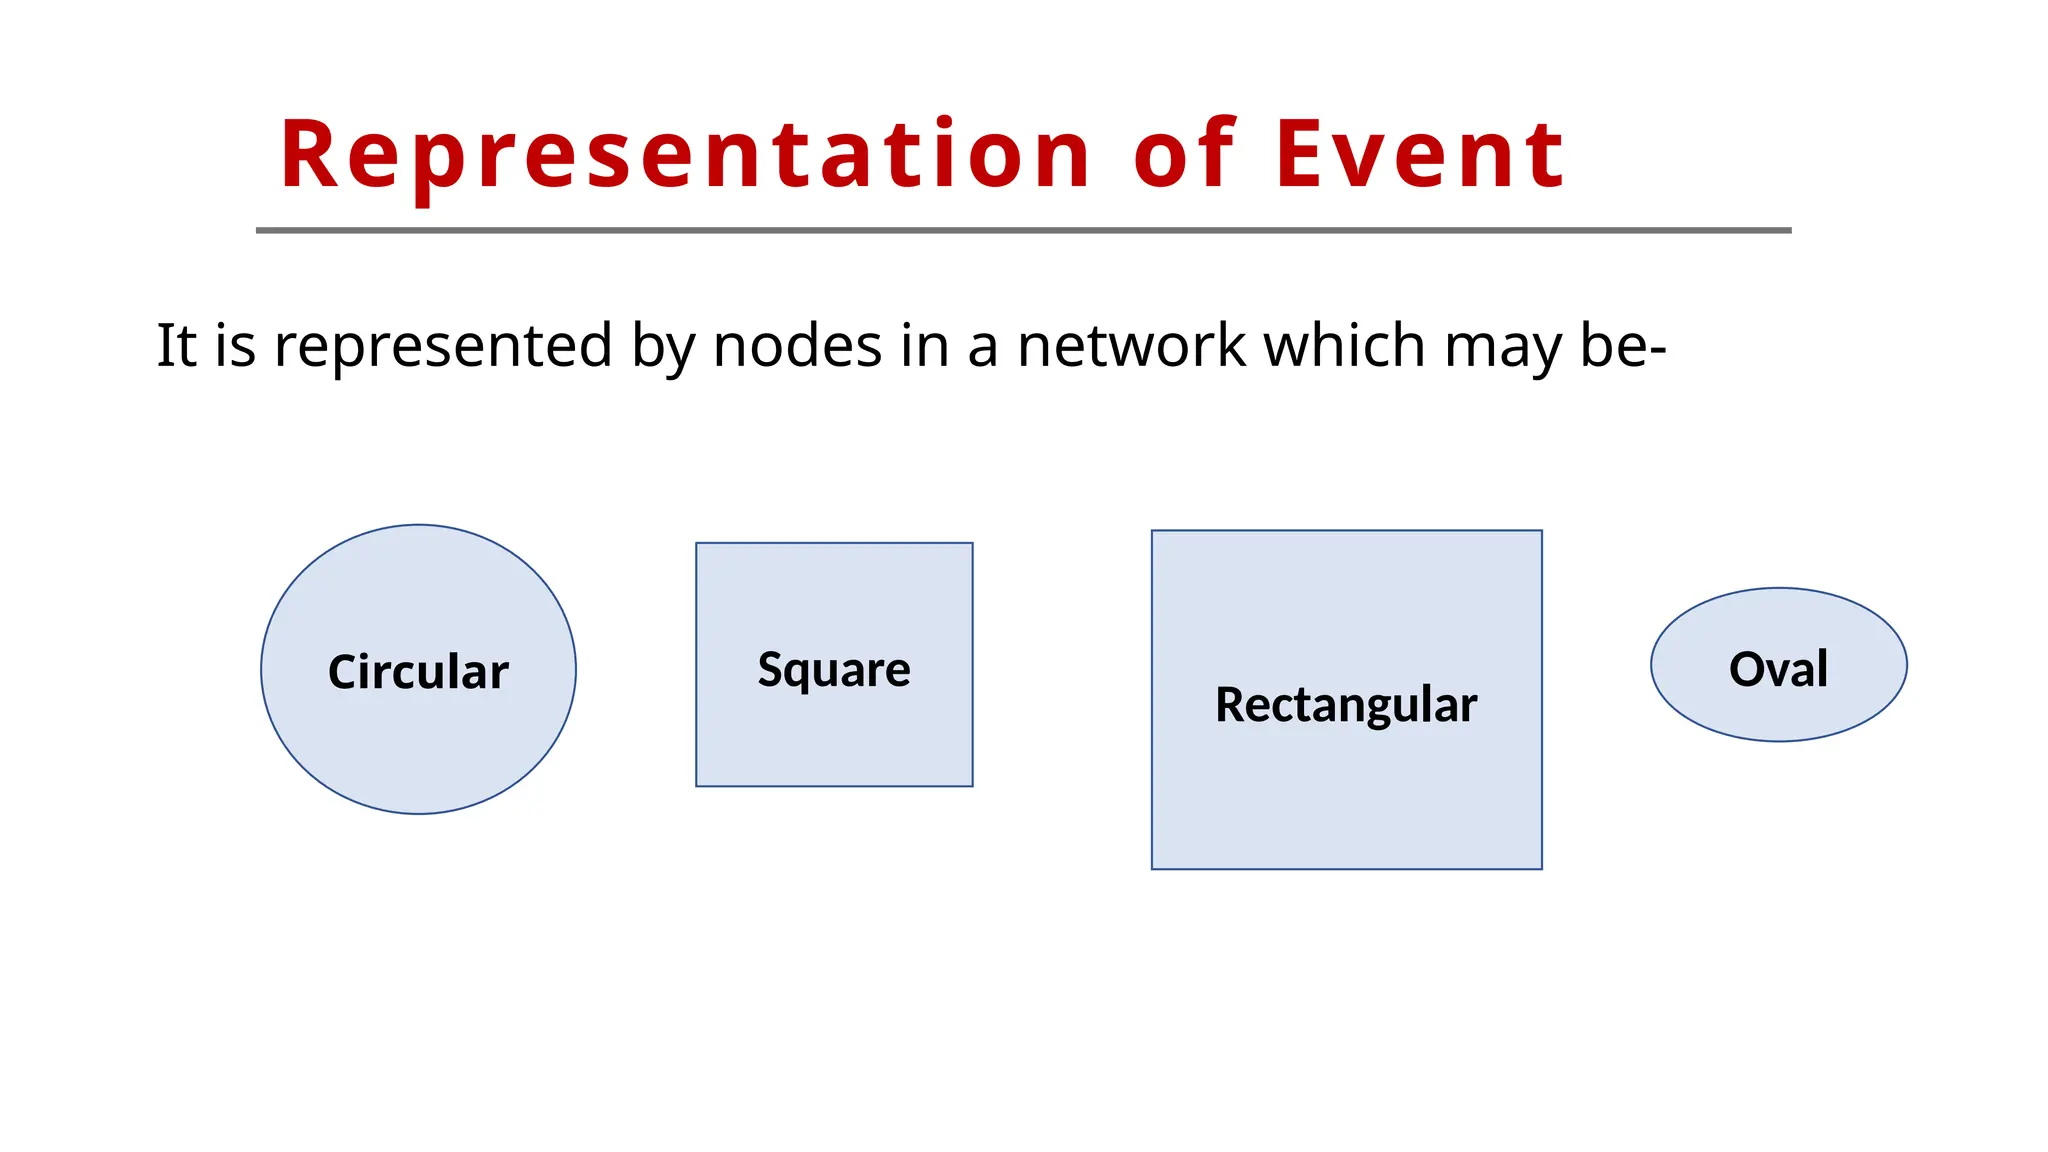
Representation of Event
Itis represented by nodes in a network which may be-
Circular Square
Rectangular
Oval
27.
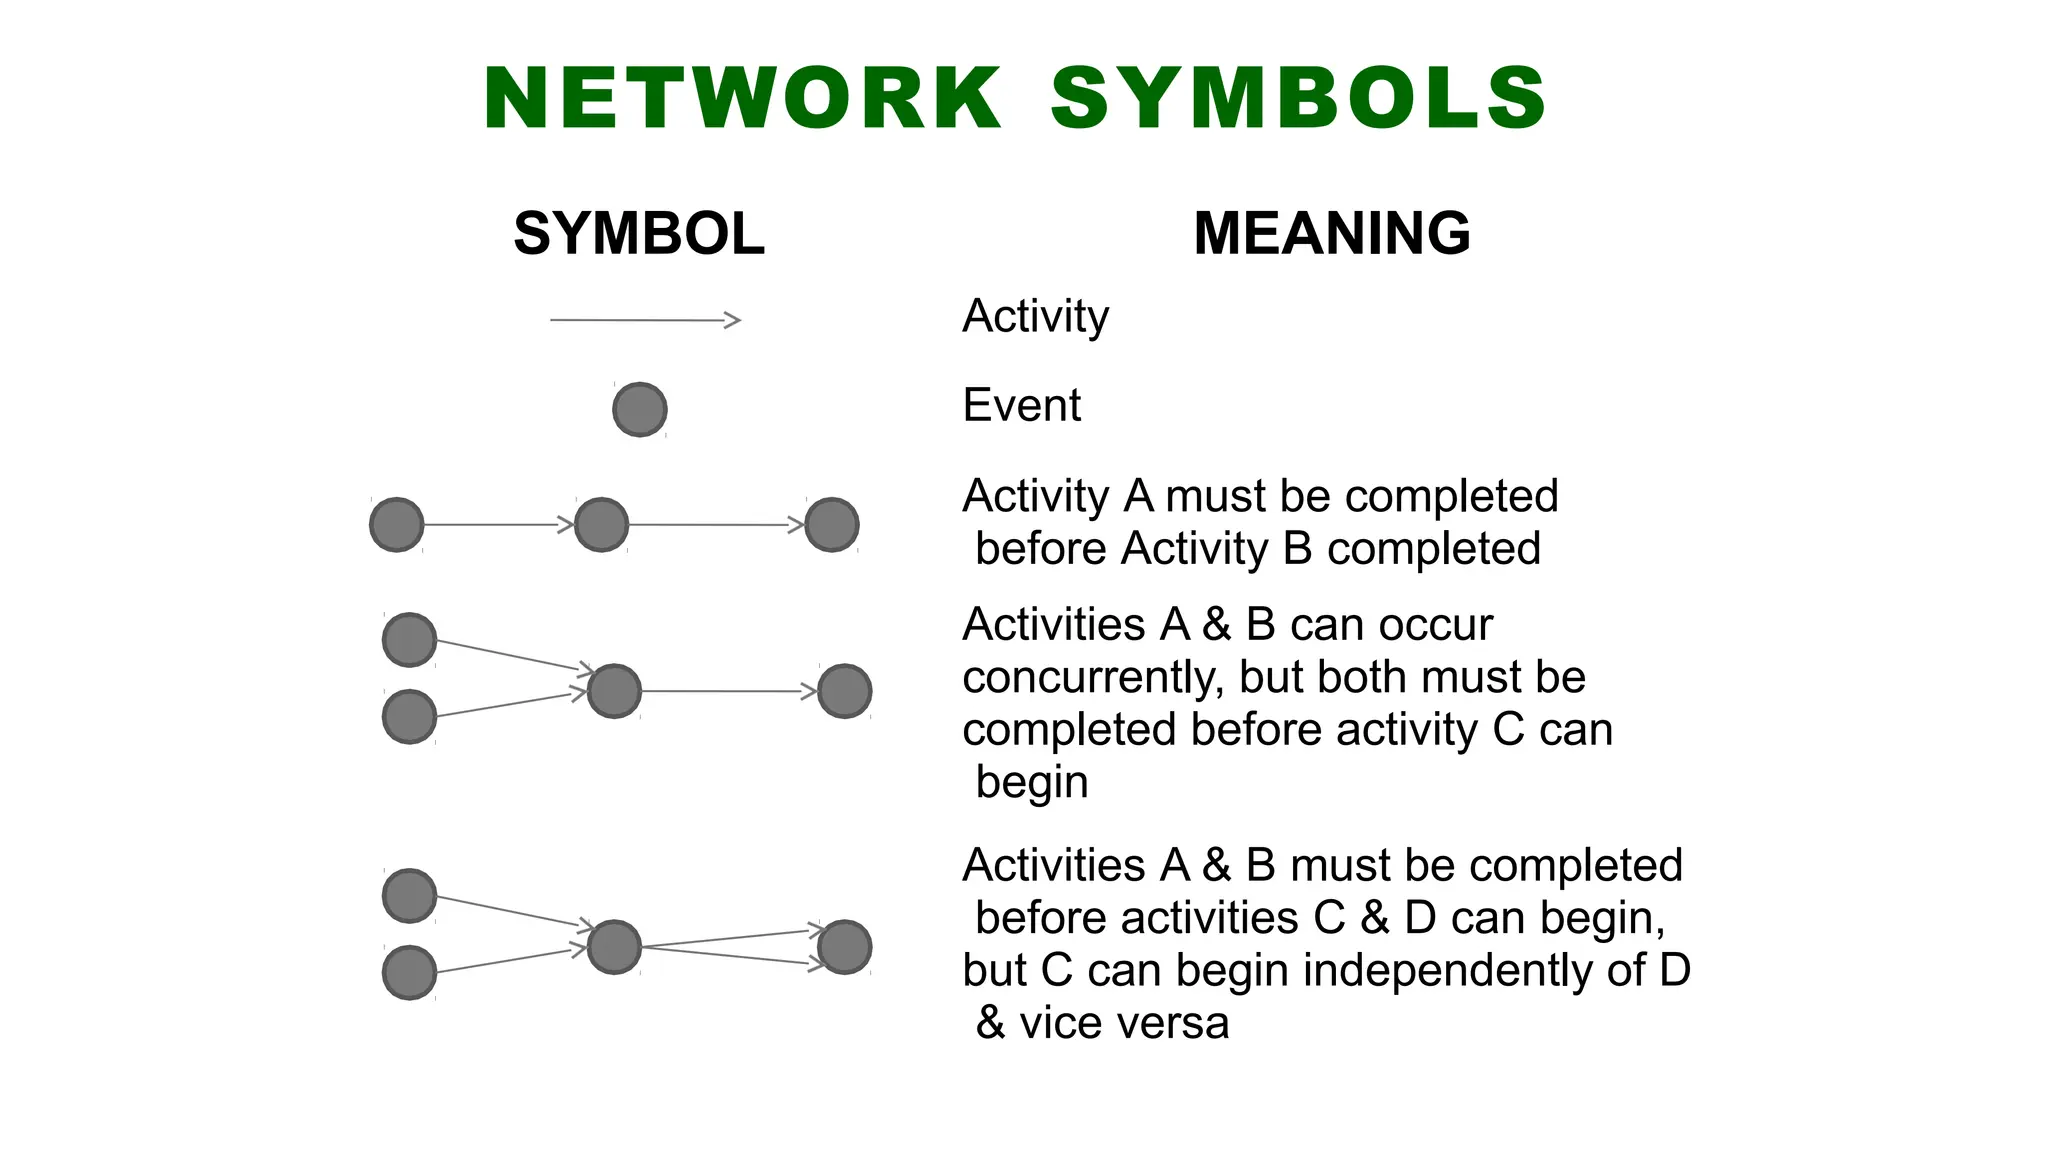
NETWORK SYMBOLS
SYMBOL MEANING
Activity
Event
ActivityA must be completed
before Activity B completed
Activities A & B can occur
concurrently, but both must be
completed before activity C can
begin
Activities A & B must be completed
before activities C & D can begin,
but C can begin independently of D
& vice versa
28.
Types of Event
Aparticular event out of various events on the
network diagram may be specified as:
1. Tail Event
2. Head Event
3. Dual role event
29.
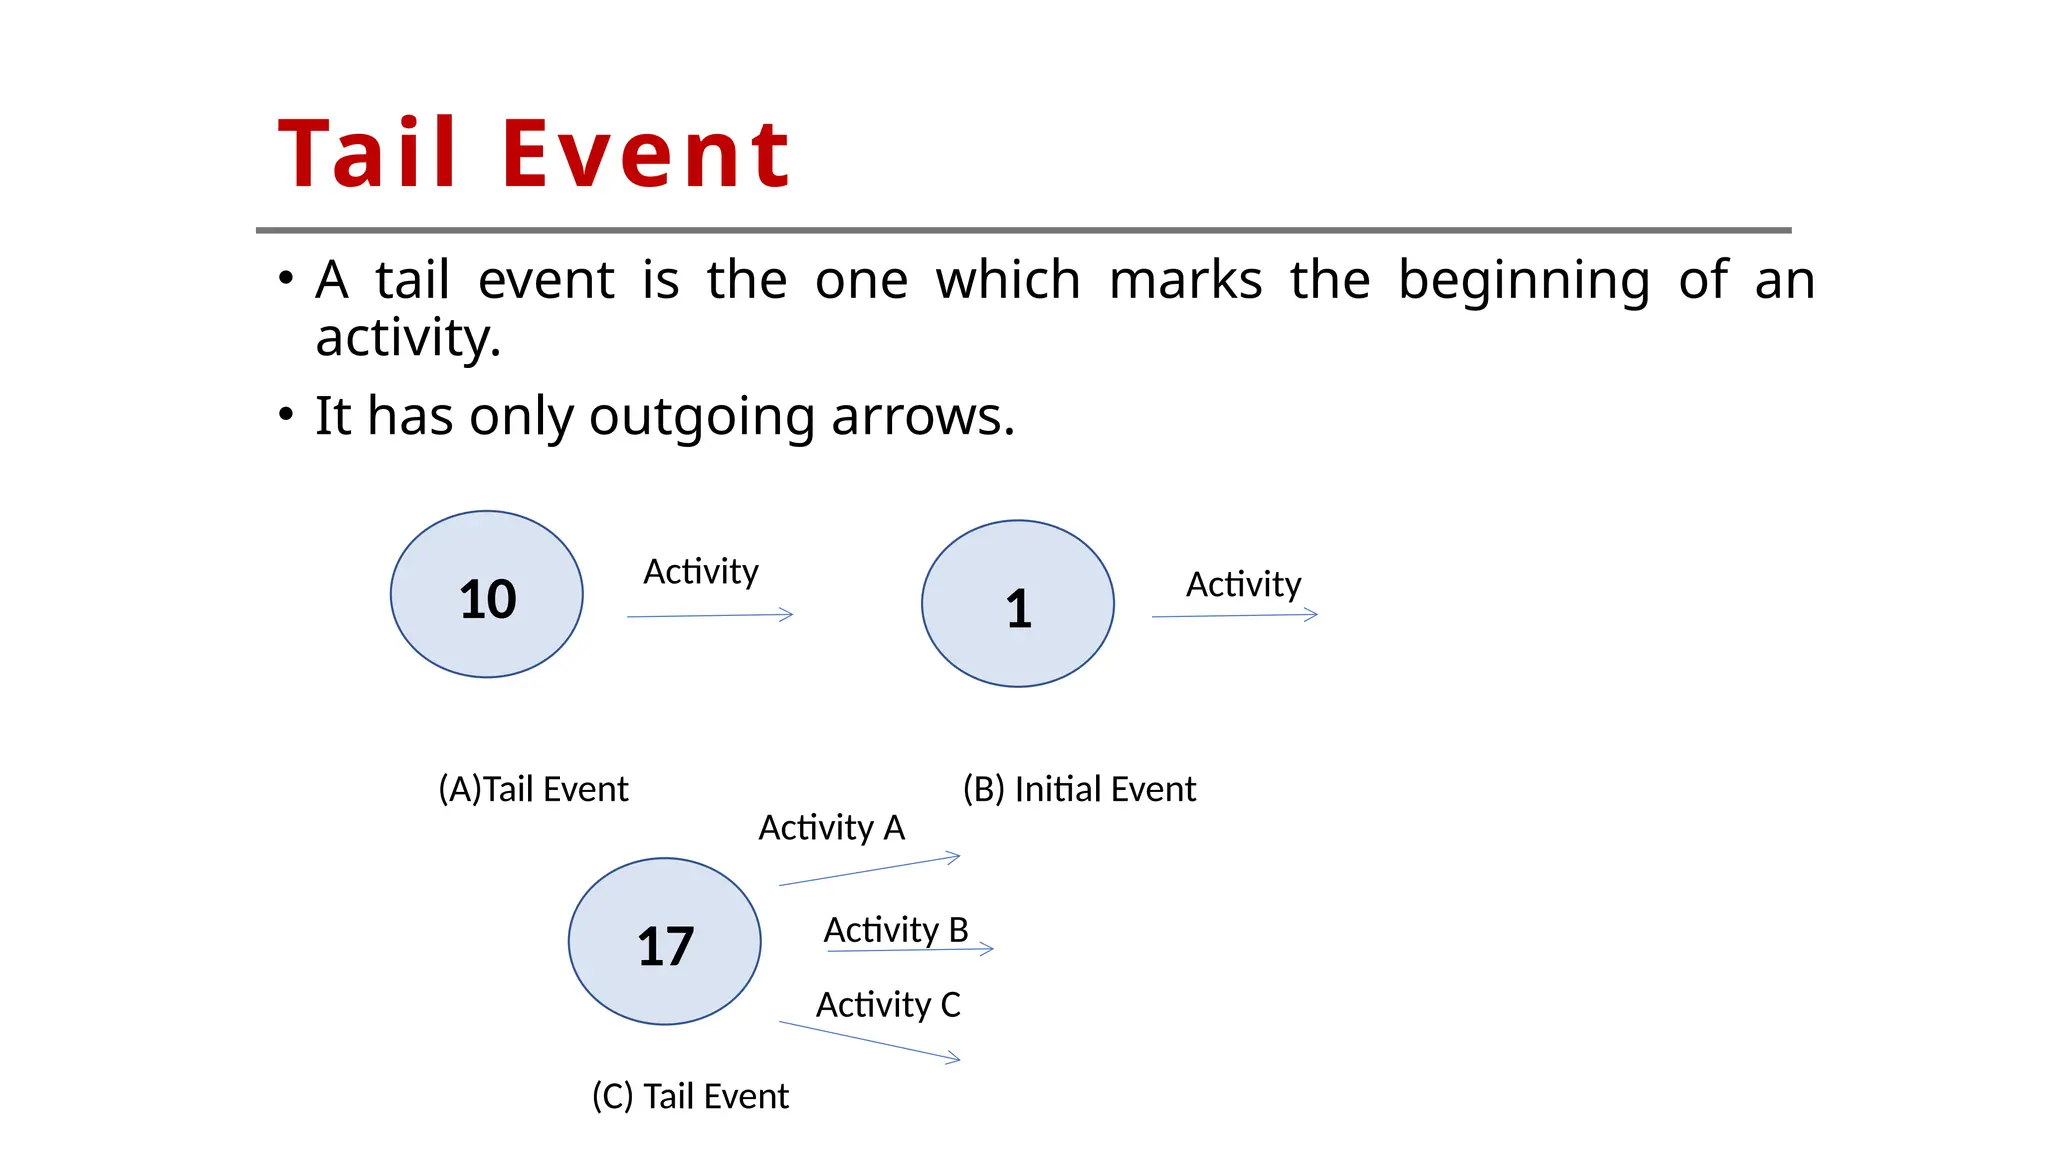
• A tailevent is the one which marks the beginning of an
activity.
• It has only outgoing arrows.
(A)Tail Event (B) Initial Event
(C) Tail Event
Activity Activity
Activity B
Activity A
Activity C
Tail Event
10 1
17
30.
n
Final or
End Event
ActivityB
Activity A
Activity C
Head Event
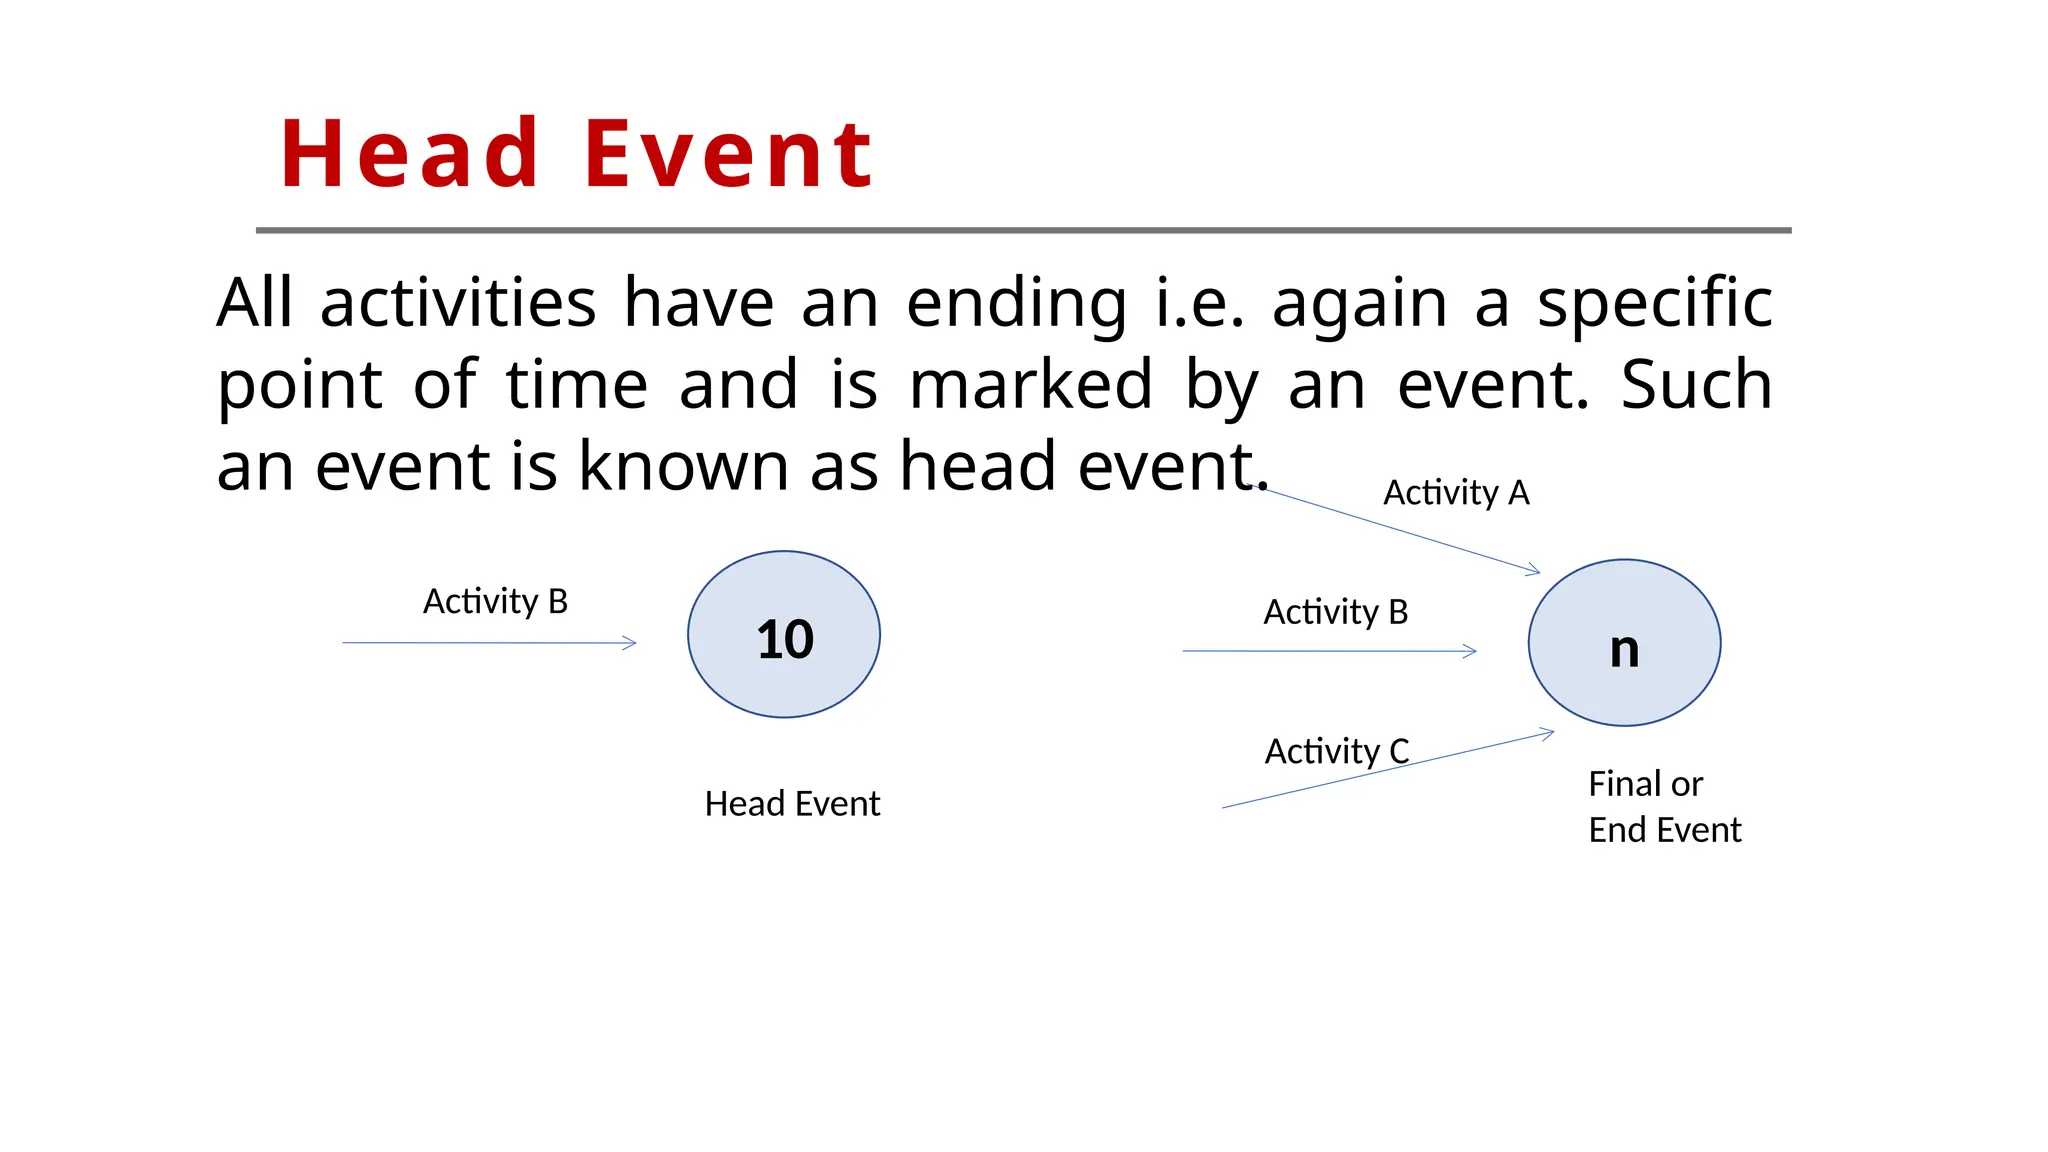
All activities have an ending i.e. again a specific
point of time and is marked by an event. Such
an event is known as head event.
10
Activity B
Head Event
31.
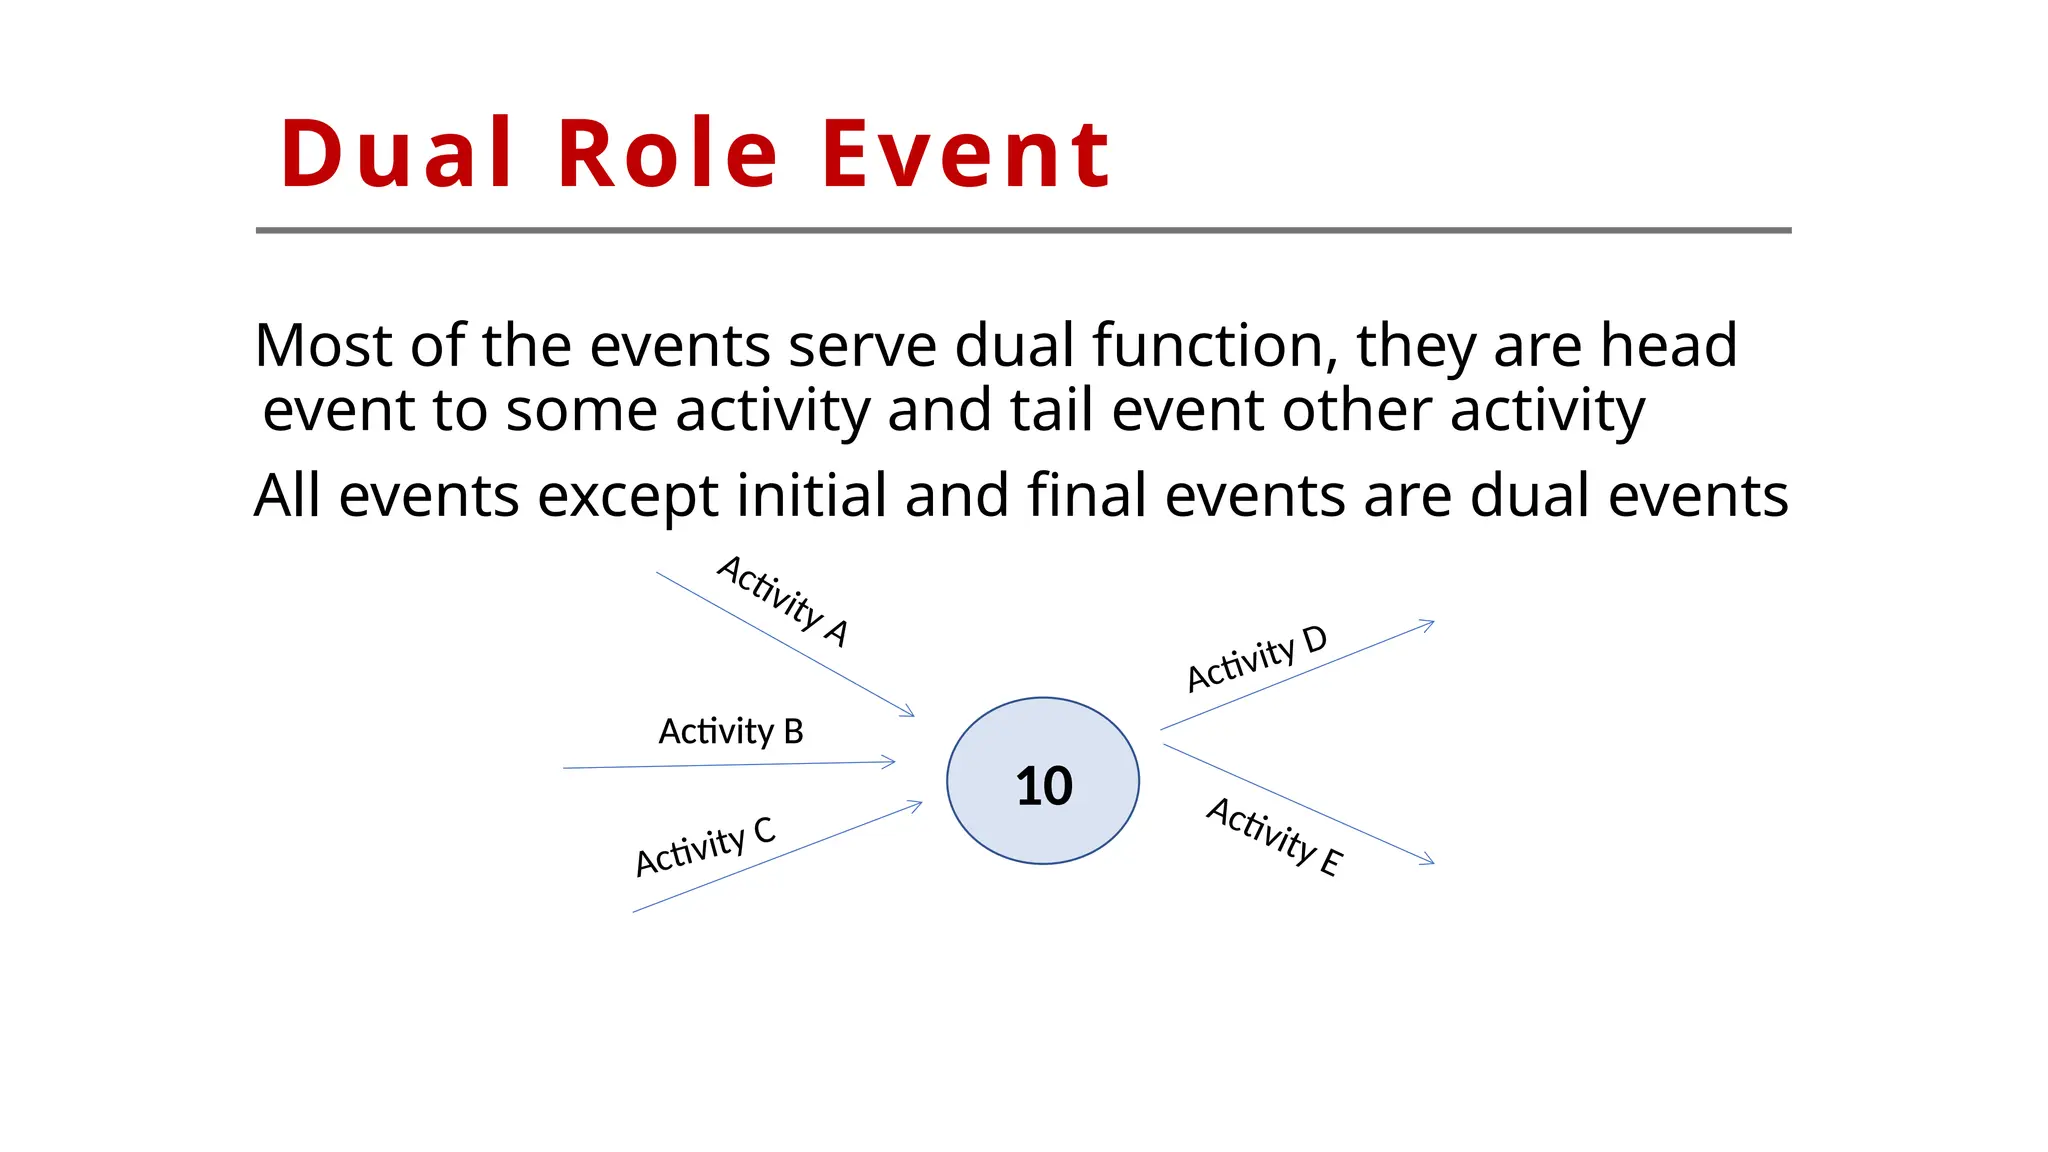
Most of theevents serve dual function, they are head
event to some activity and tail event other activity
All events except initial and final events are dual events
Activity B
Activity E
Dual Role Event
10
Activity C
Activity A
Activity D
Activity B
32.
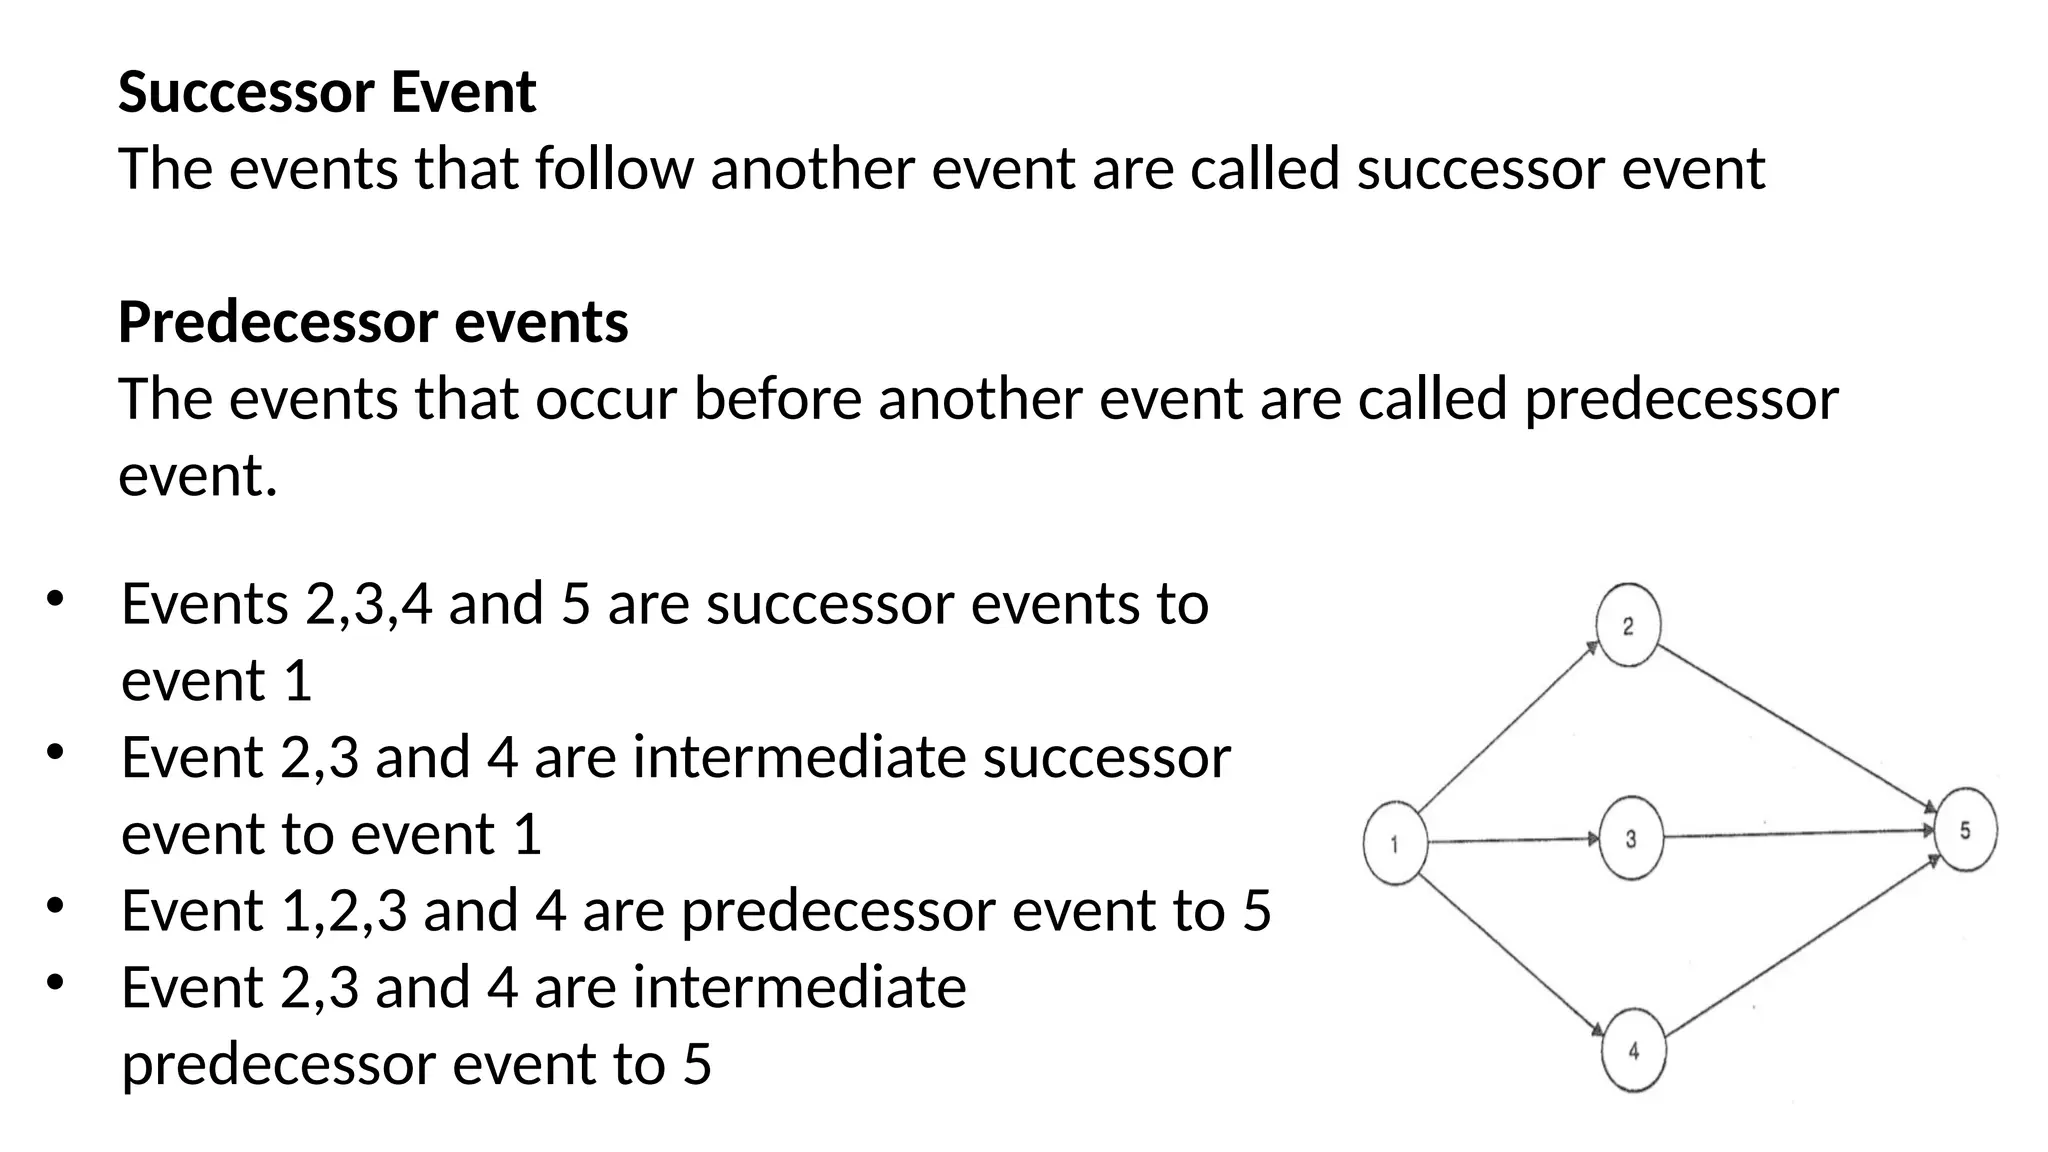
Successor Event
The eventsthat follow another event are called successor event
Predecessor events
The events that occur before another event are called predecessor
event.
• Events 2,3,4 and 5 are successor events to
event 1
• Event 2,3 and 4 are intermediate successor
event to event 1
• Event 1,2,3 and 4 are predecessor event to 5
• Event 2,3 and 4 are intermediate
predecessor event to 5
33.
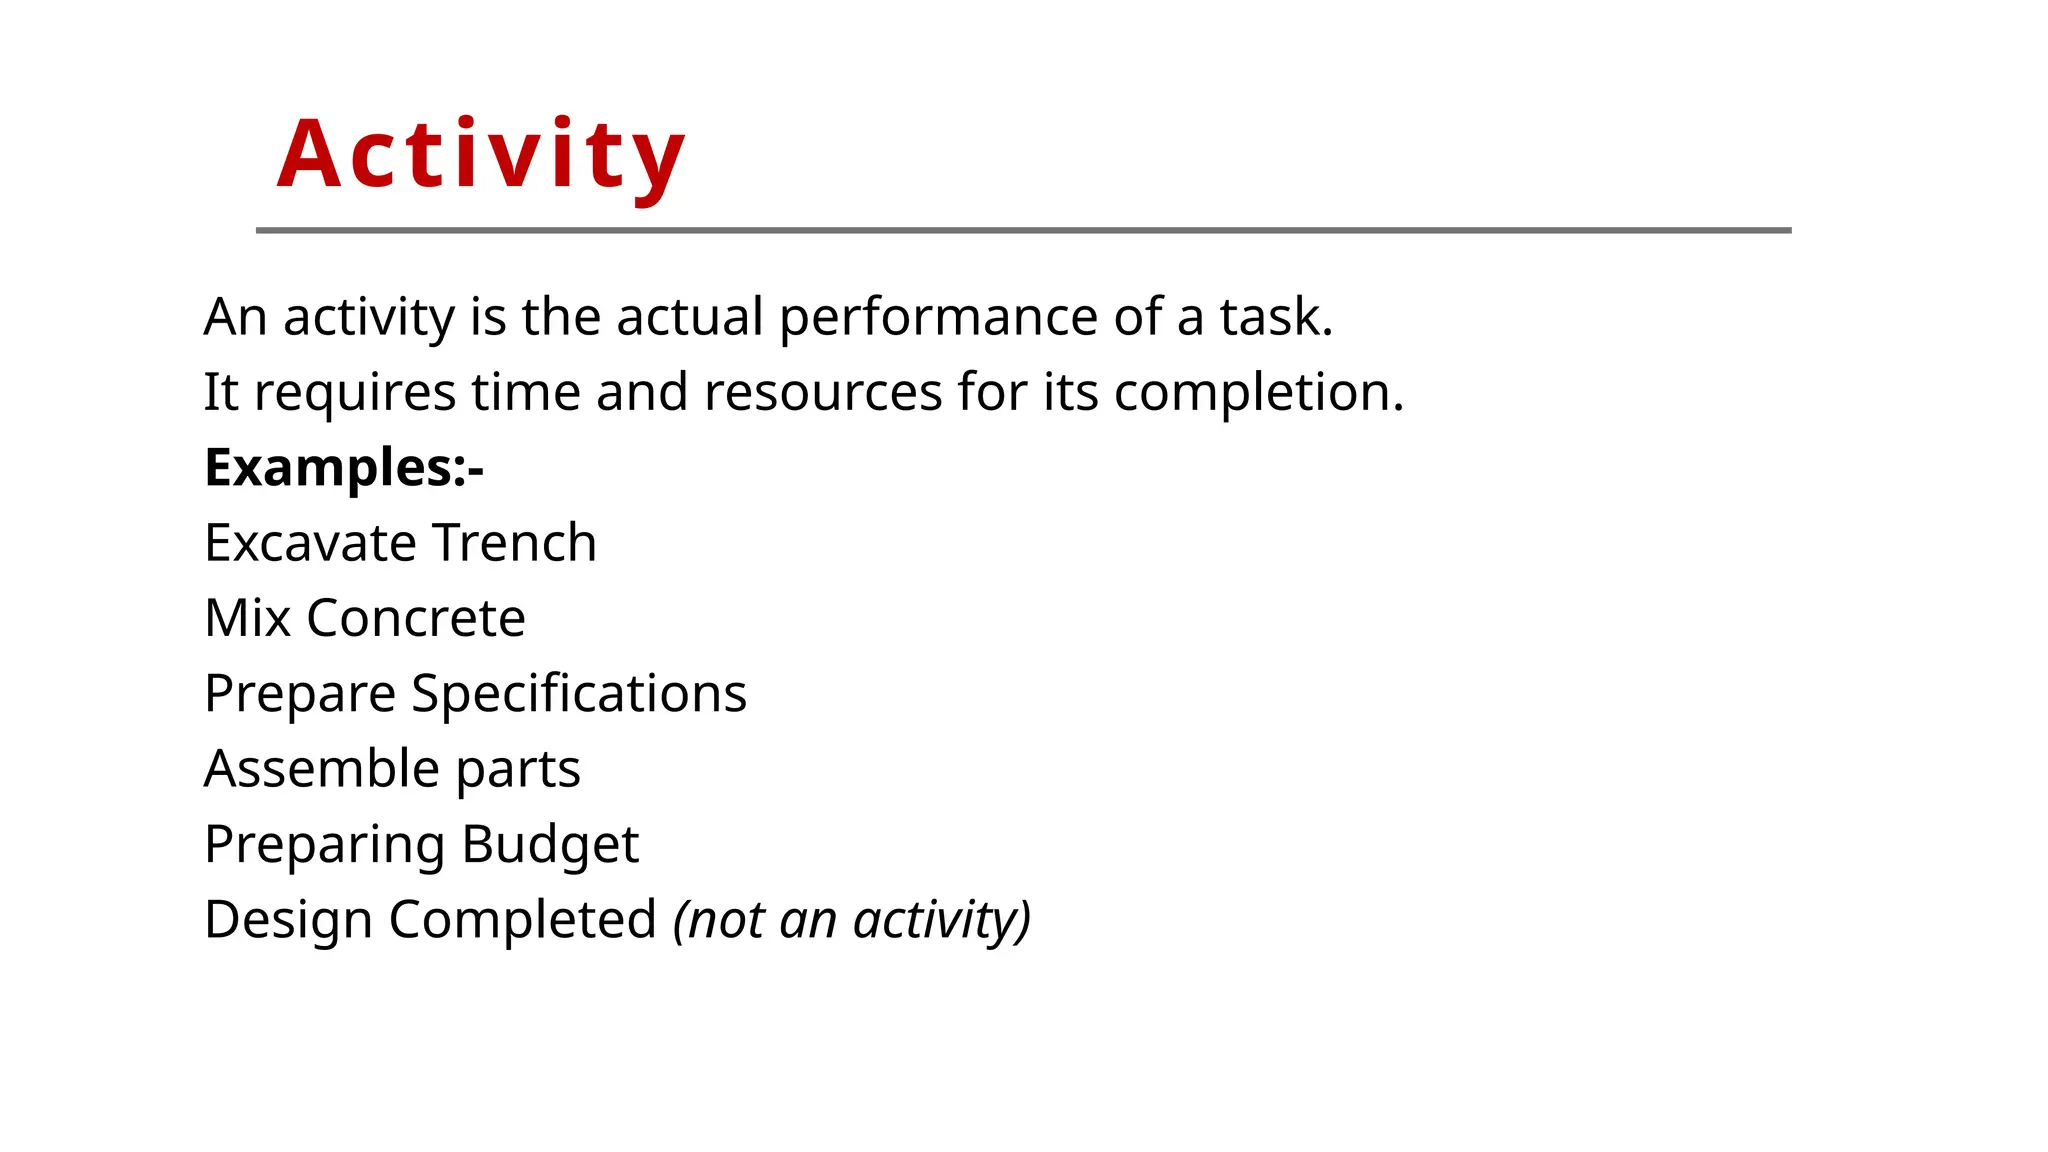
An activity isthe actual performance of a task.
It requires time and resources for its completion.
Examples:-
Excavate Trench
Mix Concrete
Prepare Specifications
Assemble parts
Preparing Budget
Design Completed (not an activity)
Activity
34.
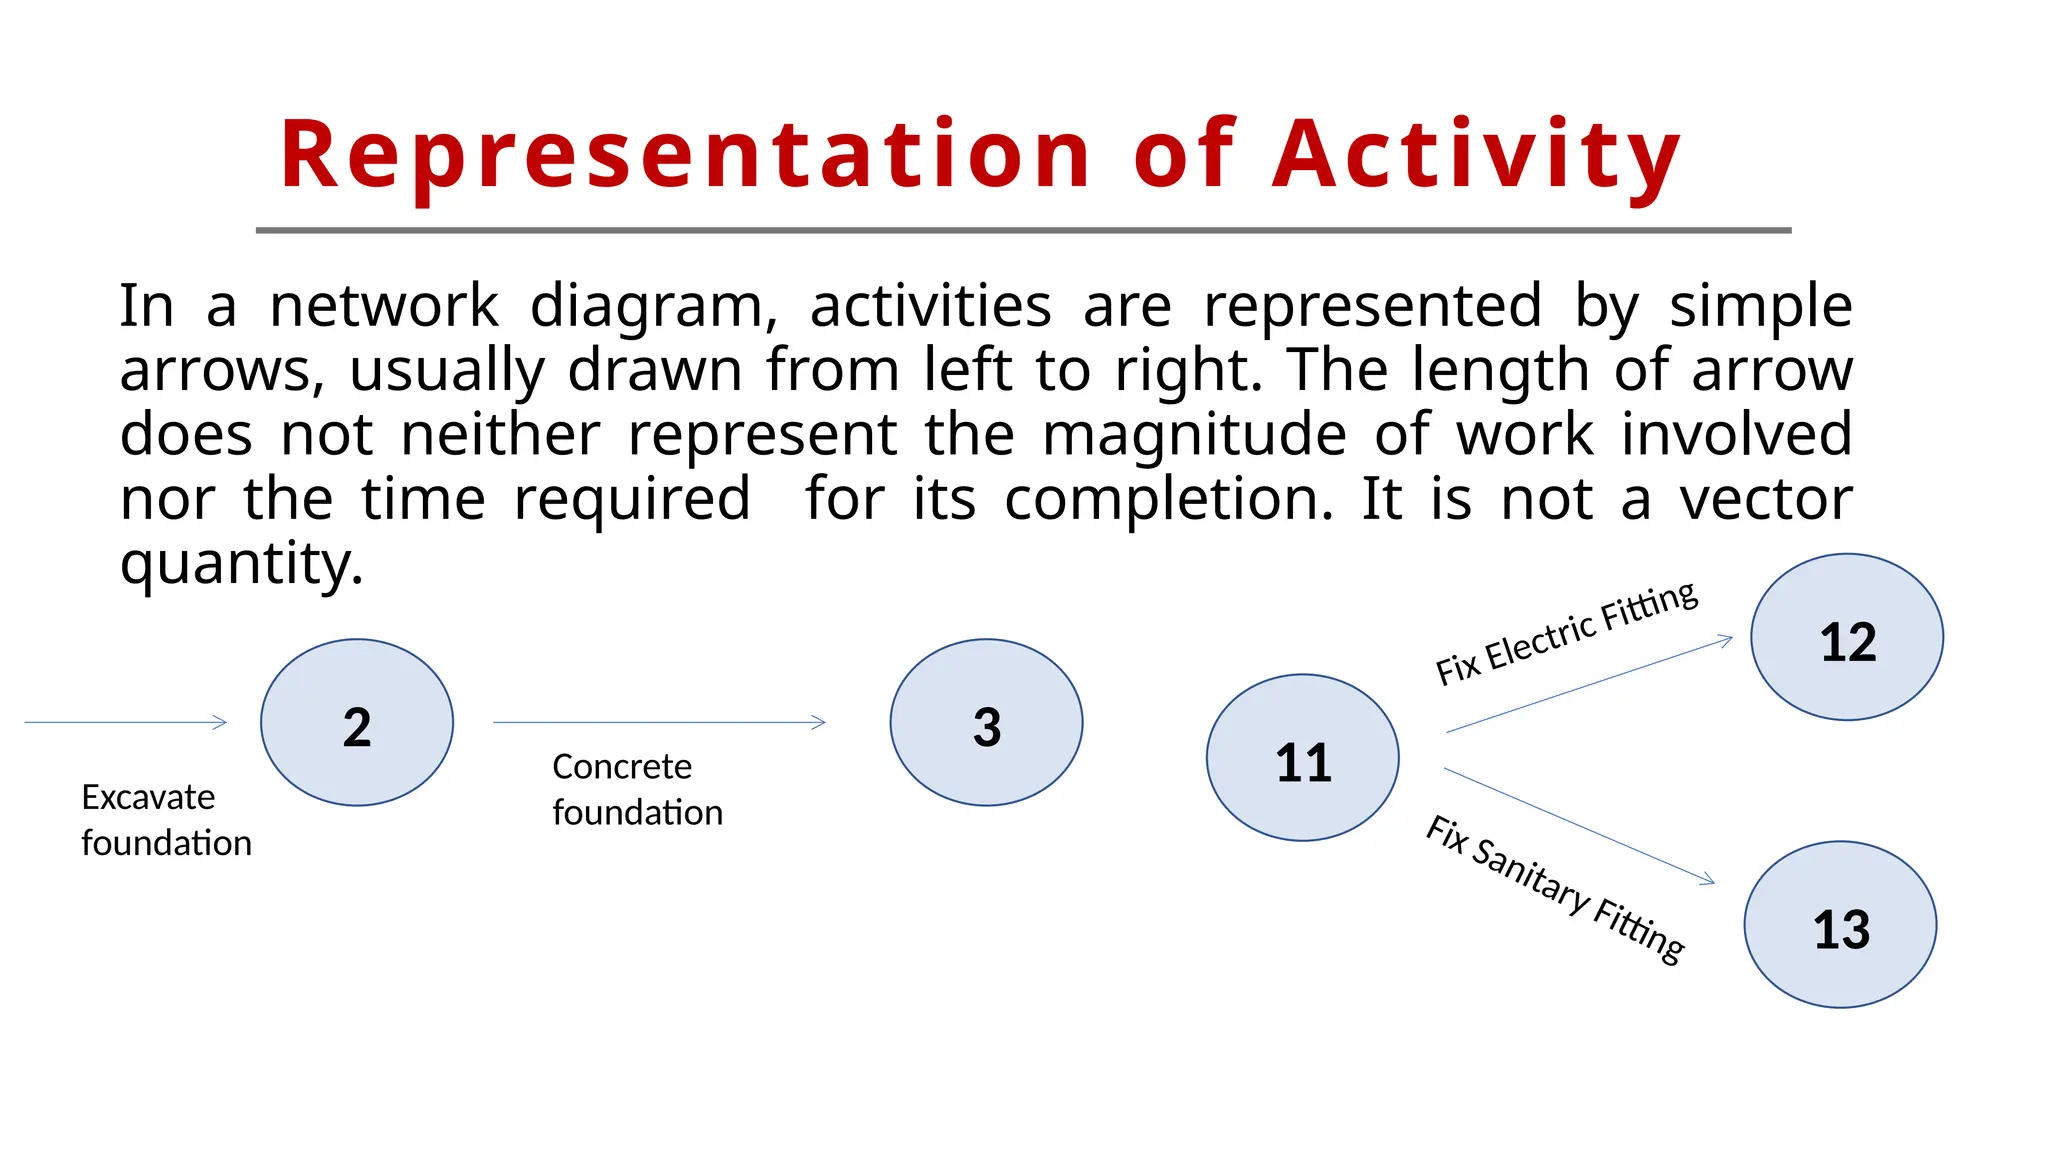
In a networkdiagram, activities are represented by simple
arrows, usually drawn from left to right. The length of arrow
does not neither represent the magnitude of work involved
nor the time required for its completion. It is not a vector
quantity.
Representation of Activity
2
11
12
3
Concrete
foundation
13
Fix Electric Fitting
Excavate
foundation
Fix Sanitary Fitting
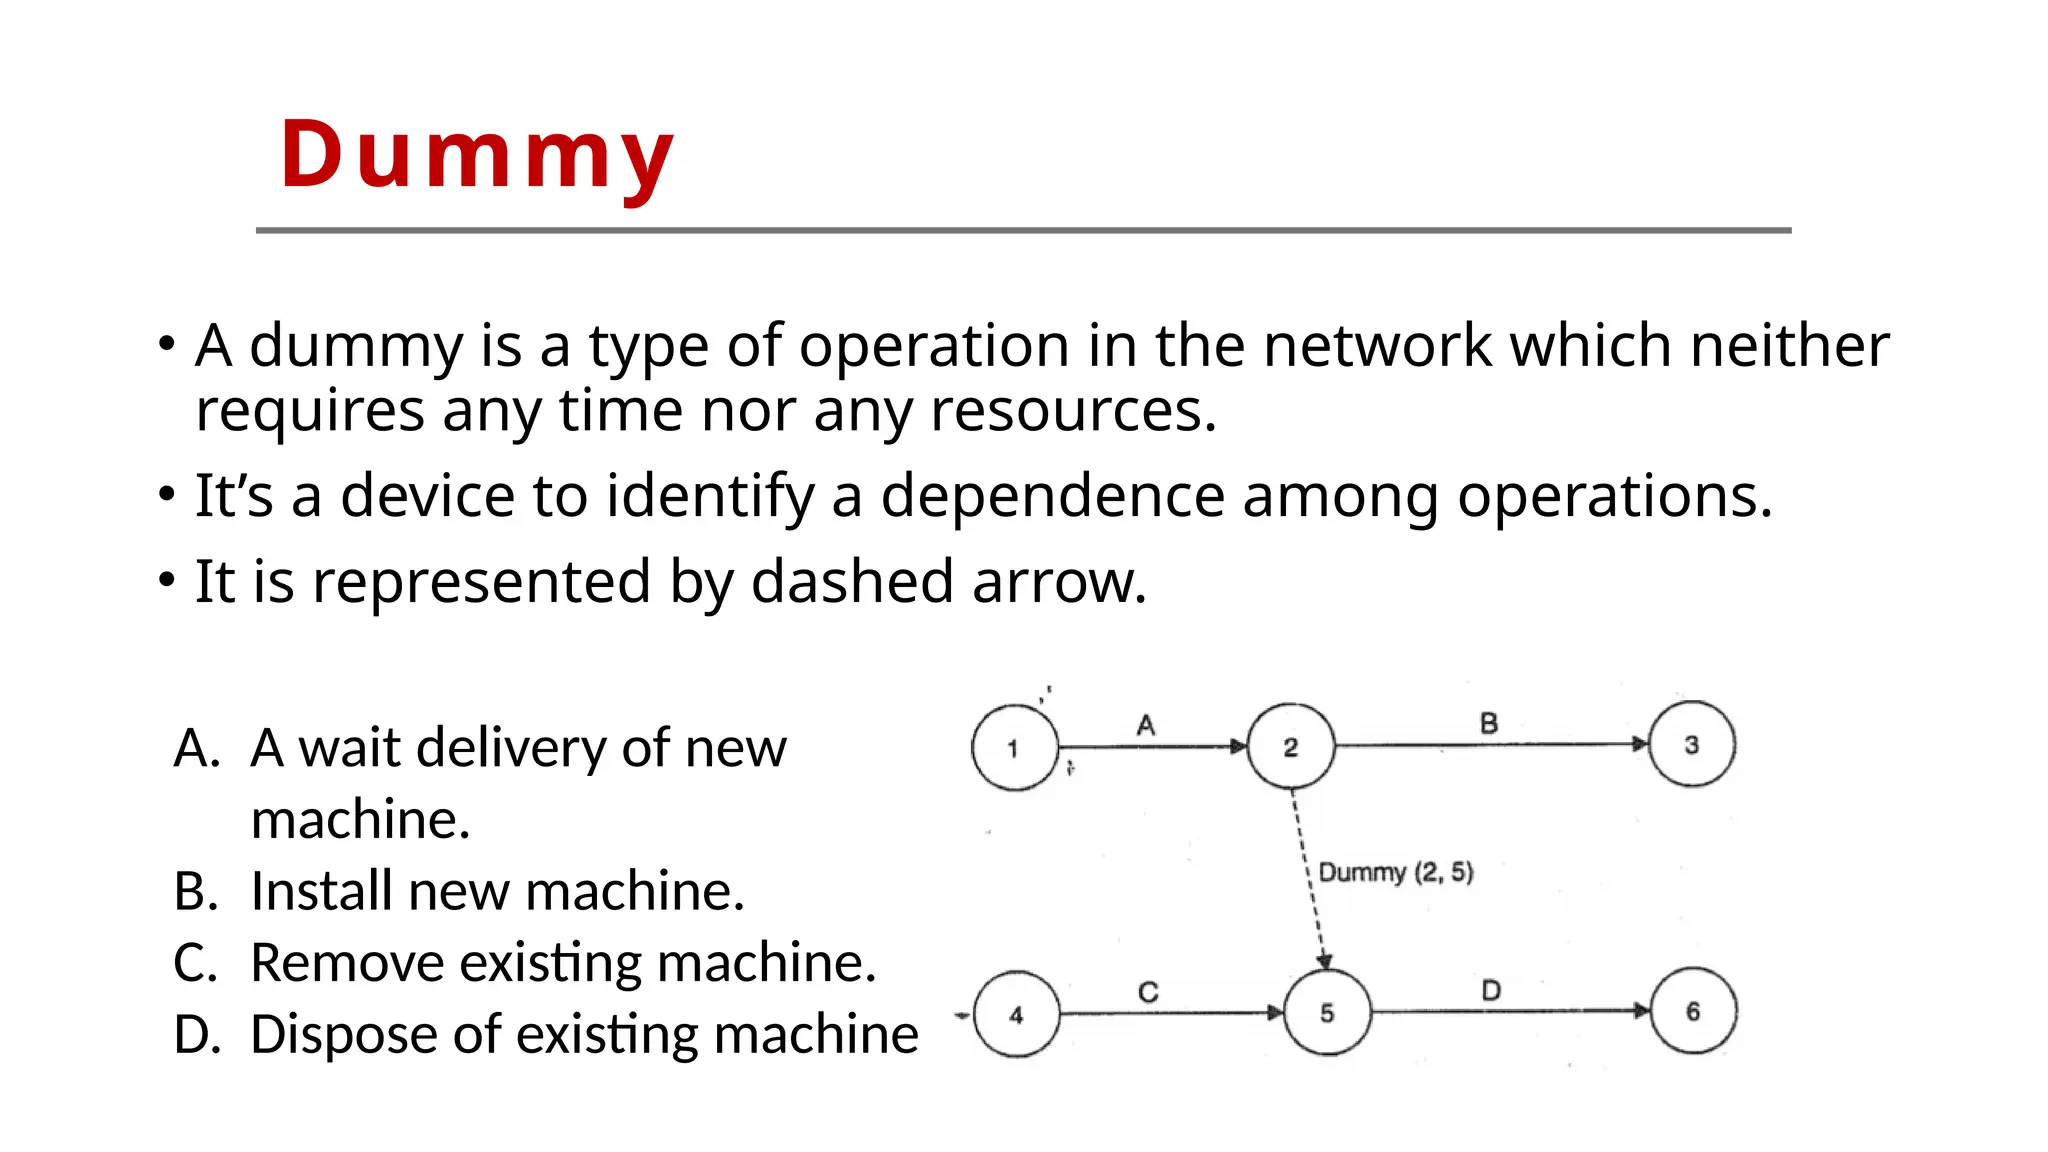
• A dummyis a type of operation in the network which neither
requires any time nor any resources.
• It’s a device to identify a dependence among operations.
• It is represented by dashed arrow.
Dummy
A. A wait delivery of new
machine.
B. Install new machine.
C. Remove existing machine.
D. Dispose of existing machine
37.
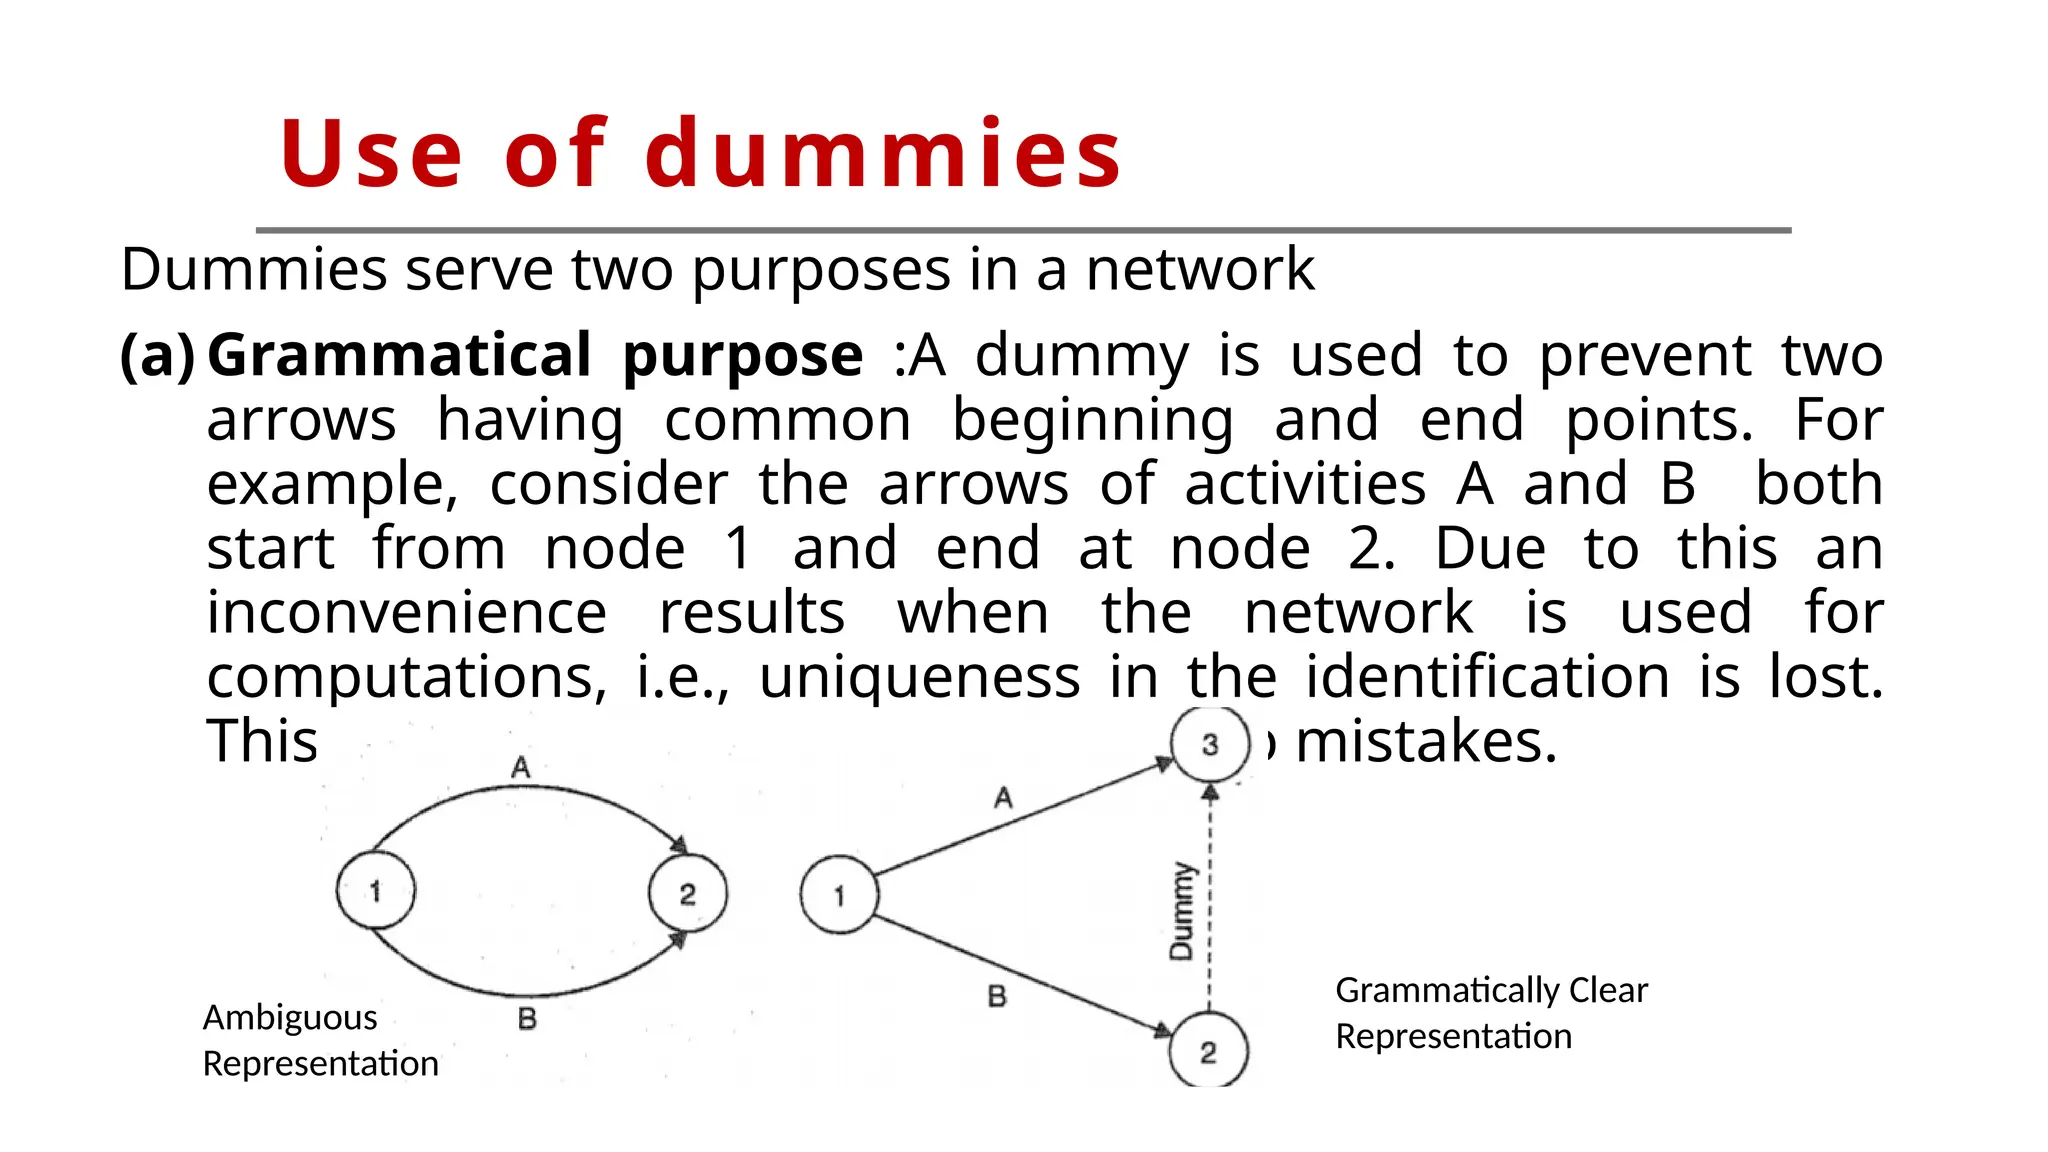
Dummies serve twopurposes in a network
(a) Grammatical purpose :A dummy is used to prevent two
arrows having common beginning and end points. For
example, consider the arrows of activities A and B both
start from node 1 and end at node 2. Due to this an
inconvenience results when the network is used for
computations, i.e., uniqueness in the identification is lost.
This inconvenience frequently leads to mistakes.
Use of dummies
Ambiguous
Representation
Grammatically Clear
Representation
38.
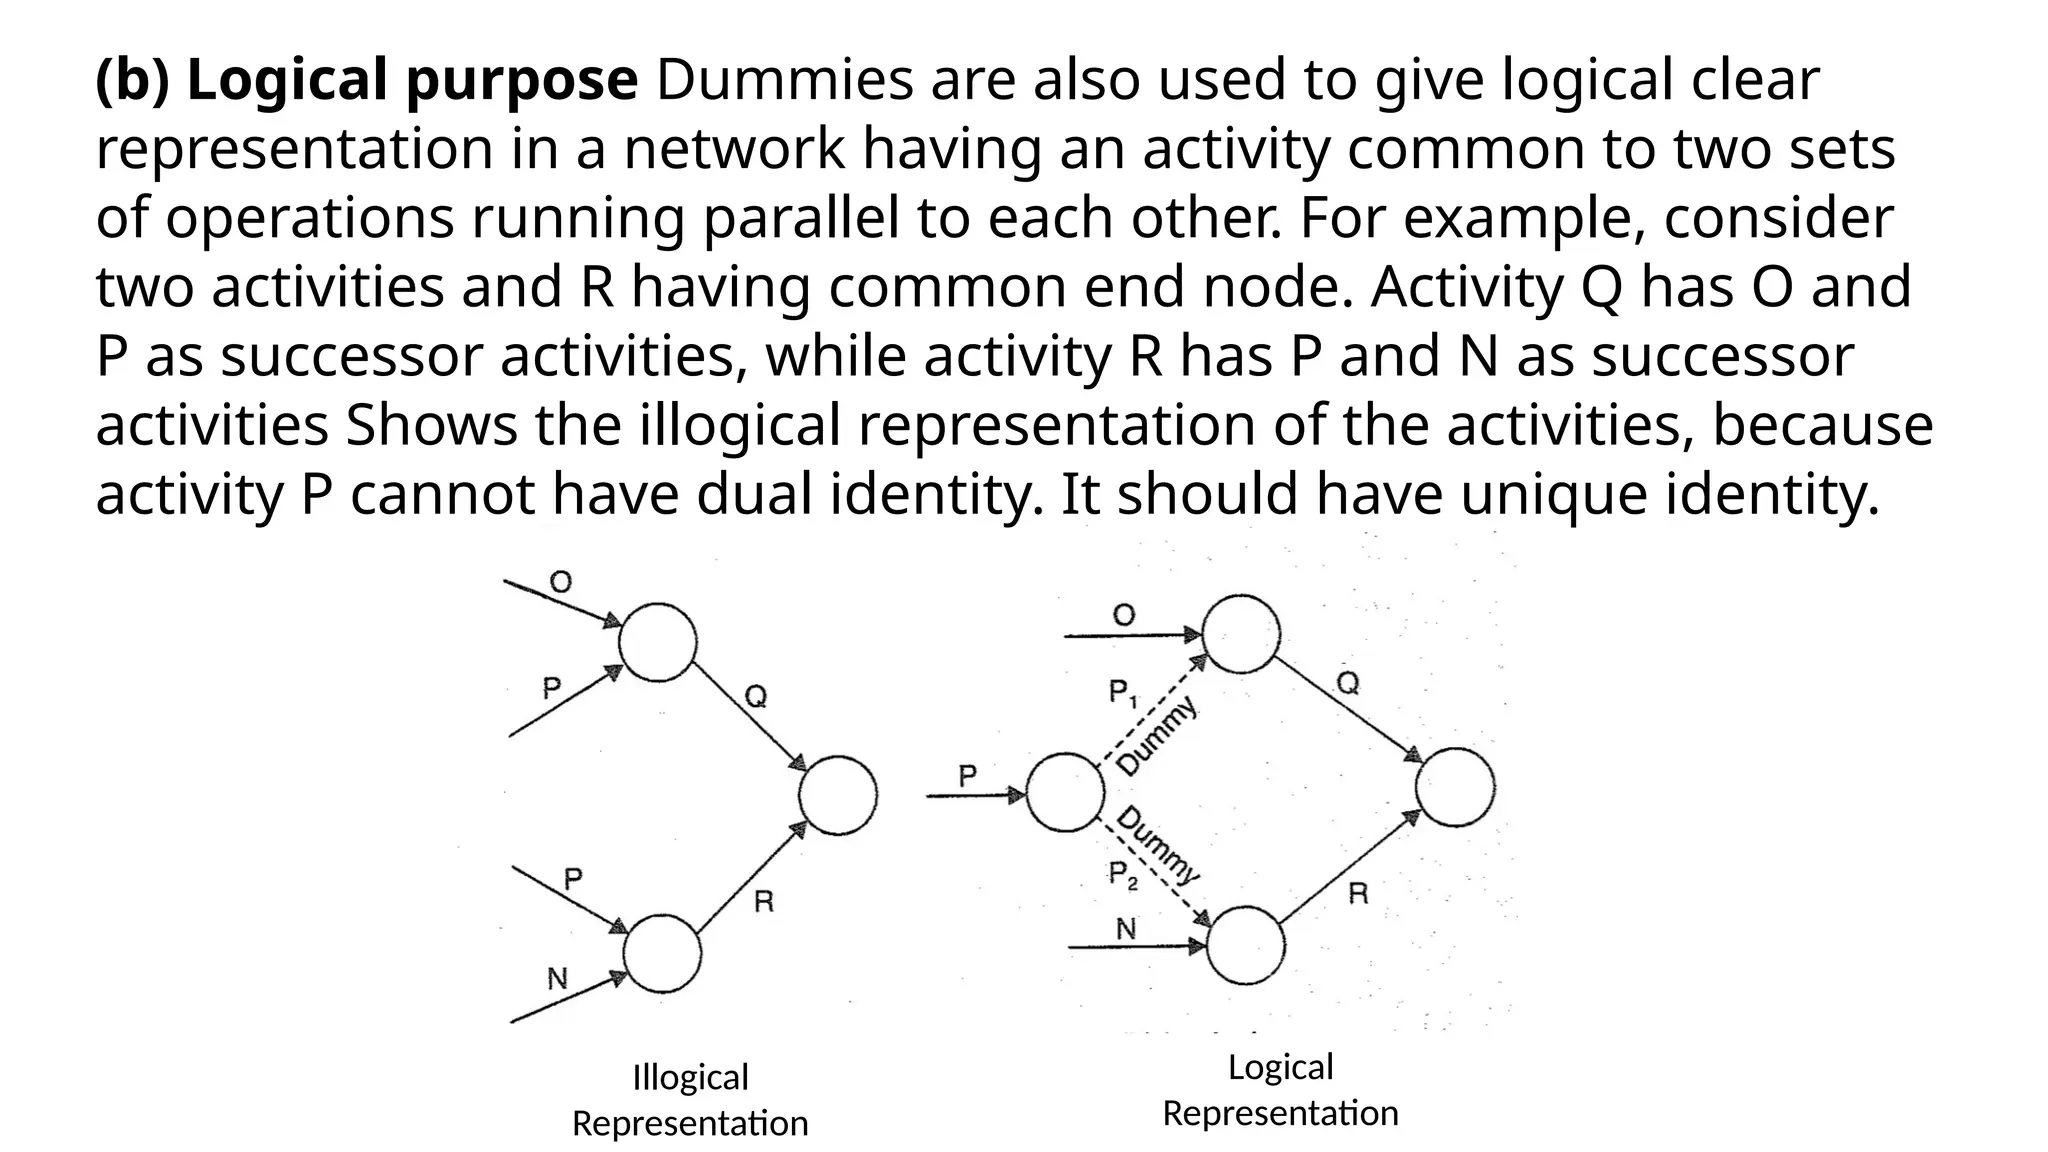
Illogical
Representation
Logical
Representation
(b) Logical purposeDummies are also used to give logical clear
representation in a network having an activity common to two sets
of operations running parallel to each other. For example, consider
two activities and R having common end node. Activity Q has O and
P as successor activities, while activity R has P and N as successor
activities Shows the illogical representation of the activities, because
activity P cannot have dual identity. It should have unique identity.