SlideShare a Scribd company logo
Supply and Demand Guide
To solve the homework problems do the following:
1. Identify the determinant change
2. Shift the appropriate curve in the correct direction
3. Change price appropriately
4. Move along the other curve (the one that did not shift) in
response to the price change.
The following information will tell you the determinants and
how the change, as well as definitions of the key terms.
Demand
Demand: The amount that consumers are willing and able to
purchase at various prices.
Law of Demand: Price and Quantity Demanded vary inversely.
Quantity Demanded: The amount that consumers are willing
and able to buy at a particular price.
Change in Quantity Demanded: Changes in price change the
quantity demanded. This is a Movement Along a Demand Curve
in Response to a Price Change.
Change in Demand: This is a shift in the position of the
demand curve, either upward or downward. If the curve shifts
upward, consumers are saying they will pay more for all
quantities of the good or service. If it shifts downward,
consumers are saying they will pay less for all quantities of the
good or service.
Determinants of Demand: The Demand Curve will shift only
when one (or more) of the Determinants of Demand changes.
These determinants are:
1. Size of Market: the number of consumers in the market for
the good or service. If this factor increases, the curve shifts
upward (increase in demand). If this decreases, the curve shifts
downward (decrease in demand).
2. Consumer Tastes and Preferences: if these shift in favor of a
product, the demand curve shifts upward (demand increases); if
these shift against a product, the demand curve shifts downward
(demand decreases).
3. Consumer Income: as the income of consumers increase,
consumers purchase more of all normal goods (assume all the
goods in the homework are normal goods), this shifts the
demand curve upward (demand increases); if income decreases,
then consumers buy less of all normal goods, this shifts the
demand curve downward (demand decreases).
4. Prices of Related Goods:
a. Complimentary Goods: These are goods that are used to
together like peanut butter and jelly. If the price of peanut
butter goes up, the Quantity Demanded of peanut butter will
decrease (a movement along a demand curve in response to a
price change). However, the Demand for jelly will decline
(decrease in demand) as fewer people buy it to go with the
peanut butter, since they are buying less peanut butter.
b. Substitute Goods: These are goods that are used in place of
each other. If the price of Coke Cola goes up, the Quantity
Demanded of Coke does down (a movement along the demand
curve). But the Demand for Pepsi – the substitute good – goes
up as people substitute the lower priced Pepsi for the higher
priced Coke (the Pepsi demand curve shifts upward).
5. Expectations about the Future: If people have a positive
view of the future they will consumer more and save less. This
shifts the demand curve for all normal goods upward. If people
have a negative view of the future, they will consume less and
save more, this shifts the demand curve for all normal goods
downward.
Supply
Supply: The amount that producers are willing and able to
bring to market at various prices.
Law of Supply: Price and Quantity Supplied vary directly.
Quantity Supplied: The amount that producers are willing and
able to bring to market at a particular price.
Change in Quantity Supply: Changes in price change the
quantity supplied. This is a Movement Along a Supply Curve in
Response to a Price Change.
Change in Supply: This is a shift in the position of the supply
curve, either upward (inward) or downward (outward). If the
curve shifts upward, producers are saying they will bring less to
market at all prices. If it shifts downward, producers are saying
they will bring more to market at all prices.
Determinants of Supply: The Supply Curve will shift only when
one (or more) of the Determinants of Supply changes. These
determinants are:
1. Number of Firms in the Industry: If the number of firms in
an industry increases, the more the industry can produce – this
shifts the supply curve downward (outward) – this is an increase
in supply. If the number of firms in an industry decreases, the
industry can produce less output – this shifts the supply curve
upward (inward) – this is a reduction in supply.
2. Relative Price of Alternative Outputs: If a firm can produce
Product A or Product B with the same resources (inputs), it will
produce the product with the higher price. If the price of
Product A increases relative to Product B, then the firm will
produce more of A and less of B. This causes the Supply Curve
for A to shift outward (increase in supply) and the Supply Curve
for B to shift upward (decrease in supply).
3. Costs of Production*: The costs of production is the primary
determinant of supply. If the costs of production increase, then
supply decreases – the Supply Curve shifts inward (a decrease
in supply). If the costs of production decrease, then supply
increases – the Supply Curve shifts outward (an increase in
supply).
4. Expectations About the Future: If firms have a positive view
of the future, they will increase production which is an increase
in supply – the curve shifts outward. If firms have a negative
view about the future, they will decrease production and the
supply curve will shift upward – a decrease in supply.
* The Costs of Production include:
· Prices of inputs – the Factors of Production
· Business Taxes
· Complying with regulations
· Less any Subsidies the firm may receive
In equilibrium, the quantity supplied equals the quantity
demanded.
Graph A
When one or more of the determinants of demand (see above)
change such that the demand for a good increases, that shows
that consumers are willing to pay more for all possible
quantities of the good. The upward shift in the demand curve
causes an increase in price. Suppliers respond to the higher
market price by bringing a greater quantity supplied to market –
recall the Law of Supply.
SHAPE
Graph B
When one or more of the determinants of demand (see above)
change such that the demand for that good decreases. The
demand curve reflects this by shifting downward, showing the
consumers are willing to pay less for all possible quantities of
the good. This causes a decrease in price. Suppliers respond to
the price change by bringing a lesser quantity supplied to
market - recall the Law of Supply.
SHAPE
Graph C
When one or more of the determinants of supply (see above)
change such that the supply for that good increases, the supply
curve shifts outward showing that suppliers can bring more
product to market at lower prices for all possible quantities.
This causes a decrease in price. Demanders will respond to the
price change with a greater quantity demanded – recall the Law
of Demand.
SHAPE
Graph D
When one or more of the determinants of supply (see above)
change such that the supply for that good decreases, the supply
curve shifts inward showing the suppliers can bring fewer
products to market at higher prices for all possible quantities.
This causes an increase in price, and demanders are willing to
buy a lesser quantity demanded – recall the Law of Demand.
SHAPE
Q
P
P*
Q*
S
D
Q
P
P*
Q*
S
D
D’
Q
P
P*
Q*
S
D
D’
Q
P
P*
Q*
S
D
S’
Q
P
P*
Q*
S
D
S’
To be used with the supply and demand guide
Supply and Demand Graphs
1
Review of x and Y axis
A graph consists of two axes called the x (horizontal/quantity)
and y (vertical/price) axes.
The point where the two axes intersect is called the origin. The
origin is also identified as the point (0, 0).
X axis
Moving right from the origin of (0,0), the numbers ascend.
Moving left from the origin, the numbers descend.
Y axis
Moving up from the origin of (0,0), the numbers ascend.
Moving down from the origin, the numbers descend.
In this course, we will mainly be using the upper right quadrant
of the graphic area.
In economics it is the norm to show the independent variable on
the y-axis and the dependent variable on the x-axis.
2
The Demand Curve
Demand Curve - A downward sloping curve that measures the
relationship between the price of a good and the quantity
demanded by consumers.
Demand - The amount that consumers are willing and able to
purchase at various prices.
Change in Demand – A shift in the position of the demand curve
that occurs in response to a change in one or more of the
determinants of demand (non-price induced change).
Law of Demand – All other factors equal, the higher the price of
the good or service, the lower the quantity demanded (price
induced change). And the lower the price, the higher the
quantity demanded. Price and Quantity Demanded vary
inversely.
Change in Quantity Demanded – A change in the quantity
consumers are willing and able to purchase. It is a response to
a change in the market price.
3
Why does the demand curve shift?
The Determinants of demand
Shifts in the curve (change in demand) result from changes in
one or more of the non-price determinants of demand:
Number of Consumers in the market (Size of Market)
Consumer Tastes and Preferences
Consumer Income
Prices of Related Goods (Substitute Goods and Complimentary
Goods)
Expectations about the Future
4
The Demand Curve: Increases In Demand
Increase in Demand
Curve shifts to the right as a result of an increase in demand by
the consumers (D1 to D2). This is caused by a change in one or
more of the determinants of demand.
This causes Price to increase (P1 to P2). This shows a
willingness to pay a higher price for all possible quantities of
the good.
Suppliers respond to the higher price by increasing Quantity
Supplied (q1 to q2) .
This process results in a new Equilibrium at e2 with
Equilibrium Price P2 and Equilibrium Quantity q2.
5
The Demand Curve: Decreases In Demand
Decrease in Demand
Demand curve shifts to the left as a result of a decrease in
demand by the consumers (D1 to D2). This is caused by a
change in one or more of the determinants of demand.
This causes Price to decrease (P1 to P2). This shows a
decreased willingness to pay for all possible quantities of the
good.
Suppliers respond to the lower price by decreasing Quantity
Supplied (q1 to q2) .
This results in a new Equilibrium at e2 with Equilibrium Price
P2 and Equilibrium Quantity q2.
6
Supply Curve
Supply Curve - A curve that normally slopes upward (to the
right) representing the quantity of a product producers are
willing and able to bring to market at various prices.
Supply – The amount that producers are willing and able to
bring to market at various prices.
Change in Supply – A shift in the position of the supply curve
in response to a change in one or more of the determinants of
supply (non-price induced change).
Law of Supply – All other factors equal, the higher the price of
a good or service, the greater the quantity supplied to the
market (price induced change). And the lower the price, the
lower the quantity supplied. Price and Quantity Supplied vary
directly.
Change in Quantity Supplied – A change in the quantity
producers are willing and able to bring to market. It is a
response to a change in the market price.
7
Why does the supply curve shift?
The determinants of supply
Shifts in the curve can be attributed to changes in one or more
of the non-price determinants of supply:
Costs of Production:
Input prices (prices of the Factors of Production - resources)
Taxes
Regulatory compliance costs
Legal Expenses
Transactions Costs
Number of Firms in the Industry (productive capacity)
Relative Prices of Alternative Outputs
Technology (sometimes this is grouped with costs of production
as technology determines the methods of production available to
the firm)
Expectations about the Future
8
The Supply Curve: Increases In Supply
Increase in Supply
Supply curve shifts to the right as a result of increased supply
in the market. (S1 to S2). This is caused by a change in one or
more of the determinants of supply.
This causes Equilibrium Price to decrease (P1 to P2).
In response to the lower price, Quantity Demanded increases
(q1 to q2).
This produces a new Equilibrium e2 at Equilibrium Price P2
and Equilibrium Quantity q2.
9
The Supply Curve: Decreases In Supply
Decrease in Supply
Supply curve shifts to the left as a result of decreased supply in
the market. (S1 to S2). This is caused by a change in one or
more of the determinants of supply.
This causes Equilibrium Price to increase (P1 to P2).
In response to the higher price, Quantity Demanded decreases
(q1 to q2).
This produces a new Equilibrium at e2 and Equilibrium Price P2
and Equilibrium Quantity q2.
10
Steps to solve supply and demand problems
Use the following steps – in the order provided – to solve
supply and demand problems.
Remember that changes occur for a reason and it is important to
follow that chain of causation in all economic analysis.
The Steps:
Identify the determinant change indicated in the problem;
Shift the curve whose determinant has changed;
Shift it in the direction indicated by the determinant change;
Change the market price in line with the curve shift;
Move along the other curve in response to the price change
(change in quantity demanded or quantity supplied as
appropriate);
Find the new market equilibrium price and quantity.
11
An example:
The Fresh Fruit Market
Start with the Fresh Fruit market in equilibrium as shown in the
graph.
At equilibrium point e, the amount that consumers wish to buy
at price P is exactly equal to the amount that producers wish to
sell at price P.
The quantity demanded is equal to the quantity supplied at the
market price of P (quantity demanded = quantity supplied).
The market clears – there is no shortage and no surplus.
Then consumers decide to eat healthier foods, including more
fresh fruit.
The determinant that changes is Consumer Tastes and
Preferences.
12
An example:
The Fresh Fruit Market – Step 2
Since consumers have now decided to consumer (buy) more
fresh fruit, the demand curve shifts to the right.
This shift graphically shows that consumers want more fresh
fruit.
AND that they are willing and able to pay more for all
quantities of fresh fruit.
This change is shown in the graph as the shift of the demand
curve from D1 to D2.
13
An example:
The Fresh Fruit Market – Step 3
In response to the higher demand, the market price increases
(P1 to P2).
This, again, shows that consumers are willing and able to pay
more of the larger quantities of fresh fruit that they now want to
buy.
The new price is shown as P2 in the graph of the Fresh Fruit
Market.
14
An example:
The Fresh Fruit Market – Step 4
In response to the new higher price, producers will move along
their supply curve from P1 at e1 to P2 at e2 and bring a higher
quantity of fresh fruit to the market.
This is an increase in Quantity Supplied.
This is a reaction to the higher price in the market.
The higher price is necessary to induce the greater quantity
supply as expanding output involves increased costs of
production as more resources must be hired.
This process results in the new equilibrium point, e2, at the new
equilibrium price of P2 and new equilibrium quantity of q2.
15
Conclusion
Follow this process as outlined in the Supply and Demand
Guide and as discussed and illustrated in the previous slides.
These steps work for any determinant change for either supply
or demand.
Should a problem involve a change in a determinant of demand
and a determinant of supply, these steps still work and will lead
you to the correct solution.
In such a case, work through each determinant change
individually, then combine the two changes to produce the total
change in the market and the new market equilibrium.
D
Price
Quantity
0
S
P
q
e
P2

More Related Content

Similar to Supply and Demand GuideTo solve the homework problems do the f.docx

OB
OBOB
Elements of Demand and Supply
Elements of Demand and SupplyElements of Demand and Supply
Elements of Demand and Supply
Gregar Donaven Valdehueza
 
Determinants Of Demand
Determinants Of DemandDeterminants Of Demand
Determinants Of DemandVijay A Raj
 
Chapters 4 6
Chapters 4 6Chapters 4 6
Chapters 4 6rhalter
 
Law of Demand and Supply equilibrium supply curve and demand curve (1).pptx
Law of Demand and Supply equilibrium supply curve and demand curve (1).pptxLaw of Demand and Supply equilibrium supply curve and demand curve (1).pptx
Law of Demand and Supply equilibrium supply curve and demand curve (1).pptx
JoshuaAsucro
 
Demand
DemandDemand
Basic of Supply and Demand - Economic
Basic of Supply and Demand - EconomicBasic of Supply and Demand - Economic
Basic of Supply and Demand - Economic
Abdullah Kareem
 
Microeconomics
Microeconomics Microeconomics
Microeconomics
shazia-ijaz
 
Unit 2.pptxhhsjsjsmabhshsjsjsjsjhdhdjsksbh
Unit 2.pptxhhsjsjsmabhshsjsjsjsjhdhdjsksbhUnit 2.pptxhhsjsjsmabhshsjsjsjsjhdhdjsksbh
Unit 2.pptxhhsjsjsmabhshsjsjsjsjhdhdjsksbh
aggarwalhr44
 
Economics 4 & 5 with corrections
Economics 4 & 5 with correctionsEconomics 4 & 5 with corrections
Economics 4 & 5 with correctionsJerri Hernandez
 
Demand
DemandDemand
Demand
UdayDasArko
 
Supply and Demand
Supply and Demand Supply and Demand
Supply and Demand
north819
 
demand.pptx
demand.pptxdemand.pptx
demand.pptx
karunikaruni
 
Ch03 ss,dd and-mkt
Ch03 ss,dd and-mktCh03 ss,dd and-mkt
Ch03 ss,dd and-mkt
shadzx89
 
Unit #2 student notes
Unit #2 student notesUnit #2 student notes
Unit #2 student notesNick Allgyer
 
Supply & demand pe student notes
Supply & demand pe student notesSupply & demand pe student notes
Supply & demand pe student notesNick Allgyer
 
Lecture 43921
Lecture 43921Lecture 43921
Lecture 43921
Maida RaNa
 
Form 3 bst (1) (2).pdf
Form 3 bst (1) (2).pdfForm 3 bst (1) (2).pdf
Form 3 bst (1) (2).pdf
JuliusKimani11
 
Nuning english
Nuning englishNuning english
Nuning english
Dwi Husba
 
3 supply and demand
3 supply and demand3 supply and demand
3 supply and demandsukhwinder22
 

Similar to Supply and Demand GuideTo solve the homework problems do the f.docx (20)

OB
OBOB
OB
 
Elements of Demand and Supply
Elements of Demand and SupplyElements of Demand and Supply
Elements of Demand and Supply
 
Determinants Of Demand
Determinants Of DemandDeterminants Of Demand
Determinants Of Demand
 
Chapters 4 6
Chapters 4 6Chapters 4 6
Chapters 4 6
 
Law of Demand and Supply equilibrium supply curve and demand curve (1).pptx
Law of Demand and Supply equilibrium supply curve and demand curve (1).pptxLaw of Demand and Supply equilibrium supply curve and demand curve (1).pptx
Law of Demand and Supply equilibrium supply curve and demand curve (1).pptx
 
Demand
DemandDemand
Demand
 
Basic of Supply and Demand - Economic
Basic of Supply and Demand - EconomicBasic of Supply and Demand - Economic
Basic of Supply and Demand - Economic
 
Microeconomics
Microeconomics Microeconomics
Microeconomics
 
Unit 2.pptxhhsjsjsmabhshsjsjsjsjhdhdjsksbh
Unit 2.pptxhhsjsjsmabhshsjsjsjsjhdhdjsksbhUnit 2.pptxhhsjsjsmabhshsjsjsjsjhdhdjsksbh
Unit 2.pptxhhsjsjsmabhshsjsjsjsjhdhdjsksbh
 
Economics 4 & 5 with corrections
Economics 4 & 5 with correctionsEconomics 4 & 5 with corrections
Economics 4 & 5 with corrections
 
Demand
DemandDemand
Demand
 
Supply and Demand
Supply and Demand Supply and Demand
Supply and Demand
 
demand.pptx
demand.pptxdemand.pptx
demand.pptx
 
Ch03 ss,dd and-mkt
Ch03 ss,dd and-mktCh03 ss,dd and-mkt
Ch03 ss,dd and-mkt
 
Unit #2 student notes
Unit #2 student notesUnit #2 student notes
Unit #2 student notes
 
Supply & demand pe student notes
Supply & demand pe student notesSupply & demand pe student notes
Supply & demand pe student notes
 
Lecture 43921
Lecture 43921Lecture 43921
Lecture 43921
 
Form 3 bst (1) (2).pdf
Form 3 bst (1) (2).pdfForm 3 bst (1) (2).pdf
Form 3 bst (1) (2).pdf
 
Nuning english
Nuning englishNuning english
Nuning english
 
3 supply and demand
3 supply and demand3 supply and demand
3 supply and demand
 

More from calvins9

Supporting Developmentally Appropriate PracticesSupporting D.docx
Supporting Developmentally Appropriate PracticesSupporting D.docxSupporting Developmentally Appropriate PracticesSupporting D.docx
Supporting Developmentally Appropriate PracticesSupporting D.docx
calvins9
 
Supporting Developmentally Appropriate Practices.For this as.docx
Supporting Developmentally Appropriate Practices.For this as.docxSupporting Developmentally Appropriate Practices.For this as.docx
Supporting Developmentally Appropriate Practices.For this as.docx
calvins9
 
Supporting Developmentally Appropriate PracticesSupporting.docx
Supporting Developmentally Appropriate PracticesSupporting.docxSupporting Developmentally Appropriate PracticesSupporting.docx
Supporting Developmentally Appropriate PracticesSupporting.docx
calvins9
 
Supporting LecturesRefer to the following lectureNut.docx
Supporting LecturesRefer to the following lectureNut.docxSupporting LecturesRefer to the following lectureNut.docx
Supporting LecturesRefer to the following lectureNut.docx
calvins9
 
supporting docu-mentation.In 2005, the more than 70 agencies of .docx
supporting docu-mentation.In 2005, the more than 70 agencies of .docxsupporting docu-mentation.In 2005, the more than 70 agencies of .docx
supporting docu-mentation.In 2005, the more than 70 agencies of .docx
calvins9
 
Support or oppose the statement Young people do too much cell phon.docx
Support or oppose the statement Young people do too much cell phon.docxSupport or oppose the statement Young people do too much cell phon.docx
Support or oppose the statement Young people do too much cell phon.docx
calvins9
 
Support or refute this statement [T]he Declaration functioned .docx
Support or refute this statement [T]he Declaration functioned .docxSupport or refute this statement [T]he Declaration functioned .docx
Support or refute this statement [T]he Declaration functioned .docx
calvins9
 
Support your argument for and against hospice. As well as furthe.docx
Support your argument for and against hospice. As well as furthe.docxSupport your argument for and against hospice. As well as furthe.docx
Support your argument for and against hospice. As well as furthe.docx
calvins9
 
Support for Caregivers of Cancer Patient.docx
Support for Caregivers of Cancer Patient.docxSupport for Caregivers of Cancer Patient.docx
Support for Caregivers of Cancer Patient.docx
calvins9
 
SUPPLEMENTARY LOW SPEED AERODYNAMICS (DEN233) .docx
SUPPLEMENTARY   LOW SPEED AERODYNAMICS (DEN233)  .docxSUPPLEMENTARY   LOW SPEED AERODYNAMICS (DEN233)  .docx
SUPPLEMENTARY LOW SPEED AERODYNAMICS (DEN233) .docx
calvins9
 
Supply Market Analysis for a Competitive Advantage Davi.docx
Supply Market Analysis for a Competitive Advantage  Davi.docxSupply Market Analysis for a Competitive Advantage  Davi.docx
Supply Market Analysis for a Competitive Advantage Davi.docx
calvins9
 
Supply ChainManagementA LOGISTICS PERSPECTIVE9e.docx
Supply ChainManagementA LOGISTICS PERSPECTIVE9e.docxSupply ChainManagementA LOGISTICS PERSPECTIVE9e.docx
Supply ChainManagementA LOGISTICS PERSPECTIVE9e.docx
calvins9
 
Summative Productivity Lab Maxi Widjojo IB S1 ESS Mrs. .docx
Summative Productivity Lab Maxi Widjojo  IB S1 ESS Mrs. .docxSummative Productivity Lab Maxi Widjojo  IB S1 ESS Mrs. .docx
Summative Productivity Lab Maxi Widjojo IB S1 ESS Mrs. .docx
calvins9
 
Summative Discussion BoardReview and reflect on the knowledg.docx
Summative Discussion BoardReview and reflect on the knowledg.docxSummative Discussion BoardReview and reflect on the knowledg.docx
Summative Discussion BoardReview and reflect on the knowledg.docx
calvins9
 
Sun, sea, sand and tsunami examiningdisaster vulnerability .docx
Sun, sea, sand and tsunami examiningdisaster vulnerability .docxSun, sea, sand and tsunami examiningdisaster vulnerability .docx
Sun, sea, sand and tsunami examiningdisaster vulnerability .docx
calvins9
 
Summary 1271 Wordssecond hand smoke55SIMILARITY.docx
Summary 1271 Wordssecond hand smoke55SIMILARITY.docxSummary 1271 Wordssecond hand smoke55SIMILARITY.docx
Summary 1271 Wordssecond hand smoke55SIMILARITY.docx
calvins9
 
Superior Electrical (Superior) was in the business of installing ele.docx
Superior Electrical (Superior) was in the business of installing ele.docxSuperior Electrical (Superior) was in the business of installing ele.docx
Superior Electrical (Superior) was in the business of installing ele.docx
calvins9
 
Superstorm scenario–a so-called Superstorm” is predicted to affe.docx
Superstorm scenario–a so-called Superstorm” is predicted to affe.docxSuperstorm scenario–a so-called Superstorm” is predicted to affe.docx
Superstorm scenario–a so-called Superstorm” is predicted to affe.docx
calvins9
 
Supply Chain ManagementSTRATEGY, PLANNING, AND OPERATION.docx
Supply Chain ManagementSTRATEGY, PLANNING, AND OPERATION.docxSupply Chain ManagementSTRATEGY, PLANNING, AND OPERATION.docx
Supply Chain ManagementSTRATEGY, PLANNING, AND OPERATION.docx
calvins9
 
Summary Summary post  includes what was learned from discussion,.docx
Summary Summary post  includes what was learned from discussion,.docxSummary Summary post  includes what was learned from discussion,.docx
Summary Summary post  includes what was learned from discussion,.docx
calvins9
 

More from calvins9 (20)

Supporting Developmentally Appropriate PracticesSupporting D.docx
Supporting Developmentally Appropriate PracticesSupporting D.docxSupporting Developmentally Appropriate PracticesSupporting D.docx
Supporting Developmentally Appropriate PracticesSupporting D.docx
 
Supporting Developmentally Appropriate Practices.For this as.docx
Supporting Developmentally Appropriate Practices.For this as.docxSupporting Developmentally Appropriate Practices.For this as.docx
Supporting Developmentally Appropriate Practices.For this as.docx
 
Supporting Developmentally Appropriate PracticesSupporting.docx
Supporting Developmentally Appropriate PracticesSupporting.docxSupporting Developmentally Appropriate PracticesSupporting.docx
Supporting Developmentally Appropriate PracticesSupporting.docx
 
Supporting LecturesRefer to the following lectureNut.docx
Supporting LecturesRefer to the following lectureNut.docxSupporting LecturesRefer to the following lectureNut.docx
Supporting LecturesRefer to the following lectureNut.docx
 
supporting docu-mentation.In 2005, the more than 70 agencies of .docx
supporting docu-mentation.In 2005, the more than 70 agencies of .docxsupporting docu-mentation.In 2005, the more than 70 agencies of .docx
supporting docu-mentation.In 2005, the more than 70 agencies of .docx
 
Support or oppose the statement Young people do too much cell phon.docx
Support or oppose the statement Young people do too much cell phon.docxSupport or oppose the statement Young people do too much cell phon.docx
Support or oppose the statement Young people do too much cell phon.docx
 
Support or refute this statement [T]he Declaration functioned .docx
Support or refute this statement [T]he Declaration functioned .docxSupport or refute this statement [T]he Declaration functioned .docx
Support or refute this statement [T]he Declaration functioned .docx
 
Support your argument for and against hospice. As well as furthe.docx
Support your argument for and against hospice. As well as furthe.docxSupport your argument for and against hospice. As well as furthe.docx
Support your argument for and against hospice. As well as furthe.docx
 
Support for Caregivers of Cancer Patient.docx
Support for Caregivers of Cancer Patient.docxSupport for Caregivers of Cancer Patient.docx
Support for Caregivers of Cancer Patient.docx
 
SUPPLEMENTARY LOW SPEED AERODYNAMICS (DEN233) .docx
SUPPLEMENTARY   LOW SPEED AERODYNAMICS (DEN233)  .docxSUPPLEMENTARY   LOW SPEED AERODYNAMICS (DEN233)  .docx
SUPPLEMENTARY LOW SPEED AERODYNAMICS (DEN233) .docx
 
Supply Market Analysis for a Competitive Advantage Davi.docx
Supply Market Analysis for a Competitive Advantage  Davi.docxSupply Market Analysis for a Competitive Advantage  Davi.docx
Supply Market Analysis for a Competitive Advantage Davi.docx
 
Supply ChainManagementA LOGISTICS PERSPECTIVE9e.docx
Supply ChainManagementA LOGISTICS PERSPECTIVE9e.docxSupply ChainManagementA LOGISTICS PERSPECTIVE9e.docx
Supply ChainManagementA LOGISTICS PERSPECTIVE9e.docx
 
Summative Productivity Lab Maxi Widjojo IB S1 ESS Mrs. .docx
Summative Productivity Lab Maxi Widjojo  IB S1 ESS Mrs. .docxSummative Productivity Lab Maxi Widjojo  IB S1 ESS Mrs. .docx
Summative Productivity Lab Maxi Widjojo IB S1 ESS Mrs. .docx
 
Summative Discussion BoardReview and reflect on the knowledg.docx
Summative Discussion BoardReview and reflect on the knowledg.docxSummative Discussion BoardReview and reflect on the knowledg.docx
Summative Discussion BoardReview and reflect on the knowledg.docx
 
Sun, sea, sand and tsunami examiningdisaster vulnerability .docx
Sun, sea, sand and tsunami examiningdisaster vulnerability .docxSun, sea, sand and tsunami examiningdisaster vulnerability .docx
Sun, sea, sand and tsunami examiningdisaster vulnerability .docx
 
Summary 1271 Wordssecond hand smoke55SIMILARITY.docx
Summary 1271 Wordssecond hand smoke55SIMILARITY.docxSummary 1271 Wordssecond hand smoke55SIMILARITY.docx
Summary 1271 Wordssecond hand smoke55SIMILARITY.docx
 
Superior Electrical (Superior) was in the business of installing ele.docx
Superior Electrical (Superior) was in the business of installing ele.docxSuperior Electrical (Superior) was in the business of installing ele.docx
Superior Electrical (Superior) was in the business of installing ele.docx
 
Superstorm scenario–a so-called Superstorm” is predicted to affe.docx
Superstorm scenario–a so-called Superstorm” is predicted to affe.docxSuperstorm scenario–a so-called Superstorm” is predicted to affe.docx
Superstorm scenario–a so-called Superstorm” is predicted to affe.docx
 
Supply Chain ManagementSTRATEGY, PLANNING, AND OPERATION.docx
Supply Chain ManagementSTRATEGY, PLANNING, AND OPERATION.docxSupply Chain ManagementSTRATEGY, PLANNING, AND OPERATION.docx
Supply Chain ManagementSTRATEGY, PLANNING, AND OPERATION.docx
 
Summary Summary post  includes what was learned from discussion,.docx
Summary Summary post  includes what was learned from discussion,.docxSummary Summary post  includes what was learned from discussion,.docx
Summary Summary post  includes what was learned from discussion,.docx
 

Recently uploaded

Operation Blue Star - Saka Neela Tara
Operation Blue Star   -  Saka Neela TaraOperation Blue Star   -  Saka Neela Tara
Operation Blue Star - Saka Neela Tara
Balvir Singh
 
Model Attribute Check Company Auto Property
Model Attribute  Check Company Auto PropertyModel Attribute  Check Company Auto Property
Model Attribute Check Company Auto Property
Celine George
 
Mule 4.6 & Java 17 Upgrade | MuleSoft Mysore Meetup #46
Mule 4.6 & Java 17 Upgrade | MuleSoft Mysore Meetup #46Mule 4.6 & Java 17 Upgrade | MuleSoft Mysore Meetup #46
Mule 4.6 & Java 17 Upgrade | MuleSoft Mysore Meetup #46
MysoreMuleSoftMeetup
 
aaaaaaaaaaaaaaaaaaaaaaaaaaaaaaaaaaaaaaaaa
aaaaaaaaaaaaaaaaaaaaaaaaaaaaaaaaaaaaaaaaaaaaaaaaaaaaaaaaaaaaaaaaaaaaaaaaaaaaaaaaaa
aaaaaaaaaaaaaaaaaaaaaaaaaaaaaaaaaaaaaaaaa
siemaillard
 
Overview on Edible Vaccine: Pros & Cons with Mechanism
Overview on Edible Vaccine: Pros & Cons with MechanismOverview on Edible Vaccine: Pros & Cons with Mechanism
Overview on Edible Vaccine: Pros & Cons with Mechanism
DeeptiGupta154
 
How to Create Map Views in the Odoo 17 ERP
How to Create Map Views in the Odoo 17 ERPHow to Create Map Views in the Odoo 17 ERP
How to Create Map Views in the Odoo 17 ERP
Celine George
 
Basic phrases for greeting and assisting costumers
Basic phrases for greeting and assisting costumersBasic phrases for greeting and assisting costumers
Basic phrases for greeting and assisting costumers
PedroFerreira53928
 
Unit 2- Research Aptitude (UGC NET Paper I).pdf
Unit 2- Research Aptitude (UGC NET Paper I).pdfUnit 2- Research Aptitude (UGC NET Paper I).pdf
Unit 2- Research Aptitude (UGC NET Paper I).pdf
Thiyagu K
 
Sectors of the Indian Economy - Class 10 Study Notes pdf
Sectors of the Indian Economy - Class 10 Study Notes pdfSectors of the Indian Economy - Class 10 Study Notes pdf
Sectors of the Indian Economy - Class 10 Study Notes pdf
Vivekanand Anglo Vedic Academy
 
The geography of Taylor Swift - some ideas
The geography of Taylor Swift - some ideasThe geography of Taylor Swift - some ideas
The geography of Taylor Swift - some ideas
GeoBlogs
 
How to Split Bills in the Odoo 17 POS Module
How to Split Bills in the Odoo 17 POS ModuleHow to Split Bills in the Odoo 17 POS Module
How to Split Bills in the Odoo 17 POS Module
Celine George
 
Supporting (UKRI) OA monographs at Salford.pptx
Supporting (UKRI) OA monographs at Salford.pptxSupporting (UKRI) OA monographs at Salford.pptx
Supporting (UKRI) OA monographs at Salford.pptx
Jisc
 
Home assignment II on Spectroscopy 2024 Answers.pdf
Home assignment II on Spectroscopy 2024 Answers.pdfHome assignment II on Spectroscopy 2024 Answers.pdf
Home assignment II on Spectroscopy 2024 Answers.pdf
Tamralipta Mahavidyalaya
 
The French Revolution Class 9 Study Material pdf free download
The French Revolution Class 9 Study Material pdf free downloadThe French Revolution Class 9 Study Material pdf free download
The French Revolution Class 9 Study Material pdf free download
Vivekanand Anglo Vedic Academy
 
Palestine last event orientationfvgnh .pptx
Palestine last event orientationfvgnh .pptxPalestine last event orientationfvgnh .pptx
Palestine last event orientationfvgnh .pptx
RaedMohamed3
 
GIÁO ÁN DẠY THÊM (KẾ HOẠCH BÀI BUỔI 2) - TIẾNG ANH 8 GLOBAL SUCCESS (2 CỘT) N...
GIÁO ÁN DẠY THÊM (KẾ HOẠCH BÀI BUỔI 2) - TIẾNG ANH 8 GLOBAL SUCCESS (2 CỘT) N...GIÁO ÁN DẠY THÊM (KẾ HOẠCH BÀI BUỔI 2) - TIẾNG ANH 8 GLOBAL SUCCESS (2 CỘT) N...
GIÁO ÁN DẠY THÊM (KẾ HOẠCH BÀI BUỔI 2) - TIẾNG ANH 8 GLOBAL SUCCESS (2 CỘT) N...
Nguyen Thanh Tu Collection
 
Instructions for Submissions thorugh G- Classroom.pptx
Instructions for Submissions thorugh G- Classroom.pptxInstructions for Submissions thorugh G- Classroom.pptx
Instructions for Submissions thorugh G- Classroom.pptx
Jheel Barad
 
ESC Beyond Borders _From EU to You_ InfoPack general.pdf
ESC Beyond Borders _From EU to You_ InfoPack general.pdfESC Beyond Borders _From EU to You_ InfoPack general.pdf
ESC Beyond Borders _From EU to You_ InfoPack general.pdf
Fundacja Rozwoju Społeczeństwa Przedsiębiorczego
 
The Challenger.pdf DNHS Official Publication
The Challenger.pdf DNHS Official PublicationThe Challenger.pdf DNHS Official Publication
The Challenger.pdf DNHS Official Publication
Delapenabediema
 
2024.06.01 Introducing a competency framework for languag learning materials ...
2024.06.01 Introducing a competency framework for languag learning materials ...2024.06.01 Introducing a competency framework for languag learning materials ...
2024.06.01 Introducing a competency framework for languag learning materials ...
Sandy Millin
 

Recently uploaded (20)

Operation Blue Star - Saka Neela Tara
Operation Blue Star   -  Saka Neela TaraOperation Blue Star   -  Saka Neela Tara
Operation Blue Star - Saka Neela Tara
 
Model Attribute Check Company Auto Property
Model Attribute  Check Company Auto PropertyModel Attribute  Check Company Auto Property
Model Attribute Check Company Auto Property
 
Mule 4.6 & Java 17 Upgrade | MuleSoft Mysore Meetup #46
Mule 4.6 & Java 17 Upgrade | MuleSoft Mysore Meetup #46Mule 4.6 & Java 17 Upgrade | MuleSoft Mysore Meetup #46
Mule 4.6 & Java 17 Upgrade | MuleSoft Mysore Meetup #46
 
aaaaaaaaaaaaaaaaaaaaaaaaaaaaaaaaaaaaaaaaa
aaaaaaaaaaaaaaaaaaaaaaaaaaaaaaaaaaaaaaaaaaaaaaaaaaaaaaaaaaaaaaaaaaaaaaaaaaaaaaaaaa
aaaaaaaaaaaaaaaaaaaaaaaaaaaaaaaaaaaaaaaaa
 
Overview on Edible Vaccine: Pros & Cons with Mechanism
Overview on Edible Vaccine: Pros & Cons with MechanismOverview on Edible Vaccine: Pros & Cons with Mechanism
Overview on Edible Vaccine: Pros & Cons with Mechanism
 
How to Create Map Views in the Odoo 17 ERP
How to Create Map Views in the Odoo 17 ERPHow to Create Map Views in the Odoo 17 ERP
How to Create Map Views in the Odoo 17 ERP
 
Basic phrases for greeting and assisting costumers
Basic phrases for greeting and assisting costumersBasic phrases for greeting and assisting costumers
Basic phrases for greeting and assisting costumers
 
Unit 2- Research Aptitude (UGC NET Paper I).pdf
Unit 2- Research Aptitude (UGC NET Paper I).pdfUnit 2- Research Aptitude (UGC NET Paper I).pdf
Unit 2- Research Aptitude (UGC NET Paper I).pdf
 
Sectors of the Indian Economy - Class 10 Study Notes pdf
Sectors of the Indian Economy - Class 10 Study Notes pdfSectors of the Indian Economy - Class 10 Study Notes pdf
Sectors of the Indian Economy - Class 10 Study Notes pdf
 
The geography of Taylor Swift - some ideas
The geography of Taylor Swift - some ideasThe geography of Taylor Swift - some ideas
The geography of Taylor Swift - some ideas
 
How to Split Bills in the Odoo 17 POS Module
How to Split Bills in the Odoo 17 POS ModuleHow to Split Bills in the Odoo 17 POS Module
How to Split Bills in the Odoo 17 POS Module
 
Supporting (UKRI) OA monographs at Salford.pptx
Supporting (UKRI) OA monographs at Salford.pptxSupporting (UKRI) OA monographs at Salford.pptx
Supporting (UKRI) OA monographs at Salford.pptx
 
Home assignment II on Spectroscopy 2024 Answers.pdf
Home assignment II on Spectroscopy 2024 Answers.pdfHome assignment II on Spectroscopy 2024 Answers.pdf
Home assignment II on Spectroscopy 2024 Answers.pdf
 
The French Revolution Class 9 Study Material pdf free download
The French Revolution Class 9 Study Material pdf free downloadThe French Revolution Class 9 Study Material pdf free download
The French Revolution Class 9 Study Material pdf free download
 
Palestine last event orientationfvgnh .pptx
Palestine last event orientationfvgnh .pptxPalestine last event orientationfvgnh .pptx
Palestine last event orientationfvgnh .pptx
 
GIÁO ÁN DẠY THÊM (KẾ HOẠCH BÀI BUỔI 2) - TIẾNG ANH 8 GLOBAL SUCCESS (2 CỘT) N...
GIÁO ÁN DẠY THÊM (KẾ HOẠCH BÀI BUỔI 2) - TIẾNG ANH 8 GLOBAL SUCCESS (2 CỘT) N...GIÁO ÁN DẠY THÊM (KẾ HOẠCH BÀI BUỔI 2) - TIẾNG ANH 8 GLOBAL SUCCESS (2 CỘT) N...
GIÁO ÁN DẠY THÊM (KẾ HOẠCH BÀI BUỔI 2) - TIẾNG ANH 8 GLOBAL SUCCESS (2 CỘT) N...
 
Instructions for Submissions thorugh G- Classroom.pptx
Instructions for Submissions thorugh G- Classroom.pptxInstructions for Submissions thorugh G- Classroom.pptx
Instructions for Submissions thorugh G- Classroom.pptx
 
ESC Beyond Borders _From EU to You_ InfoPack general.pdf
ESC Beyond Borders _From EU to You_ InfoPack general.pdfESC Beyond Borders _From EU to You_ InfoPack general.pdf
ESC Beyond Borders _From EU to You_ InfoPack general.pdf
 
The Challenger.pdf DNHS Official Publication
The Challenger.pdf DNHS Official PublicationThe Challenger.pdf DNHS Official Publication
The Challenger.pdf DNHS Official Publication
 
2024.06.01 Introducing a competency framework for languag learning materials ...
2024.06.01 Introducing a competency framework for languag learning materials ...2024.06.01 Introducing a competency framework for languag learning materials ...
2024.06.01 Introducing a competency framework for languag learning materials ...
 

Supply and Demand GuideTo solve the homework problems do the f.docx

  • 1. Supply and Demand Guide To solve the homework problems do the following: 1. Identify the determinant change 2. Shift the appropriate curve in the correct direction 3. Change price appropriately 4. Move along the other curve (the one that did not shift) in response to the price change. The following information will tell you the determinants and how the change, as well as definitions of the key terms. Demand Demand: The amount that consumers are willing and able to purchase at various prices. Law of Demand: Price and Quantity Demanded vary inversely. Quantity Demanded: The amount that consumers are willing and able to buy at a particular price. Change in Quantity Demanded: Changes in price change the quantity demanded. This is a Movement Along a Demand Curve in Response to a Price Change. Change in Demand: This is a shift in the position of the demand curve, either upward or downward. If the curve shifts upward, consumers are saying they will pay more for all quantities of the good or service. If it shifts downward,
  • 2. consumers are saying they will pay less for all quantities of the good or service. Determinants of Demand: The Demand Curve will shift only when one (or more) of the Determinants of Demand changes. These determinants are: 1. Size of Market: the number of consumers in the market for the good or service. If this factor increases, the curve shifts upward (increase in demand). If this decreases, the curve shifts downward (decrease in demand). 2. Consumer Tastes and Preferences: if these shift in favor of a product, the demand curve shifts upward (demand increases); if these shift against a product, the demand curve shifts downward (demand decreases). 3. Consumer Income: as the income of consumers increase, consumers purchase more of all normal goods (assume all the goods in the homework are normal goods), this shifts the demand curve upward (demand increases); if income decreases, then consumers buy less of all normal goods, this shifts the demand curve downward (demand decreases). 4. Prices of Related Goods: a. Complimentary Goods: These are goods that are used to together like peanut butter and jelly. If the price of peanut butter goes up, the Quantity Demanded of peanut butter will decrease (a movement along a demand curve in response to a price change). However, the Demand for jelly will decline (decrease in demand) as fewer people buy it to go with the peanut butter, since they are buying less peanut butter. b. Substitute Goods: These are goods that are used in place of each other. If the price of Coke Cola goes up, the Quantity
  • 3. Demanded of Coke does down (a movement along the demand curve). But the Demand for Pepsi – the substitute good – goes up as people substitute the lower priced Pepsi for the higher priced Coke (the Pepsi demand curve shifts upward). 5. Expectations about the Future: If people have a positive view of the future they will consumer more and save less. This shifts the demand curve for all normal goods upward. If people have a negative view of the future, they will consume less and save more, this shifts the demand curve for all normal goods downward. Supply Supply: The amount that producers are willing and able to bring to market at various prices. Law of Supply: Price and Quantity Supplied vary directly. Quantity Supplied: The amount that producers are willing and able to bring to market at a particular price. Change in Quantity Supply: Changes in price change the quantity supplied. This is a Movement Along a Supply Curve in Response to a Price Change. Change in Supply: This is a shift in the position of the supply curve, either upward (inward) or downward (outward). If the curve shifts upward, producers are saying they will bring less to market at all prices. If it shifts downward, producers are saying they will bring more to market at all prices. Determinants of Supply: The Supply Curve will shift only when one (or more) of the Determinants of Supply changes. These determinants are:
  • 4. 1. Number of Firms in the Industry: If the number of firms in an industry increases, the more the industry can produce – this shifts the supply curve downward (outward) – this is an increase in supply. If the number of firms in an industry decreases, the industry can produce less output – this shifts the supply curve upward (inward) – this is a reduction in supply. 2. Relative Price of Alternative Outputs: If a firm can produce Product A or Product B with the same resources (inputs), it will produce the product with the higher price. If the price of Product A increases relative to Product B, then the firm will produce more of A and less of B. This causes the Supply Curve for A to shift outward (increase in supply) and the Supply Curve for B to shift upward (decrease in supply). 3. Costs of Production*: The costs of production is the primary determinant of supply. If the costs of production increase, then supply decreases – the Supply Curve shifts inward (a decrease in supply). If the costs of production decrease, then supply increases – the Supply Curve shifts outward (an increase in supply). 4. Expectations About the Future: If firms have a positive view of the future, they will increase production which is an increase in supply – the curve shifts outward. If firms have a negative view about the future, they will decrease production and the supply curve will shift upward – a decrease in supply. * The Costs of Production include: · Prices of inputs – the Factors of Production · Business Taxes · Complying with regulations
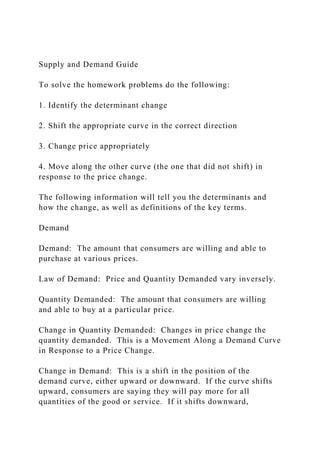
  • 5. · Less any Subsidies the firm may receive In equilibrium, the quantity supplied equals the quantity demanded. Graph A When one or more of the determinants of demand (see above) change such that the demand for a good increases, that shows that consumers are willing to pay more for all possible quantities of the good. The upward shift in the demand curve causes an increase in price. Suppliers respond to the higher market price by bringing a greater quantity supplied to market – recall the Law of Supply. SHAPE Graph B When one or more of the determinants of demand (see above) change such that the demand for that good decreases. The demand curve reflects this by shifting downward, showing the consumers are willing to pay less for all possible quantities of the good. This causes a decrease in price. Suppliers respond to the price change by bringing a lesser quantity supplied to market - recall the Law of Supply. SHAPE Graph C
  • 6. When one or more of the determinants of supply (see above) change such that the supply for that good increases, the supply curve shifts outward showing that suppliers can bring more product to market at lower prices for all possible quantities. This causes a decrease in price. Demanders will respond to the price change with a greater quantity demanded – recall the Law of Demand. SHAPE Graph D When one or more of the determinants of supply (see above) change such that the supply for that good decreases, the supply curve shifts inward showing the suppliers can bring fewer products to market at higher prices for all possible quantities. This causes an increase in price, and demanders are willing to buy a lesser quantity demanded – recall the Law of Demand. SHAPE Q P P*
  • 10. Q* S D S’ To be used with the supply and demand guide Supply and Demand Graphs
  • 11. 1 Review of x and Y axis A graph consists of two axes called the x (horizontal/quantity) and y (vertical/price) axes. The point where the two axes intersect is called the origin. The origin is also identified as the point (0, 0). X axis Moving right from the origin of (0,0), the numbers ascend. Moving left from the origin, the numbers descend. Y axis Moving up from the origin of (0,0), the numbers ascend. Moving down from the origin, the numbers descend. In this course, we will mainly be using the upper right quadrant of the graphic area. In economics it is the norm to show the independent variable on the y-axis and the dependent variable on the x-axis.
  • 12. 2 The Demand Curve Demand Curve - A downward sloping curve that measures the relationship between the price of a good and the quantity demanded by consumers. Demand - The amount that consumers are willing and able to purchase at various prices. Change in Demand – A shift in the position of the demand curve that occurs in response to a change in one or more of the determinants of demand (non-price induced change). Law of Demand – All other factors equal, the higher the price of the good or service, the lower the quantity demanded (price induced change). And the lower the price, the higher the quantity demanded. Price and Quantity Demanded vary inversely. Change in Quantity Demanded – A change in the quantity consumers are willing and able to purchase. It is a response to a change in the market price.
  • 13. 3 Why does the demand curve shift? The Determinants of demand Shifts in the curve (change in demand) result from changes in one or more of the non-price determinants of demand: Number of Consumers in the market (Size of Market) Consumer Tastes and Preferences Consumer Income Prices of Related Goods (Substitute Goods and Complimentary Goods) Expectations about the Future 4 The Demand Curve: Increases In Demand
  • 14. Increase in Demand Curve shifts to the right as a result of an increase in demand by the consumers (D1 to D2). This is caused by a change in one or more of the determinants of demand. This causes Price to increase (P1 to P2). This shows a willingness to pay a higher price for all possible quantities of the good. Suppliers respond to the higher price by increasing Quantity Supplied (q1 to q2) . This process results in a new Equilibrium at e2 with Equilibrium Price P2 and Equilibrium Quantity q2. 5 The Demand Curve: Decreases In Demand Decrease in Demand Demand curve shifts to the left as a result of a decrease in demand by the consumers (D1 to D2). This is caused by a change in one or more of the determinants of demand. This causes Price to decrease (P1 to P2). This shows a
  • 15. decreased willingness to pay for all possible quantities of the good. Suppliers respond to the lower price by decreasing Quantity Supplied (q1 to q2) . This results in a new Equilibrium at e2 with Equilibrium Price P2 and Equilibrium Quantity q2. 6 Supply Curve Supply Curve - A curve that normally slopes upward (to the right) representing the quantity of a product producers are willing and able to bring to market at various prices. Supply – The amount that producers are willing and able to bring to market at various prices. Change in Supply – A shift in the position of the supply curve in response to a change in one or more of the determinants of supply (non-price induced change). Law of Supply – All other factors equal, the higher the price of a good or service, the greater the quantity supplied to the
  • 16. market (price induced change). And the lower the price, the lower the quantity supplied. Price and Quantity Supplied vary directly. Change in Quantity Supplied – A change in the quantity producers are willing and able to bring to market. It is a response to a change in the market price. 7 Why does the supply curve shift? The determinants of supply Shifts in the curve can be attributed to changes in one or more of the non-price determinants of supply: Costs of Production: Input prices (prices of the Factors of Production - resources) Taxes Regulatory compliance costs Legal Expenses Transactions Costs Number of Firms in the Industry (productive capacity) Relative Prices of Alternative Outputs Technology (sometimes this is grouped with costs of production as technology determines the methods of production available to
  • 17. the firm) Expectations about the Future 8 The Supply Curve: Increases In Supply Increase in Supply Supply curve shifts to the right as a result of increased supply in the market. (S1 to S2). This is caused by a change in one or more of the determinants of supply. This causes Equilibrium Price to decrease (P1 to P2). In response to the lower price, Quantity Demanded increases (q1 to q2). This produces a new Equilibrium e2 at Equilibrium Price P2 and Equilibrium Quantity q2.
  • 18. 9 The Supply Curve: Decreases In Supply Decrease in Supply Supply curve shifts to the left as a result of decreased supply in the market. (S1 to S2). This is caused by a change in one or more of the determinants of supply. This causes Equilibrium Price to increase (P1 to P2). In response to the higher price, Quantity Demanded decreases (q1 to q2). This produces a new Equilibrium at e2 and Equilibrium Price P2 and Equilibrium Quantity q2. 10 Steps to solve supply and demand problems Use the following steps – in the order provided – to solve
  • 19. supply and demand problems. Remember that changes occur for a reason and it is important to follow that chain of causation in all economic analysis. The Steps: Identify the determinant change indicated in the problem; Shift the curve whose determinant has changed; Shift it in the direction indicated by the determinant change; Change the market price in line with the curve shift; Move along the other curve in response to the price change (change in quantity demanded or quantity supplied as appropriate); Find the new market equilibrium price and quantity. 11 An example: The Fresh Fruit Market Start with the Fresh Fruit market in equilibrium as shown in the graph. At equilibrium point e, the amount that consumers wish to buy at price P is exactly equal to the amount that producers wish to sell at price P. The quantity demanded is equal to the quantity supplied at the market price of P (quantity demanded = quantity supplied).
  • 20. The market clears – there is no shortage and no surplus. Then consumers decide to eat healthier foods, including more fresh fruit. The determinant that changes is Consumer Tastes and Preferences. 12 An example: The Fresh Fruit Market – Step 2 Since consumers have now decided to consumer (buy) more fresh fruit, the demand curve shifts to the right. This shift graphically shows that consumers want more fresh fruit. AND that they are willing and able to pay more for all quantities of fresh fruit. This change is shown in the graph as the shift of the demand curve from D1 to D2.
  • 21. 13 An example: The Fresh Fruit Market – Step 3 In response to the higher demand, the market price increases (P1 to P2). This, again, shows that consumers are willing and able to pay more of the larger quantities of fresh fruit that they now want to buy. The new price is shown as P2 in the graph of the Fresh Fruit Market. 14 An example:
  • 22. The Fresh Fruit Market – Step 4 In response to the new higher price, producers will move along their supply curve from P1 at e1 to P2 at e2 and bring a higher quantity of fresh fruit to the market. This is an increase in Quantity Supplied. This is a reaction to the higher price in the market. The higher price is necessary to induce the greater quantity supply as expanding output involves increased costs of production as more resources must be hired. This process results in the new equilibrium point, e2, at the new equilibrium price of P2 and new equilibrium quantity of q2. 15 Conclusion Follow this process as outlined in the Supply and Demand Guide and as discussed and illustrated in the previous slides. These steps work for any determinant change for either supply or demand. Should a problem involve a change in a determinant of demand and a determinant of supply, these steps still work and will lead you to the correct solution. In such a case, work through each determinant change individually, then combine the two changes to produce the total
  • 23. change in the market and the new market equilibrium. D Price Quantity 0 S P q
  • 24. e P2