Need, Want, andDemand!
▪Need?
▪ Necessity! Food and Shelter.
▪Want?
▪ Would like to have! Luxury Car.
▪Demand?
▪ Wants backed by purchasing power.
3.
Demand
▪Individual Demand: Thequantity demanded of a good by an individual consumer at different
prices, ceteris paribus.
▪Market demand: The sum of all the individual demand for a particular good.
▪Demand Curve?
▪ It traces the quantities of a/the good(s) being demanded by a/all the consumer(s) in an economy at
different prices, all other things being unchanged.
4.
Demand Curve
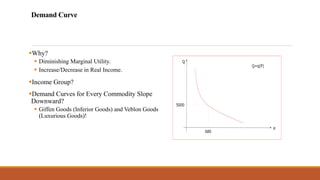
▪Why?
▪ DiminishingMarginal Utility.
▪ Increase/Decrease in Real Income.
▪Income Group?
▪Demand Curves for Every Commodity Slope
Downward?
▪ Giffen Goods (Inferior Goods) and Veblon Goods
(Luxurious Goods)!
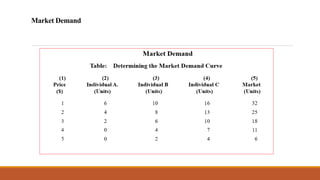
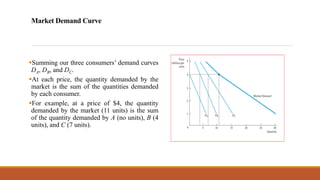
Market Demand Curve
▪Summingour three consumers’ demand curves
DA, DB, and DC.
▪At each price, the quantity demanded by the
market is the sum of the quantities demanded
by each consumer.
▪For example, at a price of $4, the quantity
demanded by the market (11 units) is the sum
of the quantity demanded by A (no units), B (4
units), and C (7 units).
7.
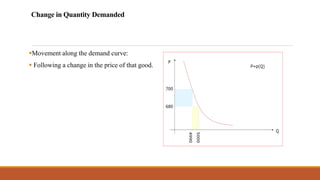
Change in QuantityDemanded
▪Movement along the demand curve:
▪ Following a change in the price of that good.
8.
Change in Demand
▪Shiftof the Demand Curve:
▪ Following a change in any factor
influencing the demand other than price
of that good.
Demand Shifters/Change inIncome
▪Demand for a good rises if income of consumers rises.
▪Is it for all goods?
▪Normal vs Inferior Goods!
11.
Demand Shifters/Change inPrices of Related Goods
▪Shift in the Demand Curve of Another Goods?
▪Substitute vs Complement Goods!
▪Demand for a good rises if price of its substitutes rises.
▪Demand for a good rises if price of its complements falls.
12.
Demand Shifters/Change inConsumers’Tastes
▪A change in consumers’ taste in the favor of a good will lead to a rise in the demand for that
good.
▪How?
▪ Informative Advertising and Persuasive Advertising!
13.
Demand Shifters/Change inConsumers’Expectations
▪Consumers’ Expectations about Future Market Expectations?
▪ Increase vs Decrease in price!
14.
Demand Shifters/Population
▪With arising population, there are more people to buy a good, and this will increase the demand
for that good.
▪ Composition of the population will also influence demand.
▪ Demand Curve Food Products over 20th Century.
15.
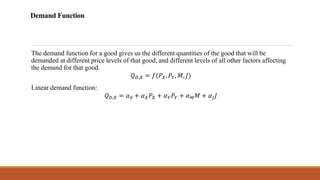
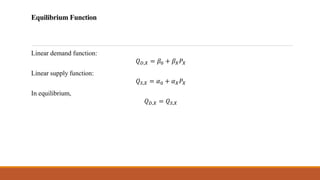
Demand Function
The demandfunction for a good gives us the different quantities of the good that will be
demanded at different price levels of that good, and different levels of all other factors affecting
the demand for that good.
𝑄𝐷,𝑋 = 𝑓(𝑃𝑋, 𝑃𝑌, 𝑀, 𝐽)
Linear demand function:
𝑄𝐷,𝑋 = 𝛼0 + 𝛼𝑋𝑃𝑋 + 𝛼𝑌𝑃𝑌 + 𝛼𝑀𝑀 + 𝛼𝐽𝐽
16.
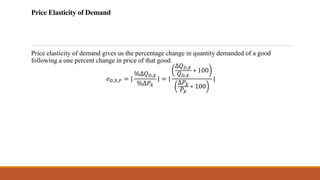
Price Elasticity ofDemand
Price elasticity of demand gives us the percentage change in quantity demanded of a good
following a one percent change in price of that good.
𝑒𝐷,𝑋,𝑃 = |
%∆𝑄𝐷,𝑋
%∆𝑃𝑋
| = |
∆𝑄𝐷,𝑋
𝑄𝐷,𝑋
∗ 100
∆𝑃𝑋
𝑃𝑋
∗ 100
|
17.
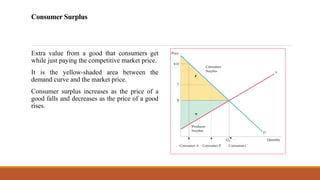
Consumer Surplus
Extra valuefrom a good that consumers get
while just paying the competitive market price.
It is the yellow-shaded area between the
demand curve and the market price.
Consumer surplus increases as the price of a
good falls and decreases as the price of a good
rises.
18.
Supply
▪Willingness of sellersto offer a given quantity of a good or service for a given price.
▪Production vs Supply!
▪Commodities available in the market or flow of production?
▪Similar? Any Difference?
19.
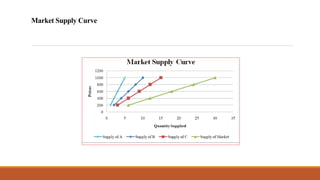
Market Supply
▪Individual firmlevel supply: Quantity supplied of a good by an individual producer at different
prices, ceteris paribus.
▪Market supply: The sum of all the individual firm level’s supply for a good.
▪Supply Curve: It traces the quantities of a good being supplied by all the producers in an
economy at different prices, ceteris paribus.
20.
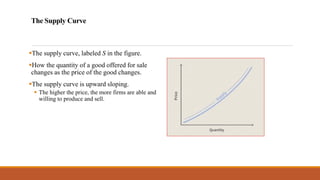
The Supply Curve
▪Thesupply curve, labeled S in the figure.
▪How the quantity of a good offered for sale
changes as the price of the good changes.
▪The supply curve is upward sloping.
▪ The higher the price, the more firms are able and
willing to produce and sell.
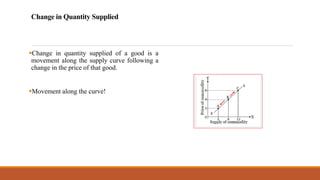
Change in QuantitySupplied
▪Change in quantity supplied of a good is a
movement along the supply curve following a
change in the price of that good.
▪Movement along the curve!
24.
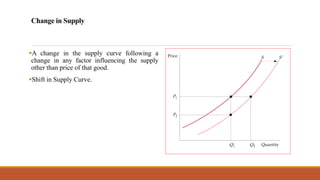
Change in Supply
▪Achange in the supply curve following a
change in any factor influencing the supply
other than price of that good.
▪Shift in Supply Curve.
25.
Factors: Shift inthe Supply Curve
▪Input Prices
▪Technology
▪Producers’ expectations
▪Number of firms
▪Climate change/ natural calamity
▪Government regulation and taxes
▪Substitutes in production
26.
Shift in theSupply Curve/Input Prices
▪Supply for a good falls if the price of an input rises.
▪Leads to shift of supply curve to the left.
27.
Shift in theSupply Curve/Change in Technology
▪Supply of a good rises if there is a technological breakthrough in the production process of the
good.
▪Shift of Supply Curve to the Right.
28.
Shift in theSupply Curve/Change in Producers’Expectations
▪A change in producers’ expectations of future price!
▪ A price hike in future?
▪Perishable and Durable Goods?
29.
Shift in theSupply Curve/Change in Number of Firms
▪No. of firms producing a good.
▪Entry vs Exit?
30.
Shift in theSupply Curve/Change in Climate or Natural Calamity
▪With unfavorable changes in climate, supply of a good will fall.
▪If production capacity is negatively affected due to natural calamities/pandemics, supply of a
good will fall.
▪Any Example?
▪Covid-19.
31.
Shift in theSupply Curve/Change in the Government Regulation and Taxes
▪If there are unfavorable changes in government regulations, then the supply of good will fall.
▪ If there is a rise in taxes imposed by the government, then the supply of a good will fall.
▪Example: Judge Orders California Sriracha Factory to Halt Odor-Making Operations .
32.
Shift in theSupply Curve/Change in the Demand for Substitutes in Production
▪If there is a rise in the demand for goods that can also be produced using the productive capacities
for a particular good, then the supply of that good will fall.
▪Adaptable Technologies.
▪Converting a truck assembly plant to a car assembly plant!
33.
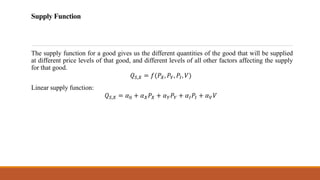
Supply Function
The supplyfunction for a good gives us the different quantities of the good that will be supplied
at different price levels of that good, and different levels of all other factors affecting the supply
for that good.
𝑄𝑆,𝑋 = 𝑓(𝑃𝑋, 𝑃𝑌, 𝑃𝐼, 𝑉)
Linear supply function:
𝑄𝑆,𝑋 = 𝛼0 + 𝛼𝑋𝑃𝑋 + 𝛼𝑌𝑃𝑌 + 𝛼𝐼𝑃𝐼 + 𝛼𝑉𝑉
34.
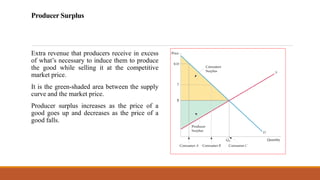
Producer Surplus
Extra revenuethat producers receive in excess
of what’s necessary to induce them to produce
the good while selling it at the competitive
market price.
It is the green-shaded area between the supply
curve and the market price.
Producer surplus increases as the price of a
good goes up and decreases as the price of a
good falls.
35.
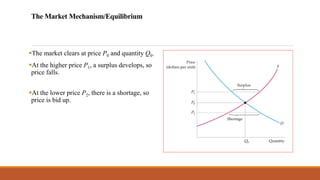
The Market Mechanism/Equilibrium
▪Themarket clears at price P0 and quantity Q0.
▪At the higher price P1, a surplus develops, so
price falls.
▪At the lower price P2, there is a shortage, so
price is bid up.
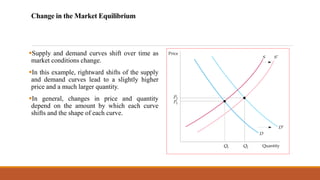
Change in theMarket Equilibrium
▪Supply and demand curves shift over time as
market conditions change.
▪In this example, rightward shifts of the supply
and demand curves lead to a slightly higher
price and a much larger quantity.
▪In general, changes in price and quantity
depend on the amount by which each curve
shifts and the shape of each curve.
38.
Equilibrium with PriceCeilings
Government mandated maximum price that can
be legally charged for a good.
39.
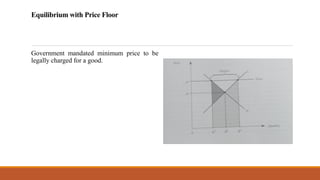
Equilibrium with PriceFloor
Government mandated minimum price to be
legally charged for a good.