Download as PDF, PPTX


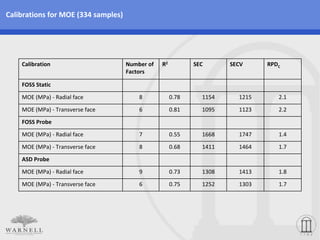


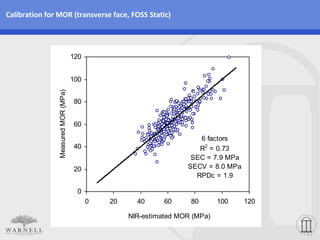


This document describes a study that used near infrared (NIR) spectroscopy to develop calibrations to estimate wood properties (density, modulus of elasticity (MOE), and modulus of rupture (MOR)) of multiple pine species. Samples from 8 pine species growing in Brazil were collected and tested for wood properties. NIR spectra were collected on the radial and transverse faces. Calibrations using NIR spectra provided reasonably strong estimations of density, MOE, and MOR across all pine species. Transverse face spectra produced slightly better calibrations than radial face spectra. The lab-based FOSS static spectrometer produced the strongest calibrations overall.


