Downloaded 13 times


![2. Experimental Procedure: Materials inspected and tested
The Carbon Fiber Reinforced Polymer (CFRP) was manufactured using Hexcel
8552/32%/134/IM7(12K) at the INTA Materials and Structures Department.
-The 8552/32%/134/IM7(12K) pre-impregnated carbon fiber
plies consisted of tows of 12,000 individual fibers of IM7
intermediate modulus carbon.
-The pre-preg contained 32% of 8552, an amine cured,
Fig. 8. CFRP samples. toughened epoxy resin system.
-The nominal ply thickness was 134µm.
-Measured ply thickness was 129µm to 134µm.
Table 1. Stacking sequences and percentages of layers oriented 90º, 0º or ±45º.
% % % % #
Specimens Stacking sequence
90º 0º 45º -45º layers
[(0/±45/02/±45/02/90) /
CFRP-P011 8.8 54.4 18.4 18.4 283
( 02/±45/02/±45/02/ )12]S
90
[(0/90) /
CFRP-P021 9.5 54.7 17.9 17.9 201
( 02/±45/02/±45/0290)9]S
/
Fig. 9. Smooth, rough, and [(0/90/0/±45/02/90) /
machined surfaces of CFRP CFRP-P041 11.9 54.2 16.9 16.9 59
( 02/±45/02/±45/0290)2]S
/
samples.
5/20](https://image.slidesharecdn.com/presentationiccm18vggarcaetalv4-110919044304-phpapp01/85/Ultrasonics-inspections-and-confocal-microscopy-to-evaluate-fatigue-damage-in-fiber-reinforced-polymer-composites-V-G-Garcia-5-320.jpg)


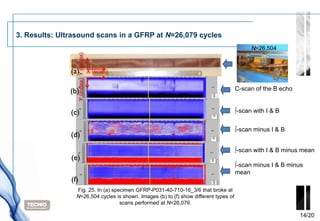
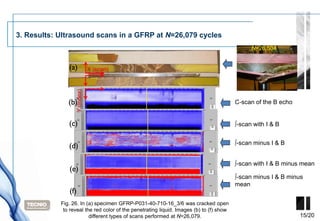

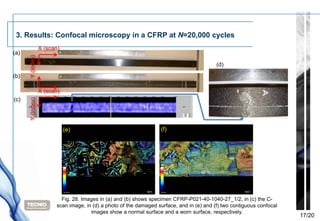

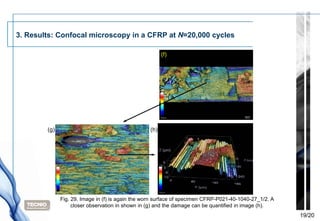


The document describes experiments using ultrasonic inspections and confocal microscopy to evaluate fatigue damage in fiber reinforced polymer composites. Glass fiber reinforced phenolic and carbon fiber reinforced epoxy composites were tested using 4-point bending fatigue tests. Ultrasound equipment and visualization software were used to scan the composites at various cycle intervals to identify damage development. Confocal microscopy was also used to examine fatigue damage in samples tested to 20,000-26,000 cycles. The results were intended to characterize fatigue behavior and damage progression in the composites.


