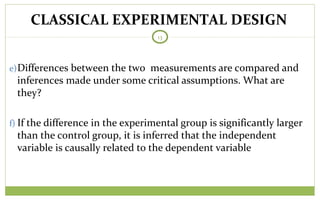
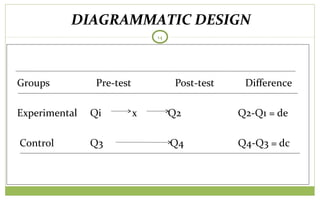
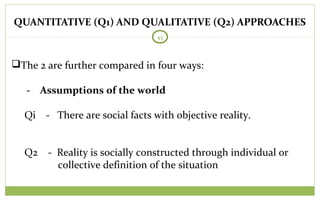
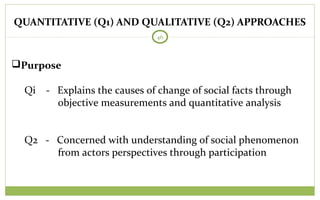
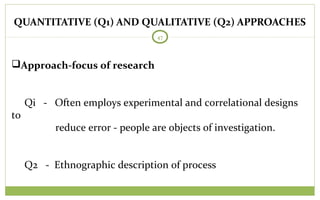
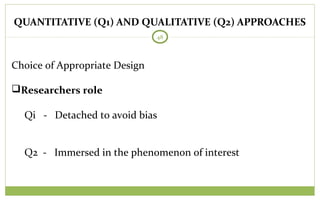
LECTURE THREE
Michael Poku-Boansi, Ph.D.
September, 2012
RESEARCH DESIGN
FRAMEWORKS
TODAY
2
 Research designs are concerned with turning the research
question into a testing/testable project.
 Any research design deals with at least four (4) problems:
INTRODUCTION
TODAY
3
- What questions to study;
- What data are relevant;
- What data should you collect; and
- How to analyze the results.
INTRODUCTION
TODAY
4
 Every research design has its positive and negative sides.
 Research design can be divided into fixed and flexible designs
or in other instances, they are referred to as “Quantitative” and
‘Qualitative” research designs.
INTRODUCTION
TODAY
5
 Fixed designs do not need to be quantitative and flexible
design need not be qualitative.
 In fixed designs the design of the study is fixed before the main
stage of data collection takes place.
INTRODUCTION
TODAY
6
 Fixed designs are normally theory driven; otherwise it is
impossible to know in advance which variables need to be
controlled and measured (often these variables are
quantitative).
 Flexible designs allow for more freedom during data collection.
One reason for using the type of design is that the variable of
interest is not quantitatively measurable (e.g. culture, decision
making process, plan approval process, Case Studies etc)
INTRODUCTION
TODAY
7
 In other cases, theory might not be available before one starts
the research.
 So you can see that there are several classifications and models
of research design but we will deal with the following three
classical ones:
INTRODUCTION
TODAY
8
- Quantitative – Qualitative Design;
- Classical Experimental Design; and
- Cross – Sectional Design
INTRODUCTION
TODAY
9
Introduction
 There are several classifications and models but will deal with
three that are mostly used in planning:
- Classical Experimental Design;
- Cross-Section Design; and
- Quantitative - Qualitative Design.
TYPICAL RESEARCH DESIGNS IN PLANNING
TODAY
10
Key Elements
a)Two comparable groups or situations: experimental and control
groups
b)The experiment group is exposed to an independent variable
(treatment or change agent); control group is not.
CLASSICAL EXPERIMENTAL DESIGN
TODAY
11
c) Cases are randomly selected in both experimental and control
groups
d) Effect of the independent variable on the dependent variable is
measured on 2 occasions.
CLASSICAL EXPERIMENTAL DESIGN
TODAY
12
a) Pre-test - before introduction of change
agent/intervention
b) Post-test - after introduction or injection of
change/intervention .
CLASSICAL EXPERIMENTAL DESIGN
TODAY
13
e)Differences between the two measurements are compared and
inferences made under some critical assumptions. What are
they?
f) If the difference in the experimental group is significantly larger
than the control group, it is inferred that the independent
variable is causally related to the dependent variable
CLASSICAL EXPERIMENTAL DESIGN
TODAY
14
Groups Pre-test Post-test Difference
Experimental Qi x Q2 Q2-Q1 = de
Control Q3 Q4 Q4-Q3 = dc
DIAGRAMMATIC DESIGN
TODAY
15
Why Experimental Designs?
Experiments are more associated with natural sciences -
physical and biological/natural sciences.
Why experimental designs in Social Sciences?
TODAY
16
Two (2) reasons:
a)Helps us to understand the logic of all research designs, the
model against which we can evaluate other designs.
b)Allows the investigator to draw causal inferences, and
establish whether or not the independent variables caused
changes in the dependent variable.
TODAY
17
Experimental design is used less frequently by social scientists
primarily because of its rigid structure which often cannot
easily be adapted to the social sciences
KEY COMPONENTS OF EXPERIMENTAL DESIGN
18
a) Comparison – Normal
- Necessary to establish that two variables are correlated or
causally related.
- E.g. compare behaviour of two groups of youth who smoke
and those who do not or socio economic conditions along a
rehabilitated road corridor and a deteriorated road corridor.
- Both internal (time-wise) and external comparison.
KEY COMPONENTS OF EXPERIMENTAL DESIGN
19
b) Manipulation
- Helps to establish time-order of events
- Manipulate X and Y is disturbed or also changed.
- Can then say that change in Y is caused by change in X
KEY COMPONENTS OF EXPERIMENTAL DESIGN
20
b) Manipulation
- E.g. if drug abuse among the youth causes indiscipline,
then
it follows that the use of drugs precedes the expression of
indecent behaviour.
- It is important to note that change occurs after the
activation or injection of independent variable.
KEY COMPONENTS OF EXPERIMENTAL DESIGN
21
c) Control - Internal Validity
- Third criterion of causality requires that rival explanations
are ruled out.
- Enables us to determine that the observed variation is non-
spurious.
- Non-spurious relation is a relationship between two (2)
variables that cannot be explained by a third variable.
KEY COMPONENTS OF EXPERIMENTAL DESIGN
22
- So control means → the operation that enables the
researcher to rule out other factors as rival explanations of
the observed association between variables.
→ this issue of internal validity
- To establish internal validity, the researcher must answer
the question that the independent variable caused the
changes in dependent variable.
KEY COMPONENTS OF EXPERIMENTAL DESIGN
23
- Factors that may affect Internal Validity are:
a) Extrinsic factors - those occurring prior to the research
operation; and
b) Intrinsic factors - affect the results during the study
period.
KEY COMPONENTS OF EXPERIMENTAL DESIGN
24
d) Generalisation: External Validity.
- The extent to which the research findings can be
generalised to larger populations and applied to different
social and political settings.
KEY COMPONENTS OF EXPERIMENTAL DESIGN
25
- Two (2) conditions must be satisfied
a) Representativeness of the sample
b) Minimisation of reactive elements - reducing artificial
disturbances in the natural setting.
KEY COMPONENTS OF EXPERIMENTAL DESIGN
26
Related research approach
a)Explanatory research - desire to establish causality - e.g.
epidemiology - causes of morbidity; infant mortality.
b) Impact Studies:
- Establishing the degree of change resulting from the
injection of change variable
KEY COMPONENTS OF EXPERIMENTAL DESIGN
27
- Trying to establish the explanatory variables ‘with’ and
‘without’ and ‘Before’ and ‘After’
E.g. Agric experiments, Micro-finance, community
participation
CROSS - SECTIONAL DESIGNS (CSD)
28
Introduction
a)The most predominant design used in social sciences.
- Often identified with survey research - a method of data
collection and analysis common in social science studies.
- Research mostly aimed at describing the pattern of
relations before any attempt at casual inference is
made
CROSS - SECTIONAL DESIGNS (CSD)
29
b) Comparison with Experimental Design.
E.g. The effect of gender/literacy/alcoholism on communal
violence.
- Researcher cannot
a) Manipulate the independent variable
b) Cannot incorporate control (time element of change is
not possible)
CROSS - SECTIONAL DESIGNS (CSD)
30
c)To overcome methodological limitations associated with CSDs,
the researcher uses statistical analysis to approximate some of the
operations that are in-built in Experimental design.
- Statistical analysis is used to show the interrelationship
- Using statistics to organise describe, and summarise
observations.
CROSS - SECTIONAL DESIGNS (CSD)
31
→ E.g. Cross-tabulation or bivariate percentage analysis (20%
women, 40% men are involved in communal violence).
- Though this statistical analysis will give us the behaviour of
men and women, we cannot:
a) Establish causality between the variables
b) We cannot explain why?
CROSS - SECTIONAL DESIGNS (CSD)
32
- When Cross - Sectional Designs (CSD) are used, explanatory
factors are statistically controlled unlike experimental
design.
- In Cross - Sectional Designs (CSD), multivariate methods of
statistical analysis are used as alternatives to experimental
methods of control and drawing of inferences e.g.
elaboration by cross-tabulation, multiple regression etc
CROSS - SECTIONAL DESIGNS (CSD)
33
Main advantage:
a)can be carried out in natural settings and permit researchers to
employ random probability samples.
b) This allows statistical inferences to broader populations and
permits generalisation of findings to real life situations and
thereby increasing external validity.
CROSS - SECTIONAL DESIGNS (CSD)
34
 Disadvantage:
- Lack of adequate control over rival explanations - internal
validity.
 Related Research Approaches
Panel (Longitudinal) Research
- A vigorous solutions to the time dilemma or problem in
cross-sectional studies
CROSS - SECTIONAL DESIGNS (CSD)
35
Designed to collect time series data from the same sample -
collect data before injection of the change agent and then after
E.g. yearly E.g. snapshot and Video - A snapshot is like single
case study whiles a Panel Study is like a video
CROSS - SECTIONAL DESIGNS (CSD)
36
Advantages
a)A good way of studying trends - behaviour, population etc
b) Measures changes with high degree precision
- Better than changing samples
CROSS - SECTIONAL DESIGNS (CSD)
37
Problems
a)The likelihood of flagging commitment of respondents
- Affects representativeness of sample
b) Panel conditioning
- Respondents giving a given set of answers to please
researcher.
CROSS - SECTIONAL DESIGNS (CSD)
38
Example: Case Study
Definition:
- It’s an empirical enquiry that allows the researcher to
investigate and understand the dynamics of a particular
system
CROSS - SECTIONAL DESIGNS (CSD)
39
- It has 3 attributes:
a) Investigates a contemporary phenomenon within its
real-
life context.
b) When the boundaries between phenomenon and
context are not clearly evident.
c) Multiple sources of evidence are used.
CROSS - SECTIONAL DESIGNS (CSD)
40
Case Study is preferred when:
a) “how” and “why” questions are being asked.
b) the researcher has little control over events
c) the focus is on contemporary phenomenon within a
real life context.
CROSS - SECTIONAL DESIGNS (CSD)
41
Relevant to Planning:
- It enables the researcher to learn from practice in
order to inform the theory on which that practice is based.
CROSS - SECTIONAL DESIGNS (CSD)
42
Choice of Appropriate Design
- Selection of appropriate research design or strategy
depends
on 6 conditions:
a) The type of research question.
b) The control an investigator has over actual behavioural
events
CROSS - SECTIONAL DESIGNS (CSD)
43
c) The focus on contemporary as opposed to historical
phenomena
d) Purpose of research
e) Time available
f) Type of data involved.
QUANTITATIVE (Q1) AND QUALITATIVE (Q2) APPROACHES
44
General Definitional Difference
Qi - Behaviour can be explained by objective facts
Q2 - There are multiple realities that are socially defined.
QUANTITATIVE (Q1) AND QUALITATIVE (Q2) APPROACHES
45
The 2 are further compared in four ways:
- Assumptions of the world
Qi - There are social facts with objective reality.
Q2 - Reality is socially constructed through individual or
collective definition of the situation
QUANTITATIVE (Q1) AND QUALITATIVE (Q2) APPROACHES
46
Purpose
Qi - Explains the causes of change of social facts through
objective measurements and quantitative analysis
Q2 - Concerned with understanding of social phenomenon
from actors perspectives through participation
QUANTITATIVE (Q1) AND QUALITATIVE (Q2) APPROACHES
47
Approach-focus of research
Qi - Often employs experimental and correlational designs
to
reduce error - people are objects of investigation.
Q2 - Ethnographic description of process
QUANTITATIVE (Q1) AND QUALITATIVE (Q2) APPROACHES
48
Choice of Appropriate Design
Researchers role
Qi - Detached to avoid bias
Q2 - Immersed in the phenomenon of interest
PRACTICAL LEVEL
49
Practical level
i. Nature of variables
Qi - Quantifiable e.g. income, output etc
Q2 - Perceptional variables reflecting attitudes, preferences
and priorities.
PRACTICAL LEVEL
50
ii. Interviews format
Qi - Structured, formal, pre-designed questionnaire
Q2 - Open-end, semi-structured, interactive
PRACTICAL LEVEL
51
iii. Sampling
Qi - Probability Sampling
Q2 - Purposive Sampling
MEASUREMENTS
52
Introduction
The concept of ISOMORPHISM: concerns how measurement
instruments relate to the reality being measured. The
researcher is always confronted with the need to:
a) Search for an already developed measure and reported in
literature;
MEASUREMENTS
53
b)Develop a new or original measure to convert empirical
observations in relation to the research problem; and
C) Provide evidence that the measures used are valid and
reliable.
MEASUREMENTS
54
Nature of Measurement
Definition: “measurement is a procedure in which a researcher
assigns numerals - numbers or other symbols - to empirical
properties (or variables) according to rules”
Example: Job applicant develops a rating system to help him to
select the most appropriate job offer
MEASUREMENTS
55
 Nature of Measurement
→ Scale: 1, 2, 3, 4
Criteria: Job satisfaction, Salary, Location Jobs obtained:
Teaching, NGO, public service.
MEASUREMENTS
56
 Basic concepts in Measurements
The basic concepts used in defining measurement include
Numerals, Assignments and Rules.
a) Numerals
- A numeral has no quantitative meaning unless you give it
such a meaning e.g. I, II, III.
MEASUREMENTS
57
- It can be used to identify phenomena, objects or persons
and thus can be used to designate months, books, streets,
etc.
- Numerals that are given quantitative meaning become
numbers that the researchers can use to explain, describe
and predict phenomenon.
MEASUREMENTS
58
b)Assignment - in definition of measurement, it means
“mapping”. Numerals or numbers are mapped onto objects or
events:
MEASUREMENTS
59
MEASUREMENTS
60
c)Rules - It specifies the procedure a researcher used to assign
numerals or numbers to objects or events.
E.g. Assign numerals 1 to 5 to a level of impact or satisfaction
with a Job.
MEASUREMENTS
61
→ Rules are the most significant component of the
measurement procedure because they determine the
quality of measurement.
→ Poor rules make measurements meaningless.
→ Measurement is assignment of numerals or numbers to
objects, events or variables according to rules.
MEASUREMENTS
62
Levels of Measurement
- Scientist distinguish between different ways of measuring:
Levels or scale of measurement
- 4 levels or scales or “Measurements”
MEASUREMENTS
63
a)Nominal Scale
- It is the lowest and simplest level.
- Numbers or other symbols are used to classify objects or
observations into a number of categories.
- These numbers only constitute a nominal or classificatory
scale.
MEASUREMENTS
64
- E.g. - classification of population into sex (1,2), religions
(1, 2, 3), ethnicity (1, 2, 3, 5, 5), level of education.
- Mathematically, the basic property of the nominal scale is
that the properties of objects in one category are designated
as identical for all its cases.
.
MEASUREMENTS
65
b) Ordinal scale
- Unlike nominal, it brings in the question of relationship
between variables (order).
E.g. higher, greater, lower etc.
- It allows for ranking of variables in either ascending or
descending. E.g. Highly Favourable, Favourable, Not
Favourable, etc.
.
MEASUREMENTS
66
c) Interval Scale
- Apart from being able to rank a set of observations, it also
gives the exact distance between each of the observations
and
the distance is constant.
- It is characterised by a common and constant unit of
measurement that assigns real numbers to all (pairs of) the
objects in the ordered set.
MEASUREMENTS
67
- Income, exams results, weight, output, population size, age,
mileage etc.
MEASUREMENTS
68
d) Ratio Scale
- Variables that have natural Zero-point can be measured on a
ratio scale. E.g. freezing point of water
- Examples are weight, time and length.
Interval scale - the difference of amount measured is applied
to an arbitrary point → whereas with Ratio, it is applied to
an
obsolete zero-point
MEASUREMENTS
69
- General Principle: Properties that can be measured at higher
level can also be measured at lower levels but not vice versa.
- E.g. - If a variable can be measured at Ratio level, it can also
be measured at nominal level.
MEASUREMENTS
70
Measurement Error
Errors are associated with measurements
- Definition: differences in measurement scores that are due
to
anything other than real differences.
MEASUREMENTS
71
Reasons
1.The score obtained maybe influenced by an associated
attribute, an attribute the researcher did not intend to
measure. E.g. unfairness in judgement about an event - football
2. Differences in temporal situation - e.g. health, mood of the
person.
MEASUREMENTS
72
Reasons
3.Differences in the settings in which the measure is used e.g. –
age, probability, gender.
4. Difference in the administration of the measuring instrument –
e.g. poor lighting, tiredness of interviewer etc.
MEASUREMENTS
73
Reasons
5.Difference in processing - wrong or inconsistent coding of
responses
6.When different people interpret the measuring instrument
differently.
MEASUREMENTS
74
Validity
- This is concerned with: “Am I measuring what 1 intend to
measure?”.
MEASUREMENTS
75
- This comes about because many measurements in the Social
Science are indirect. Under this situation, researchers are
never fully certain that they are measuring the variable for
which they designed their measurement operation. E.g. does
voter turnover really measure democracy? Community
preference - various types
e.g. content relevance to characteristics
Empirical: Prediction of results and same
Construct etc: Relation to thematic framework
MEASUREMENTS
76
Reliability
Reliability is a central concern to the social Scientist because the
instruments used are rarely valid - i.e. problem free.
It refers to the extent to which a measuring instrument contains
variable errors - that is errors that appear inconsistent from
observation to observation during any one measurement attempt
or that vary each time measurement is taken.
MEASUREMENTS
77
E.g. if you use a ruler to measure 2 points in time and there is a
difference, then the ruler contains a variable error.
 Errors are common because the variables in Social Science are
indirect or qualitative. - e.g. momentary distraction,
ambiguous construction etc.
MEASUREMENTS
78
 Each measurement consists of two Parts: true or error
components
Reliability: the ratio of the true-score variance to the total
variable in the score as measured.
TYPES OF SCALE
79
1.Rating
According to Gyedu et al (1999), the rating scale is a device
used in evaluating products, attitude or other characteristics
of
variables. Mugenda and Mugenda (1999) also define it as a
scale
used to measure perception, attitude, values and behaviour.
TYPES OF SCALE
80
Con’t
Rating scales are type of scales that consists of numbers and
descriptions which are use to rate or rank the subjectivity and
intangible components in research. Rating scales are limited by
characteristics of human memory, sensitivity and accuracy of
observation. Essentially, there are three types of rating scales,
namely numeral scales, graphic scales and forced choice scale.
TYPES OF SCALE
81
i Numeral Rating Scale
This method measure characteristic by assigning numbers to
the specific rating categories. For example rating a teacher’s
performance along a scale of 1 to 10. It is very easy to construct
and the length of the scale or number of points along the scale is
an arbitrary decision.
TYPES OF SCALE
82
Con’t
A disadvantage of this scale is that, individual respondents
have different frame for referencing which may affect rater
reliability or consistency, that is, a rating of seven of an
object by a person may be equal to a rating of five by another
person on the same scale.
TYPES OF SCALE
83
ii Graphic Rating Scale
Is similar to numerical scale except that the scale itself
contains words rather than numbers. It has an objective and a
straight line with rating categories positioned along the line.
TYPES OF SCALE
84
iii Forced Choice Rating Scale
It is a scale that presents the respondents with a series of
choices and requires him to choose one over the others. It is
much more complex to develop and score than the numerical
and graphical scale. Example can be as follows:
TYPES OF SCALE
85
The teacher is
{ } Always on time for class
{ } Pleasant in class
{ } Very sincere when talking with students
{ } Well read
TYPES OF SCALE
86
This method provides an overall ranking to the factor being
studied without asking the respondents to rank order. This
method has two advantages:
It overcomes the rater’s tendency to leniency because he is
forced to make some kind of judgements; and
The distribution of ratings is much more realistic than some
other rating scale distribution.
TYPES OF SCALE
87
2. Thurstone Scale
Thurstone is one of the first and most productive scaling
theorists. He actually invented three different methods for
scaling a uni-dimensional scale: the method of equal appearing
intervals, the method of successive intervals and the method of
paired comparisons. The three methods differed in how the
scale values for items were constructed, but in all three cases,
the resulting scale was rated the same way by respondents.
TYPES OF SCALE
88
It was used in measuring core attitude when you have multiple dimensions
or concerns around that attitude.
In Thurstone scaling, the researcher would obtain a panel of judges (say
100 of them) and then dream up every conceivable question you can ask
about a phenomenon.
By administering the questionnaire to the panel, the researcher can analyse
inter-item agreement among judges and then even use the discrimination
index to weed out what are called the non-homogenous items.
It is based on the premise that, scaling is all about homogeneity, a term
sometimes used as synonymous with being one-dimensional.
TYPES OF SCALE
89
3. Likert Scale
They were developed in 1932 as the familiar five-point bipolar
response format most people are familiar with today. It is a
rating scale used in measuring the strength of agreement with a
clear statement.
Likert scaling is a one-dimensional scaling which usually ask
people how they agree or disagree, approve or disapprove,
believe to be true or false.
TYPES OF SCALE
90
4. Guttmann’s Scale
It was developed in the 1940s and is a technique of mixing
questions up in the sequence they are asked so that respondents
don’t see that several questions are related.
It is sometime known as cumulative scaling or scalogram
analysis.

research methods

  • 1.
    LECTURE THREE Michael Poku-Boansi,Ph.D. September, 2012 RESEARCH DESIGN FRAMEWORKS
  • 2.
    TODAY 2  Research designsare concerned with turning the research question into a testing/testable project.  Any research design deals with at least four (4) problems: INTRODUCTION
  • 3.
    TODAY 3 - What questionsto study; - What data are relevant; - What data should you collect; and - How to analyze the results. INTRODUCTION
  • 4.
    TODAY 4  Every researchdesign has its positive and negative sides.  Research design can be divided into fixed and flexible designs or in other instances, they are referred to as “Quantitative” and ‘Qualitative” research designs. INTRODUCTION
  • 5.
    TODAY 5  Fixed designsdo not need to be quantitative and flexible design need not be qualitative.  In fixed designs the design of the study is fixed before the main stage of data collection takes place. INTRODUCTION
  • 6.
    TODAY 6  Fixed designsare normally theory driven; otherwise it is impossible to know in advance which variables need to be controlled and measured (often these variables are quantitative).  Flexible designs allow for more freedom during data collection. One reason for using the type of design is that the variable of interest is not quantitatively measurable (e.g. culture, decision making process, plan approval process, Case Studies etc) INTRODUCTION
  • 7.
    TODAY 7  In othercases, theory might not be available before one starts the research.  So you can see that there are several classifications and models of research design but we will deal with the following three classical ones: INTRODUCTION
  • 8.
    TODAY 8 - Quantitative –Qualitative Design; - Classical Experimental Design; and - Cross – Sectional Design INTRODUCTION
  • 9.
    TODAY 9 Introduction  There areseveral classifications and models but will deal with three that are mostly used in planning: - Classical Experimental Design; - Cross-Section Design; and - Quantitative - Qualitative Design. TYPICAL RESEARCH DESIGNS IN PLANNING
  • 10.
    TODAY 10 Key Elements a)Two comparablegroups or situations: experimental and control groups b)The experiment group is exposed to an independent variable (treatment or change agent); control group is not. CLASSICAL EXPERIMENTAL DESIGN
  • 11.
    TODAY 11 c) Cases arerandomly selected in both experimental and control groups d) Effect of the independent variable on the dependent variable is measured on 2 occasions. CLASSICAL EXPERIMENTAL DESIGN
  • 12.
    TODAY 12 a) Pre-test -before introduction of change agent/intervention b) Post-test - after introduction or injection of change/intervention . CLASSICAL EXPERIMENTAL DESIGN
  • 13.
    TODAY 13 e)Differences between thetwo measurements are compared and inferences made under some critical assumptions. What are they? f) If the difference in the experimental group is significantly larger than the control group, it is inferred that the independent variable is causally related to the dependent variable CLASSICAL EXPERIMENTAL DESIGN
  • 14.
    TODAY 14 Groups Pre-test Post-testDifference Experimental Qi x Q2 Q2-Q1 = de Control Q3 Q4 Q4-Q3 = dc DIAGRAMMATIC DESIGN
  • 15.
    TODAY 15 Why Experimental Designs? Experimentsare more associated with natural sciences - physical and biological/natural sciences. Why experimental designs in Social Sciences?
  • 16.
    TODAY 16 Two (2) reasons: a)Helpsus to understand the logic of all research designs, the model against which we can evaluate other designs. b)Allows the investigator to draw causal inferences, and establish whether or not the independent variables caused changes in the dependent variable.
  • 17.
    TODAY 17 Experimental design isused less frequently by social scientists primarily because of its rigid structure which often cannot easily be adapted to the social sciences
  • 18.
    KEY COMPONENTS OFEXPERIMENTAL DESIGN 18 a) Comparison – Normal - Necessary to establish that two variables are correlated or causally related. - E.g. compare behaviour of two groups of youth who smoke and those who do not or socio economic conditions along a rehabilitated road corridor and a deteriorated road corridor. - Both internal (time-wise) and external comparison.
  • 19.
    KEY COMPONENTS OFEXPERIMENTAL DESIGN 19 b) Manipulation - Helps to establish time-order of events - Manipulate X and Y is disturbed or also changed. - Can then say that change in Y is caused by change in X
  • 20.
    KEY COMPONENTS OFEXPERIMENTAL DESIGN 20 b) Manipulation - E.g. if drug abuse among the youth causes indiscipline, then it follows that the use of drugs precedes the expression of indecent behaviour. - It is important to note that change occurs after the activation or injection of independent variable.
  • 21.
    KEY COMPONENTS OFEXPERIMENTAL DESIGN 21 c) Control - Internal Validity - Third criterion of causality requires that rival explanations are ruled out. - Enables us to determine that the observed variation is non- spurious. - Non-spurious relation is a relationship between two (2) variables that cannot be explained by a third variable.
  • 22.
    KEY COMPONENTS OFEXPERIMENTAL DESIGN 22 - So control means → the operation that enables the researcher to rule out other factors as rival explanations of the observed association between variables. → this issue of internal validity - To establish internal validity, the researcher must answer the question that the independent variable caused the changes in dependent variable.
  • 23.
    KEY COMPONENTS OFEXPERIMENTAL DESIGN 23 - Factors that may affect Internal Validity are: a) Extrinsic factors - those occurring prior to the research operation; and b) Intrinsic factors - affect the results during the study period.
  • 24.
    KEY COMPONENTS OFEXPERIMENTAL DESIGN 24 d) Generalisation: External Validity. - The extent to which the research findings can be generalised to larger populations and applied to different social and political settings.
  • 25.
    KEY COMPONENTS OFEXPERIMENTAL DESIGN 25 - Two (2) conditions must be satisfied a) Representativeness of the sample b) Minimisation of reactive elements - reducing artificial disturbances in the natural setting.
  • 26.
    KEY COMPONENTS OFEXPERIMENTAL DESIGN 26 Related research approach a)Explanatory research - desire to establish causality - e.g. epidemiology - causes of morbidity; infant mortality. b) Impact Studies: - Establishing the degree of change resulting from the injection of change variable
  • 27.
    KEY COMPONENTS OFEXPERIMENTAL DESIGN 27 - Trying to establish the explanatory variables ‘with’ and ‘without’ and ‘Before’ and ‘After’ E.g. Agric experiments, Micro-finance, community participation
  • 28.
    CROSS - SECTIONALDESIGNS (CSD) 28 Introduction a)The most predominant design used in social sciences. - Often identified with survey research - a method of data collection and analysis common in social science studies. - Research mostly aimed at describing the pattern of relations before any attempt at casual inference is made
  • 29.
    CROSS - SECTIONALDESIGNS (CSD) 29 b) Comparison with Experimental Design. E.g. The effect of gender/literacy/alcoholism on communal violence. - Researcher cannot a) Manipulate the independent variable b) Cannot incorporate control (time element of change is not possible)
  • 30.
    CROSS - SECTIONALDESIGNS (CSD) 30 c)To overcome methodological limitations associated with CSDs, the researcher uses statistical analysis to approximate some of the operations that are in-built in Experimental design. - Statistical analysis is used to show the interrelationship - Using statistics to organise describe, and summarise observations.
  • 31.
    CROSS - SECTIONALDESIGNS (CSD) 31 → E.g. Cross-tabulation or bivariate percentage analysis (20% women, 40% men are involved in communal violence). - Though this statistical analysis will give us the behaviour of men and women, we cannot: a) Establish causality between the variables b) We cannot explain why?
  • 32.
    CROSS - SECTIONALDESIGNS (CSD) 32 - When Cross - Sectional Designs (CSD) are used, explanatory factors are statistically controlled unlike experimental design. - In Cross - Sectional Designs (CSD), multivariate methods of statistical analysis are used as alternatives to experimental methods of control and drawing of inferences e.g. elaboration by cross-tabulation, multiple regression etc
  • 33.
    CROSS - SECTIONALDESIGNS (CSD) 33 Main advantage: a)can be carried out in natural settings and permit researchers to employ random probability samples. b) This allows statistical inferences to broader populations and permits generalisation of findings to real life situations and thereby increasing external validity.
  • 34.
    CROSS - SECTIONALDESIGNS (CSD) 34  Disadvantage: - Lack of adequate control over rival explanations - internal validity.  Related Research Approaches Panel (Longitudinal) Research - A vigorous solutions to the time dilemma or problem in cross-sectional studies
  • 35.
    CROSS - SECTIONALDESIGNS (CSD) 35 Designed to collect time series data from the same sample - collect data before injection of the change agent and then after E.g. yearly E.g. snapshot and Video - A snapshot is like single case study whiles a Panel Study is like a video
  • 36.
    CROSS - SECTIONALDESIGNS (CSD) 36 Advantages a)A good way of studying trends - behaviour, population etc b) Measures changes with high degree precision - Better than changing samples
  • 37.
    CROSS - SECTIONALDESIGNS (CSD) 37 Problems a)The likelihood of flagging commitment of respondents - Affects representativeness of sample b) Panel conditioning - Respondents giving a given set of answers to please researcher.
  • 38.
    CROSS - SECTIONALDESIGNS (CSD) 38 Example: Case Study Definition: - It’s an empirical enquiry that allows the researcher to investigate and understand the dynamics of a particular system
  • 39.
    CROSS - SECTIONALDESIGNS (CSD) 39 - It has 3 attributes: a) Investigates a contemporary phenomenon within its real- life context. b) When the boundaries between phenomenon and context are not clearly evident. c) Multiple sources of evidence are used.
  • 40.
    CROSS - SECTIONALDESIGNS (CSD) 40 Case Study is preferred when: a) “how” and “why” questions are being asked. b) the researcher has little control over events c) the focus is on contemporary phenomenon within a real life context.
  • 41.
    CROSS - SECTIONALDESIGNS (CSD) 41 Relevant to Planning: - It enables the researcher to learn from practice in order to inform the theory on which that practice is based.
  • 42.
    CROSS - SECTIONALDESIGNS (CSD) 42 Choice of Appropriate Design - Selection of appropriate research design or strategy depends on 6 conditions: a) The type of research question. b) The control an investigator has over actual behavioural events
  • 43.
    CROSS - SECTIONALDESIGNS (CSD) 43 c) The focus on contemporary as opposed to historical phenomena d) Purpose of research e) Time available f) Type of data involved.
  • 44.
    QUANTITATIVE (Q1) ANDQUALITATIVE (Q2) APPROACHES 44 General Definitional Difference Qi - Behaviour can be explained by objective facts Q2 - There are multiple realities that are socially defined.
  • 45.
    QUANTITATIVE (Q1) ANDQUALITATIVE (Q2) APPROACHES 45 The 2 are further compared in four ways: - Assumptions of the world Qi - There are social facts with objective reality. Q2 - Reality is socially constructed through individual or collective definition of the situation
  • 46.
    QUANTITATIVE (Q1) ANDQUALITATIVE (Q2) APPROACHES 46 Purpose Qi - Explains the causes of change of social facts through objective measurements and quantitative analysis Q2 - Concerned with understanding of social phenomenon from actors perspectives through participation
  • 47.
    QUANTITATIVE (Q1) ANDQUALITATIVE (Q2) APPROACHES 47 Approach-focus of research Qi - Often employs experimental and correlational designs to reduce error - people are objects of investigation. Q2 - Ethnographic description of process
  • 48.
    QUANTITATIVE (Q1) ANDQUALITATIVE (Q2) APPROACHES 48 Choice of Appropriate Design Researchers role Qi - Detached to avoid bias Q2 - Immersed in the phenomenon of interest
  • 49.
    PRACTICAL LEVEL 49 Practical level i.Nature of variables Qi - Quantifiable e.g. income, output etc Q2 - Perceptional variables reflecting attitudes, preferences and priorities.
  • 50.
    PRACTICAL LEVEL 50 ii. Interviewsformat Qi - Structured, formal, pre-designed questionnaire Q2 - Open-end, semi-structured, interactive
  • 51.
    PRACTICAL LEVEL 51 iii. Sampling Qi- Probability Sampling Q2 - Purposive Sampling
  • 52.
    MEASUREMENTS 52 Introduction The concept ofISOMORPHISM: concerns how measurement instruments relate to the reality being measured. The researcher is always confronted with the need to: a) Search for an already developed measure and reported in literature;
  • 53.
    MEASUREMENTS 53 b)Develop a newor original measure to convert empirical observations in relation to the research problem; and C) Provide evidence that the measures used are valid and reliable.
  • 54.
    MEASUREMENTS 54 Nature of Measurement Definition:“measurement is a procedure in which a researcher assigns numerals - numbers or other symbols - to empirical properties (or variables) according to rules” Example: Job applicant develops a rating system to help him to select the most appropriate job offer
  • 55.
    MEASUREMENTS 55  Nature ofMeasurement → Scale: 1, 2, 3, 4 Criteria: Job satisfaction, Salary, Location Jobs obtained: Teaching, NGO, public service.
  • 56.
    MEASUREMENTS 56  Basic conceptsin Measurements The basic concepts used in defining measurement include Numerals, Assignments and Rules. a) Numerals - A numeral has no quantitative meaning unless you give it such a meaning e.g. I, II, III.
  • 57.
    MEASUREMENTS 57 - It canbe used to identify phenomena, objects or persons and thus can be used to designate months, books, streets, etc. - Numerals that are given quantitative meaning become numbers that the researchers can use to explain, describe and predict phenomenon.
  • 58.
    MEASUREMENTS 58 b)Assignment - indefinition of measurement, it means “mapping”. Numerals or numbers are mapped onto objects or events:
  • 59.
  • 60.
    MEASUREMENTS 60 c)Rules - Itspecifies the procedure a researcher used to assign numerals or numbers to objects or events. E.g. Assign numerals 1 to 5 to a level of impact or satisfaction with a Job.
  • 61.
    MEASUREMENTS 61 → Rules arethe most significant component of the measurement procedure because they determine the quality of measurement. → Poor rules make measurements meaningless. → Measurement is assignment of numerals or numbers to objects, events or variables according to rules.
  • 62.
    MEASUREMENTS 62 Levels of Measurement -Scientist distinguish between different ways of measuring: Levels or scale of measurement - 4 levels or scales or “Measurements”
  • 63.
    MEASUREMENTS 63 a)Nominal Scale - Itis the lowest and simplest level. - Numbers or other symbols are used to classify objects or observations into a number of categories. - These numbers only constitute a nominal or classificatory scale.
  • 64.
    MEASUREMENTS 64 - E.g. -classification of population into sex (1,2), religions (1, 2, 3), ethnicity (1, 2, 3, 5, 5), level of education. - Mathematically, the basic property of the nominal scale is that the properties of objects in one category are designated as identical for all its cases. .
  • 65.
    MEASUREMENTS 65 b) Ordinal scale -Unlike nominal, it brings in the question of relationship between variables (order). E.g. higher, greater, lower etc. - It allows for ranking of variables in either ascending or descending. E.g. Highly Favourable, Favourable, Not Favourable, etc. .
  • 66.
    MEASUREMENTS 66 c) Interval Scale -Apart from being able to rank a set of observations, it also gives the exact distance between each of the observations and the distance is constant. - It is characterised by a common and constant unit of measurement that assigns real numbers to all (pairs of) the objects in the ordered set.
  • 67.
    MEASUREMENTS 67 - Income, examsresults, weight, output, population size, age, mileage etc.
  • 68.
    MEASUREMENTS 68 d) Ratio Scale -Variables that have natural Zero-point can be measured on a ratio scale. E.g. freezing point of water - Examples are weight, time and length. Interval scale - the difference of amount measured is applied to an arbitrary point → whereas with Ratio, it is applied to an obsolete zero-point
  • 69.
    MEASUREMENTS 69 - General Principle:Properties that can be measured at higher level can also be measured at lower levels but not vice versa. - E.g. - If a variable can be measured at Ratio level, it can also be measured at nominal level.
  • 70.
    MEASUREMENTS 70 Measurement Error Errors areassociated with measurements - Definition: differences in measurement scores that are due to anything other than real differences.
  • 71.
    MEASUREMENTS 71 Reasons 1.The score obtainedmaybe influenced by an associated attribute, an attribute the researcher did not intend to measure. E.g. unfairness in judgement about an event - football 2. Differences in temporal situation - e.g. health, mood of the person.
  • 72.
    MEASUREMENTS 72 Reasons 3.Differences in thesettings in which the measure is used e.g. – age, probability, gender. 4. Difference in the administration of the measuring instrument – e.g. poor lighting, tiredness of interviewer etc.
  • 73.
    MEASUREMENTS 73 Reasons 5.Difference in processing- wrong or inconsistent coding of responses 6.When different people interpret the measuring instrument differently.
  • 74.
    MEASUREMENTS 74 Validity - This isconcerned with: “Am I measuring what 1 intend to measure?”.
  • 75.
    MEASUREMENTS 75 - This comesabout because many measurements in the Social Science are indirect. Under this situation, researchers are never fully certain that they are measuring the variable for which they designed their measurement operation. E.g. does voter turnover really measure democracy? Community preference - various types e.g. content relevance to characteristics Empirical: Prediction of results and same Construct etc: Relation to thematic framework
  • 76.
    MEASUREMENTS 76 Reliability Reliability is acentral concern to the social Scientist because the instruments used are rarely valid - i.e. problem free. It refers to the extent to which a measuring instrument contains variable errors - that is errors that appear inconsistent from observation to observation during any one measurement attempt or that vary each time measurement is taken.
  • 77.
    MEASUREMENTS 77 E.g. if youuse a ruler to measure 2 points in time and there is a difference, then the ruler contains a variable error.  Errors are common because the variables in Social Science are indirect or qualitative. - e.g. momentary distraction, ambiguous construction etc.
  • 78.
    MEASUREMENTS 78  Each measurementconsists of two Parts: true or error components Reliability: the ratio of the true-score variance to the total variable in the score as measured.
  • 79.
    TYPES OF SCALE 79 1.Rating Accordingto Gyedu et al (1999), the rating scale is a device used in evaluating products, attitude or other characteristics of variables. Mugenda and Mugenda (1999) also define it as a scale used to measure perception, attitude, values and behaviour.
  • 80.
    TYPES OF SCALE 80 Con’t Ratingscales are type of scales that consists of numbers and descriptions which are use to rate or rank the subjectivity and intangible components in research. Rating scales are limited by characteristics of human memory, sensitivity and accuracy of observation. Essentially, there are three types of rating scales, namely numeral scales, graphic scales and forced choice scale.
  • 81.
    TYPES OF SCALE 81 iNumeral Rating Scale This method measure characteristic by assigning numbers to the specific rating categories. For example rating a teacher’s performance along a scale of 1 to 10. It is very easy to construct and the length of the scale or number of points along the scale is an arbitrary decision.
  • 82.
    TYPES OF SCALE 82 Con’t Adisadvantage of this scale is that, individual respondents have different frame for referencing which may affect rater reliability or consistency, that is, a rating of seven of an object by a person may be equal to a rating of five by another person on the same scale.
  • 83.
    TYPES OF SCALE 83 iiGraphic Rating Scale Is similar to numerical scale except that the scale itself contains words rather than numbers. It has an objective and a straight line with rating categories positioned along the line.
  • 84.
    TYPES OF SCALE 84 iiiForced Choice Rating Scale It is a scale that presents the respondents with a series of choices and requires him to choose one over the others. It is much more complex to develop and score than the numerical and graphical scale. Example can be as follows:
  • 85.
    TYPES OF SCALE 85 Theteacher is { } Always on time for class { } Pleasant in class { } Very sincere when talking with students { } Well read
  • 86.
    TYPES OF SCALE 86 Thismethod provides an overall ranking to the factor being studied without asking the respondents to rank order. This method has two advantages: It overcomes the rater’s tendency to leniency because he is forced to make some kind of judgements; and The distribution of ratings is much more realistic than some other rating scale distribution.
  • 87.
    TYPES OF SCALE 87 2.Thurstone Scale Thurstone is one of the first and most productive scaling theorists. He actually invented three different methods for scaling a uni-dimensional scale: the method of equal appearing intervals, the method of successive intervals and the method of paired comparisons. The three methods differed in how the scale values for items were constructed, but in all three cases, the resulting scale was rated the same way by respondents.
  • 88.
    TYPES OF SCALE 88 Itwas used in measuring core attitude when you have multiple dimensions or concerns around that attitude. In Thurstone scaling, the researcher would obtain a panel of judges (say 100 of them) and then dream up every conceivable question you can ask about a phenomenon. By administering the questionnaire to the panel, the researcher can analyse inter-item agreement among judges and then even use the discrimination index to weed out what are called the non-homogenous items. It is based on the premise that, scaling is all about homogeneity, a term sometimes used as synonymous with being one-dimensional.
  • 89.
    TYPES OF SCALE 89 3.Likert Scale They were developed in 1932 as the familiar five-point bipolar response format most people are familiar with today. It is a rating scale used in measuring the strength of agreement with a clear statement. Likert scaling is a one-dimensional scaling which usually ask people how they agree or disagree, approve or disapprove, believe to be true or false.
  • 90.
    TYPES OF SCALE 90 4.Guttmann’s Scale It was developed in the 1940s and is a technique of mixing questions up in the sequence they are asked so that respondents don’t see that several questions are related. It is sometime known as cumulative scaling or scalogram analysis.