Download as PDF, PPTX


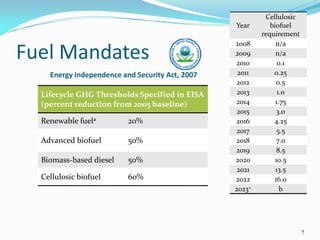
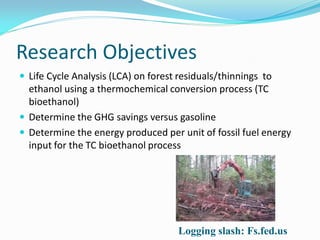

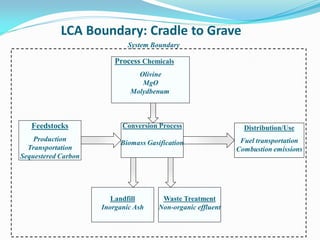
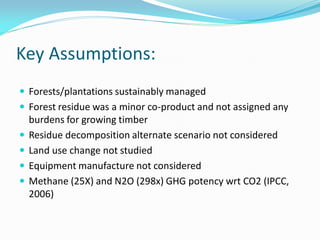
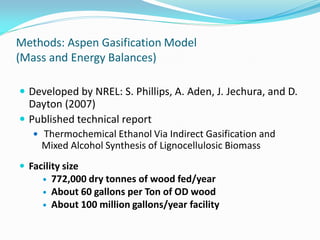

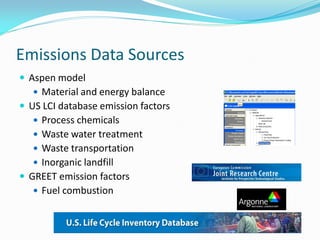

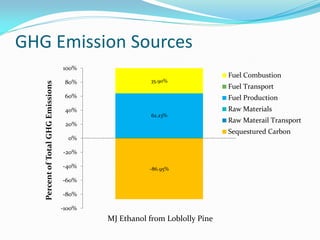
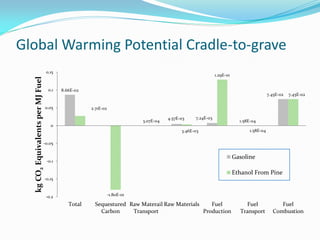
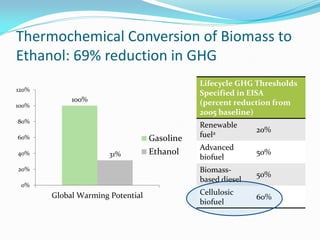
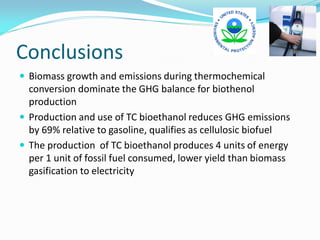


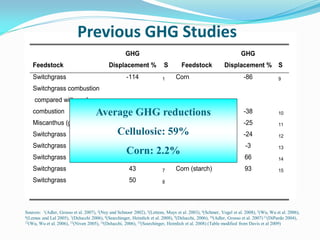
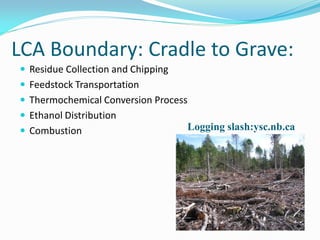

This document summarizes a presentation on research into producing ethanol from loblolly pine forest residuals via thermochemical conversion. The research aims to determine if the process can meet the 60% greenhouse gas reduction requirement in the Energy Independence and Security Act. The life cycle assessment examines the process from feedstock production and transportation through conversion, distribution and use. Key findings include ethanol production resulting in a 86.95% reduction in greenhouse gases compared to gasoline, mainly due to carbon sequestration in the sustainably managed forests.


