Download to read offline
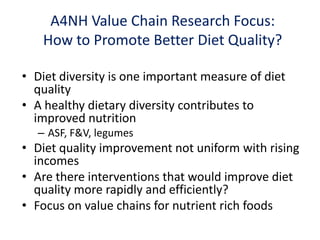
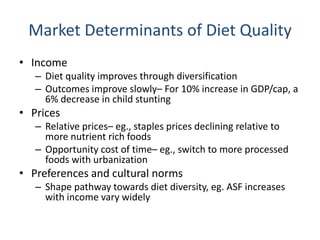
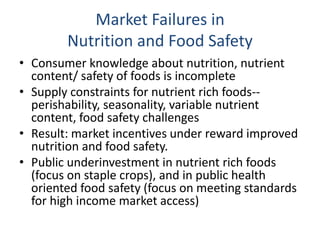
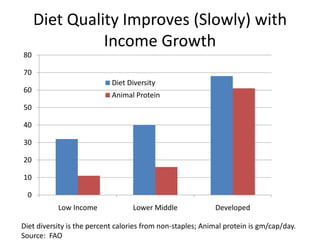
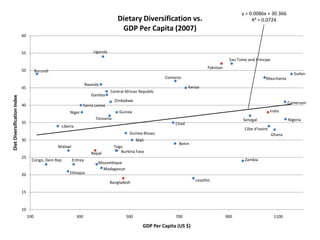
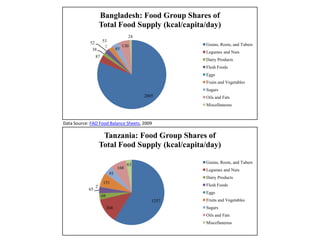

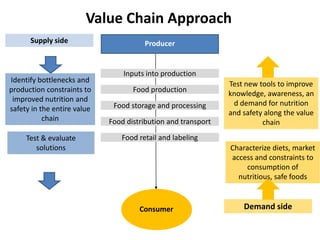
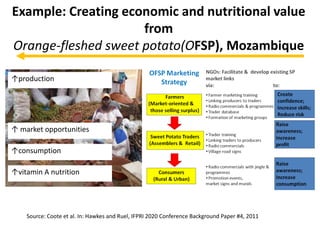
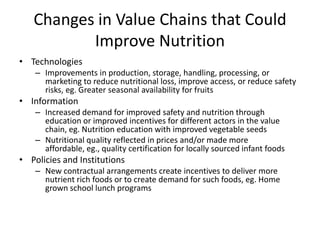
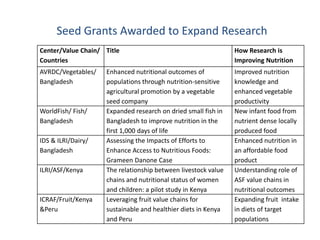
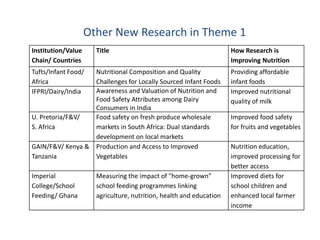
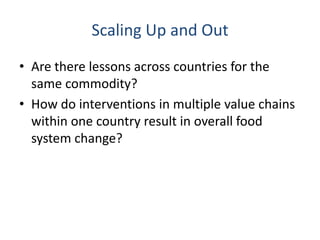

This document provides an overview of research being conducted under Theme 1 of the A4NH program to promote better diet quality through value chain interventions. It discusses how diet quality improves slowly with income growth and identifies various market and policy failures that result in underinvestment in nutrient-rich foods. The value chain approach aims to test interventions along the supply and demand sides to identify bottlenecks and solutions to constraints. Several new research projects are highlighted that are exploring improvements to specific value chains like vegetables, fish, dairy, and fruits to enhance nutritional outcomes. The goal is to learn lessons across countries and value chains to ultimately drive broader food system change.


