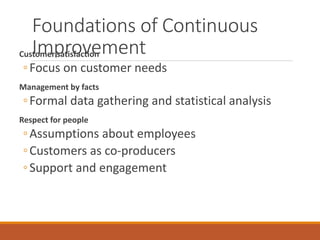
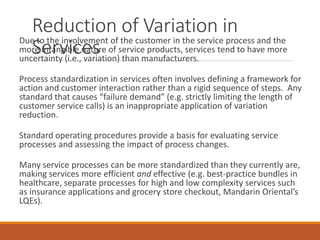
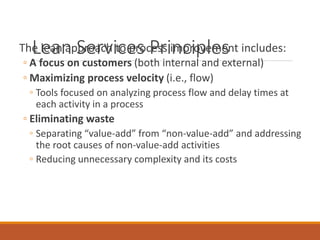
Service Process Improvement
Foundations of Continuous
ImprovementCustomer satisfaction
◦Focus on customer needs
Management by facts
◦Formal data gathering and statistical analysis
Respect for people
◦Assumptions about employees
◦Customers as co-producers
◦Support and engagement
Plan-Do-Check-Act (PDCA)
CyclePlan
◦ Documenting the current process, selecting the problem,
determining possible root causes, and developing an action
plan
Do
◦ Implementing the process change on a trial basis and collect
data on performance measures
Check
◦ Review and evaluate the effect of the change
Act
◦ If the experiment is successful, standardize the process change,
provide training on the new process, and codify learning from
the improvement process
Basic Tools for Quality and
Productivity Improvement
Check sheet
Run chart
Histogram
Pareto chart
Flowchart
Cause-and-effect diagram
Scatter diagram
Control chart
Process Improvement
Challenges in ServicesHigh input and process variation
◦ Variation reduction is a more complicated and sensitive issue than
in manufacturing
Poor tracking of flow, especially of customers in the process
◦ Customers cannot be treated like inventory
A tradition of individuality and employee discretion
Lack of meaningful data and data-based decision-making
◦ Quality metrics are often subjective (although time is an example
of an objective metric in transactional services)
Employees and customers cannot be controlled like machines
Six Sigma for Services
PrinciplesSix Sigma:
◦ Emphasizes the need to recognize high-impact, financially quantifiable
opportunities and eliminate defects as defined by customers
◦ Recognizes that variation hinders the ability to reliably deliver high-quality
services
◦ Requires data-driven decisions using a comprehensive set of quality tools
◦ Provides a highly prescriptive cultural infrastructure for aiding
implementation
◦ When implemented correctly, promises and delivers $500,000 of improved
operating profit per Black Belt per year
The Define-Measure-Analyze-Improve-Control (DMAIC) improvement
process used in Six Sigma is analogous to the PDCA cycle
Six Sigma Organization Roles
and Responsibilities
Champion Green Belts
Project MemberExecutive
All employees
Black BeltsMaster Black
Belts
•Full-time
•Train and coach Black and Green Belts
•Statistical problem solving experts
•Devote 50%-100% of time to Black Belt activities
•Facilitate and practice problem solving
•Train and coach Green Belts and project teams
•Project owner
•Implement solutions
•Black Belt managers
•Understand vision
•Apply concepts
•Part-time
•Help Black Belts
•Own vision, direction,
integration, results
•Lead change
•Part-time
•Project-specific
Sources of Variation in
ServicesCustomer introduced variability
◦ Arrival variability
◦ Request variability
◦ Capability variability
◦ Effort variability
◦ Subjective preference variability
Internal process variability
◦ Process design
◦ Employees
◦ Equipment
Reduction of Variation in
ServicesDue to the involvement of the customer in the service process and the
more intangible nature of service products, services tend to have more
uncertainty (i.e., variation) than manufacturers.
Process standardization in services often involves defining a framework for
action and customer interaction rather than a rigid sequence of steps. Any
standard that causes “failure demand” (e.g. strictly limiting the length of
customer service calls) is an inappropriate application of variation
reduction.
Standard operating procedures provide a basis for evaluating service
processes and assessing the impact of process changes.
Many service processes can be more standardized than they currently are,
making services more efficient and effective (e.g. best-practice bundles in
healthcare, separate processes for high and low complexity services such
as insurance applications and grocery store checkout, Mandarin Oriental’s
LQEs).
Lean Services PrinciplesThe lean approach to process improvement includes:
◦ A focus on customers (both internal and external)
◦ Maximizing process velocity (i.e., flow)
◦ Tools focused on analyzing process flow and delay times at
each activity in a process
◦ Eliminating waste
◦ Separating “value-add” from “non-value-add” and addressing
the root causes of non-value-add activities
◦ Reducing unnecessary complexity and its costs
Throughput Time and Process
Speed
Throughput time is the amount of time an item (e.g. customer)
takes to complete the process
Work-in-process is the number of items in progress
Average completion time is the number of items completed per
unit time
If two of the three quantities are known, the other two can be
calculated
Increasing process speed requires either reducing the WIP or
increasing the completion rate
Little’s Law:
ratecompletionAverage
progress-in-workofAmount
timeThroughput 
Services Wastes
Overprocessing
◦ Trying to add more value to a service than what your customers want or will pay
for
Transportation
◦ Unnecessary movement of materials, products or information
Motion
◦ Needless movement of people
Inventory
◦ Any WIP in excess of what is required to produce for the customer
Waiting time
◦ Any delay between when one process step/activity ends and the next
step/activity begins
Defects
◦ Any aspect of the service that does not conform to customer needs
Overproduction
◦ Production of outputs beyond what is need for immediate use
Lean Six Sigma for ServicesLean Six Sigma combines the emphasis on maximizing flows and reducing
waste from Lean with variation reduction and an organizational infrastructure
and specific improvement process from Six Sigma.
Lean Six Sigma for services focuses on improving the customer experience and
service outcomes by addressing poor flow and excess waste and variation in
the service delivery process for both the firm and customer co-producers.
Lean Six Sigma DMAIC Tools
(Lean tools in bold)
Define Improve ControlAnalyzeMeasure
•Project selection
tools
•PIP management
process
•Value stream map
•Financial analysis
•Project charter
•Multi-generational
plan
•Stakeholder
analysis
•Communication
plan
•SIPOC map
•High-level process
map
•Non-value-added
analysis
•VOC and Kano
analysis
•QFD
•RACI and quad
charts
•Operational
definitions
•Data collection plan
•Pareto chart
•Histogram
•Box plot
•Statistical sampling
•Measurement
system analysis
•Control charts
•Process cycle
efficiency
•Process sizing
•Process capability
•Pareto charts
•C&E matrix
•Fishbone diagrams
•Brainstorming
•Details “As-Is”
process maps
•Basic statistical tools
•Constraint
identification
•Time trap analysis
•Non-value-added
analysis
•Hypothesis testing
•Confidence intervals
•FMEA
•Simple & multiple
regression
•ANOVA
•Queuing theory
•Analytical batch
sizing
•Brainstorming
•Benchmarking
•TPM
•5S
•Line balancing
•Process flow
improvement
•Replenishment pull
•Sales & operations
planning
•Setup reduction
•Generic pull
•Kaizen
•Poka-yoke
•FMEA
•Hypothesis testing
•Solution selection
matrix
•“To-Be” process maps
•Piloting and simulation
•Control charts
•Standard operating
procedures (SOPs)
•Training plan
•Communication plan
•Implementation plan
•Visual process
control
•Mistake-proofing
•Process control
plans
•Project
commissioning
•Project replication
•Plan-Do-Check-Act
cycle
Examples of Lean Six Sigma
ToolsPoka-yoke (mistake-proofing)
◦ A poka-yoke device is a simple, often inexpensive, device that prevents
employee and customer mistakes from becoming defects (e.g. e-commerce
order forms, hospital wrist bands, spellcheckers).
◦ A poka-yoke device undertakes 100% automatic inspection and prevents
defects and/or stops or gives a warning when a defect is discovered.
◦ Poka-yoke steps include: elimination (possibilities for accidents or errors are
eliminated), replacement (replacing human actions by automated actions
for safety and error reasons), facilitation (make the work easier to carry out
and less error prone), detection (identifying mistakes before they become
defects), and mitigation (reduce the effects of an error).
Design of experiments (DOE)
◦ DOE is a method for simultaneously investigating anywhere from a handful
to dozens of potential causes of variation in a process. Experiments are
conducted by varying a number of factors according to a statistically-based
plan.

Service operation management 4

  • 1.
  • 2.
    Foundations of Continuous ImprovementCustomersatisfaction ◦Focus on customer needs Management by facts ◦Formal data gathering and statistical analysis Respect for people ◦Assumptions about employees ◦Customers as co-producers ◦Support and engagement
  • 3.
    Plan-Do-Check-Act (PDCA) CyclePlan ◦ Documentingthe current process, selecting the problem, determining possible root causes, and developing an action plan Do ◦ Implementing the process change on a trial basis and collect data on performance measures Check ◦ Review and evaluate the effect of the change Act ◦ If the experiment is successful, standardize the process change, provide training on the new process, and codify learning from the improvement process
  • 4.
    Basic Tools forQuality and Productivity Improvement Check sheet Run chart Histogram Pareto chart Flowchart Cause-and-effect diagram Scatter diagram Control chart
  • 5.
    Process Improvement Challenges inServicesHigh input and process variation ◦ Variation reduction is a more complicated and sensitive issue than in manufacturing Poor tracking of flow, especially of customers in the process ◦ Customers cannot be treated like inventory A tradition of individuality and employee discretion Lack of meaningful data and data-based decision-making ◦ Quality metrics are often subjective (although time is an example of an objective metric in transactional services) Employees and customers cannot be controlled like machines
  • 6.
    Six Sigma forServices PrinciplesSix Sigma: ◦ Emphasizes the need to recognize high-impact, financially quantifiable opportunities and eliminate defects as defined by customers ◦ Recognizes that variation hinders the ability to reliably deliver high-quality services ◦ Requires data-driven decisions using a comprehensive set of quality tools ◦ Provides a highly prescriptive cultural infrastructure for aiding implementation ◦ When implemented correctly, promises and delivers $500,000 of improved operating profit per Black Belt per year The Define-Measure-Analyze-Improve-Control (DMAIC) improvement process used in Six Sigma is analogous to the PDCA cycle
  • 7.
    Six Sigma OrganizationRoles and Responsibilities Champion Green Belts Project MemberExecutive All employees Black BeltsMaster Black Belts •Full-time •Train and coach Black and Green Belts •Statistical problem solving experts •Devote 50%-100% of time to Black Belt activities •Facilitate and practice problem solving •Train and coach Green Belts and project teams •Project owner •Implement solutions •Black Belt managers •Understand vision •Apply concepts •Part-time •Help Black Belts •Own vision, direction, integration, results •Lead change •Part-time •Project-specific
  • 8.
    Sources of Variationin ServicesCustomer introduced variability ◦ Arrival variability ◦ Request variability ◦ Capability variability ◦ Effort variability ◦ Subjective preference variability Internal process variability ◦ Process design ◦ Employees ◦ Equipment
  • 9.
    Reduction of Variationin ServicesDue to the involvement of the customer in the service process and the more intangible nature of service products, services tend to have more uncertainty (i.e., variation) than manufacturers. Process standardization in services often involves defining a framework for action and customer interaction rather than a rigid sequence of steps. Any standard that causes “failure demand” (e.g. strictly limiting the length of customer service calls) is an inappropriate application of variation reduction. Standard operating procedures provide a basis for evaluating service processes and assessing the impact of process changes. Many service processes can be more standardized than they currently are, making services more efficient and effective (e.g. best-practice bundles in healthcare, separate processes for high and low complexity services such as insurance applications and grocery store checkout, Mandarin Oriental’s LQEs).
  • 10.
    Lean Services PrinciplesThelean approach to process improvement includes: ◦ A focus on customers (both internal and external) ◦ Maximizing process velocity (i.e., flow) ◦ Tools focused on analyzing process flow and delay times at each activity in a process ◦ Eliminating waste ◦ Separating “value-add” from “non-value-add” and addressing the root causes of non-value-add activities ◦ Reducing unnecessary complexity and its costs
  • 11.
    Throughput Time andProcess Speed Throughput time is the amount of time an item (e.g. customer) takes to complete the process Work-in-process is the number of items in progress Average completion time is the number of items completed per unit time If two of the three quantities are known, the other two can be calculated Increasing process speed requires either reducing the WIP or increasing the completion rate Little’s Law: ratecompletionAverage progress-in-workofAmount timeThroughput 
  • 12.
    Services Wastes Overprocessing ◦ Tryingto add more value to a service than what your customers want or will pay for Transportation ◦ Unnecessary movement of materials, products or information Motion ◦ Needless movement of people Inventory ◦ Any WIP in excess of what is required to produce for the customer Waiting time ◦ Any delay between when one process step/activity ends and the next step/activity begins Defects ◦ Any aspect of the service that does not conform to customer needs Overproduction ◦ Production of outputs beyond what is need for immediate use
  • 13.
    Lean Six Sigmafor ServicesLean Six Sigma combines the emphasis on maximizing flows and reducing waste from Lean with variation reduction and an organizational infrastructure and specific improvement process from Six Sigma. Lean Six Sigma for services focuses on improving the customer experience and service outcomes by addressing poor flow and excess waste and variation in the service delivery process for both the firm and customer co-producers.
  • 14.
    Lean Six SigmaDMAIC Tools (Lean tools in bold) Define Improve ControlAnalyzeMeasure •Project selection tools •PIP management process •Value stream map •Financial analysis •Project charter •Multi-generational plan •Stakeholder analysis •Communication plan •SIPOC map •High-level process map •Non-value-added analysis •VOC and Kano analysis •QFD •RACI and quad charts •Operational definitions •Data collection plan •Pareto chart •Histogram •Box plot •Statistical sampling •Measurement system analysis •Control charts •Process cycle efficiency •Process sizing •Process capability •Pareto charts •C&E matrix •Fishbone diagrams •Brainstorming •Details “As-Is” process maps •Basic statistical tools •Constraint identification •Time trap analysis •Non-value-added analysis •Hypothesis testing •Confidence intervals •FMEA •Simple & multiple regression •ANOVA •Queuing theory •Analytical batch sizing •Brainstorming •Benchmarking •TPM •5S •Line balancing •Process flow improvement •Replenishment pull •Sales & operations planning •Setup reduction •Generic pull •Kaizen •Poka-yoke •FMEA •Hypothesis testing •Solution selection matrix •“To-Be” process maps •Piloting and simulation •Control charts •Standard operating procedures (SOPs) •Training plan •Communication plan •Implementation plan •Visual process control •Mistake-proofing •Process control plans •Project commissioning •Project replication •Plan-Do-Check-Act cycle
  • 15.
    Examples of LeanSix Sigma ToolsPoka-yoke (mistake-proofing) ◦ A poka-yoke device is a simple, often inexpensive, device that prevents employee and customer mistakes from becoming defects (e.g. e-commerce order forms, hospital wrist bands, spellcheckers). ◦ A poka-yoke device undertakes 100% automatic inspection and prevents defects and/or stops or gives a warning when a defect is discovered. ◦ Poka-yoke steps include: elimination (possibilities for accidents or errors are eliminated), replacement (replacing human actions by automated actions for safety and error reasons), facilitation (make the work easier to carry out and less error prone), detection (identifying mistakes before they become defects), and mitigation (reduce the effects of an error). Design of experiments (DOE) ◦ DOE is a method for simultaneously investigating anywhere from a handful to dozens of potential causes of variation in a process. Experiments are conducted by varying a number of factors according to a statistically-based plan.