Download to read offline


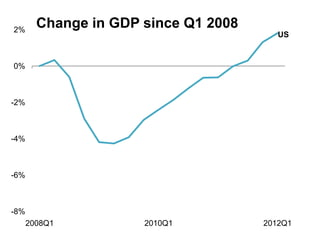
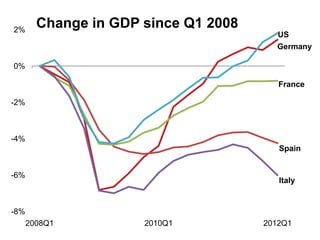

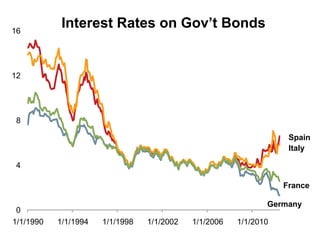

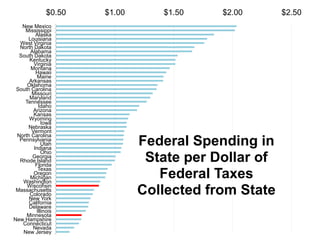


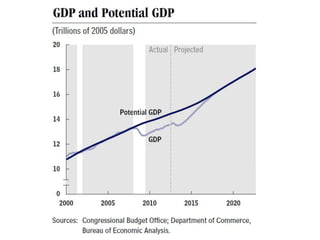


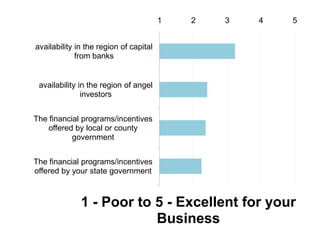


The document provides an economic update for the 7 Rivers region including: 1) Charts showing GDP growth in the US and Europe since 2008, with the US seeing a decline before recovering while southern European countries like Spain and Italy saw continued declines. 2) Data on interest rates on government bonds in European countries from 1990 to 2010, with rates in Spain and Italy rising significantly during the Euro crisis. 3) A chart comparing federal spending per dollar of taxes collected by different US states, with some southern states receiving more spending than taxes collected. 4) Information is presented but no clear consensus is reached on the challenges businesses face in accessing capital and the roles that various stakeholders can play in improving access to capital