Download to read offline


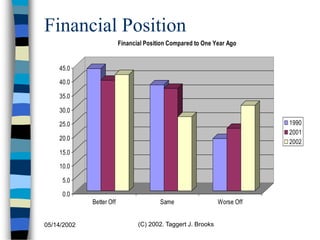

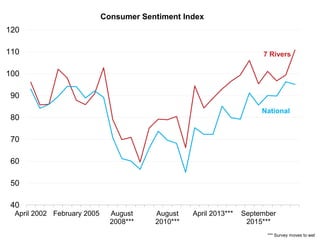
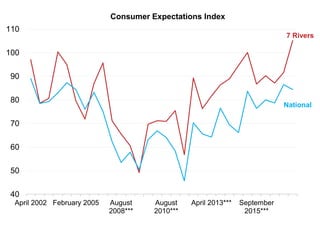
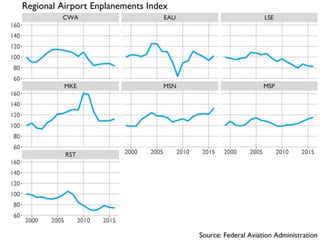


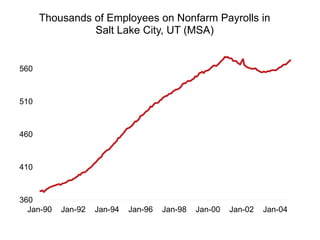
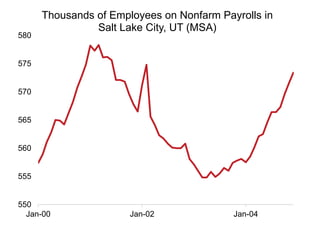

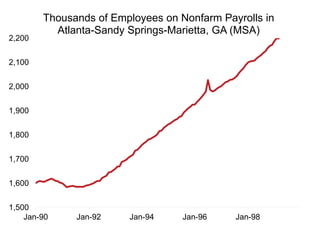
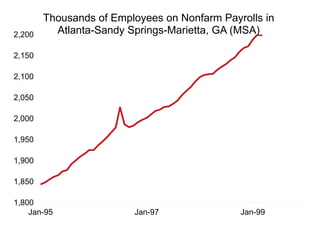


This document provides an economic update for the 7 Rivers region by reviewing several indicators: - A survey from 2002 shows that residents' financial positions compared to the previous year were mostly unchanged or better. - Consumer sentiment and expectations indices for the region have typically tracked close to national averages. - Tourism employment has grown steadily in benchmark cities like Salt Lake City and Atlanta in recent decades and remains a important industry for economic development in the region. - Developing amenities like trails and parks can provide downstream benefits to health, home values, and tourism in addition to improving quality of life. - Speakers at the event discussed leveraging the region's natural comparative advantages to attract investment and spur additional economic growth through tourism.


