
Recommended
Recommended
More Related Content
What's hot
What's hot (18)
Viewers also liked
Similar to ACS Farmer-Driven Nitrogen Rate Trial in Corn Silage
Similar to ACS Farmer-Driven Nitrogen Rate Trial in Corn Silage (20)
ACS Farmer-Driven Nitrogen Rate Trial in Corn Silage
- 1. 0 ACS Farmer-Driven Research Nitrogen Rate Trial in Corn Silage Trial Results Final Report December 2015
- 2. 1 ACS Farmer-Driven Research Program Contents Summary......................................................................................................................................... 2 Introduction..................................................................................................................................... 3 Materials and Methods.................................................................................................................... 3 Results & Discussion...................................................................................................................... 8 Preliminary Conclusions............................................................................................................... 12 Future Work.................................................................................................................................. 12
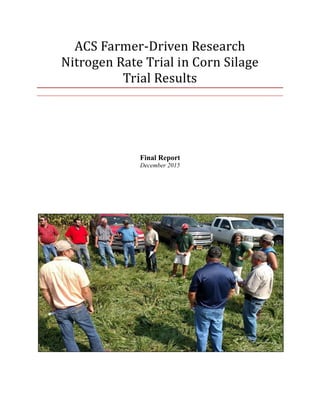
- 3. 2 ACS Farmer-Driven Research Program Summary Crop production advances require tools that can help plants optimize access to resources during development. Improved resource access enables plants to reach genetic potential in multiple environmental conditions. In 2015 farm managers in New York were able to purchase Adapt-N nitrogen management prediction tool for helping them make field specific sidedress nitrogen recommendations based on site-specific conditions. Independent crop consultants at Agricultural Consulting Services organized with Adapt-N and Walnut Ridge Dairy to collaboratively design and implement a fully replicated trial that would look at different nitrogen rates from 0 to 120 lbs of nitrogen at sidedress time while also using Adapt-N on this site to gain confidence in the use of the new Adapt-N tool. The results of the 2015 N treatments on the corn silage at Walnut Ridge Dairy showed that 120 lbs of N did not produce the maximum rate curve that the project had set out to produce but rather it showed that 120 lbs of N were needed during the 2015 season to make up for unusually high nitrogen losses under extreme wet conditions. We found that at the time of sidedress Adapt-N did not produce a recommendation that independent consultants were comfortable with nor in the end was the Adapt-N recommendation found to be accurate. Based on the 2015 growing season conditions changes were made to Adapt-N to improve its accuracy in predicting nitrogen needs under wet conditions. Figure 1: Research field day demonstrated the corn trials and gave local farmers and agri-service personnel an opportunity to tour the plots.
- 4. 3 ACS Farmer-Driven Research Program Introduction In 2015 Agricultural Consulting Services (ACS) decided as a company to investigate the use of Adapt-N as a tool for their consultants to use to improve and document decision-making for appropriate sidedress nitrogen rates in corn. The company decided to achieve this through two methods (1) offering each consultant in the company 200 acres to run as a test-run through the Adapt-N software and (2) to conduct a nitrogen rate trial to create a nitrogen response curve for the 2015 corn season in the Salmon Creek Watershed as well as document the performance of Adapt-N recommendations compared to the generated nitrogen response curve. The nitrogen rate trials were laid out on two fields with common scenarios of fall applied manure and both fall and spring applied manure. Based on pre-season estimates by ACS agronomists the projected sidedress nitrogen need for these sites would be between 0 and 70. The sidedress rates for the replicated trials were chosen to be 0, 40, 80, and 120 pounds of nitrogen. The 2015 crop season unfolded with unseasonably high rainfall amounts and cool temperatures until the end of June. These conditions put both the ACS agronomists and Adapt-N software to the test to produce sidedress N recommendations under extreme conditions. Materials and Methods Research plot location The 2015 Adapt N rate trials were located at Walnut Ridge Dairy in Lansing, New York. Treatments The nitrogen rates used for the trial were 0, 40, 80 and 120. These rates were decided pre-season based on expected sidedress needs being in the range of 0 to 70 pounds of nitrogen and with an expectation that 120 pounds would allow the response to level off and to create a curve. The plots were laid out on two fields in a random block design with four replications in each field. The pattern of the blocks followed the design in figure 2 below. #1 #2 #3 #4 #5 #6 #7 #8 #9 #10 #11 #12 #13 #14 #15 #16 Block 1 Block 2 Block 3 Block 4 key 0 pounds of nitrogen at sidedress 80 lbs of sidedress 40 pounds of nitrogen at sidedress 120 lbs of sidedress Figure 2: Schematic layout of the plots in each field.
- 5. 4 ACS Farmer-Driven Research Program Plots were laid out in two fields; field 41 and field 70, at Walnut Ridge Dairy. The plots were monitored during the season, flagged at sidedress time and sidedressed according to the plot design. Figure 3: Field 41 at Walnut Ridge Dairy, plots run N/S along Conlon Road with the most eastern plot being #1 and the most western plot is #16. Figure 4: Field 70 at Walnut Ridge Dairy, plots run N/S along Decamp Road with Plot #1 being the western most plot and plot #16 being the eastern most plot.
- 6. 5 ACS Farmer-Driven Research Program Field Fertility Program Field 41 started the season with an expected yield of 150 bushels per acre, had received 20,000 gallons per acre of fall manure and 27 pounds of starter nitrogen. At sidedress time on June 26, 2015 pre-Sidedress nitrate tests pulled on June 25th showed a soil nitrate level of 11 ppm, the Cornell N equation called for 12 (+/- 20) pounds of nitrogen, Adapt N called for 0 lbs, and the farm’s agronomist was calling for 80 lbs of sidedress N. Field 70 started the season with an expected yield of 152 bushels per acre, had received 16,000 gallons per acre of fall manure with an additional 10,000 gallons per acre of spring manure injected and 27 pounds of starter nitrogen. At sidedress time on June 26, 2015 a pre-sidedress nitrate tests pulled on June 25th showed a soil nitrate level of 11 ppm, the Cornell N equation was calling for 0 (+/- 20) lbs of N per acre, Adapt N called for 0 lbs and the farm’s agronomist called for 60 lbs of sidedress N. Figure 5: Field 41 showing the zero nitrogen sidedress test plot.
- 7. 6 ACS Farmer-Driven Research Program Field imagery for corn plots Using an Unmanned Aerial Vehicle ACS partnered with Agrinetix to fly the test plot fields on September 1st and take images of them in the visible spectrum and using the Normalized Difference Vegetation Index (NDVI). Figure 6: Field 41 visible spectrum Figure 7: NDVI imagery Figure 8: Field 70 visible spectrum Figure 9: NDVI imagery
- 8. 7 ACS Farmer-Driven Research Program Weather Conditions and Implications The 2015 season was characterized by extremely high rainfall throughout the season (Figure 14). The above-average rainfall caused flooding of corn fields in the early season slowing corn growth for a number of weeks. At sidedress time Adapt N was estimating that 6.8” of rain had fallen on field 41 since corn planting on May 9th and 9.1” of rainfall for field 70 since corn planting on May 7th . Figure 10: Weather patterns in 2015 were characterized by extremely wet (and unseasonable cool) May and June, then a very dry summer. Plot Measurements Yield and moisture for corn were measured by the harvest monitoring equipment in 2015 corn plots. Yield monitors on each field measured total wet tons harvested, area harvested and percent moisture every 1 second. The chopper operator was responsible for the average wet tons harvested for the designated plot area. ACS was responsible for verification of test plots identification and collection of the one gallon forage sample for quality analysis. Upon completion of the harvest of the test plots ACS pulls the digital yield data from the yield monitor for further processing. Further analysis involves looking at each individually recorded measurement by the chopper which were taken every two seconds and removing points with
- 9. 8 ACS Farmer-Driven Research Program measurement errors (measurements of zero moisture or zero yield). Next the data points are averaged or “bundled” across 40 foot intervals (3-4 individual measurements). These data bundles are then analyzed across the whole plot and outliers that are more than 2x the standard deviation are removed. The resulting plot average and standard deviation from the remaining data bundles are used for the statistical analysis. Silage quality was measured based on one gallon grab samples of silage taken from 32 plots at the time of harvest. Each silage sample was analyzed by Dairy One for a basic forage sample which included percent moisture, crude protein (CP), starch, neutral detergent fiber (NDF), phosphorus (P), IVTD24hrs, IVTD48hrs. These parameters were used to indicate silage quality. All plots were measured for each parameter and analyzed for statistical differences by Cornell University Statistical Consulting Unit. A mixed model was used for analysis with ‘field’ and ‘treatment’ and “field x treatment” as fixed effects and ‘block-within-field’ as a random effect. On-Farm Field Day A field day was conducted to demonstrate to farms how the research was being conducted and to raise awareness about the research and the project. The field nitrogen characteristics were discussed, plants were looked at and shallow rooting depth was observed during the field day. Figure 11: Observations made during the FDR field day on 9/8/15. Results & Discussion
- 10. 9 ACS Farmer-Driven Research Program Yield 2015 analysis Yield was measured across 32 plots in two fields. There was never a significant Field* treatment interaction for yield. The interaction term was then removed for all statistical models. Treatment was a significant factor for Yield and CP. The statistical model yield estimates and standard error are presented in Figure 6. The statistical analysis found a significant difference between the yields of the ‘0’ treatment and the ‘120’ treatment. Treatment Yield Estimate Standard Error 0 16.6 1.6 40 18.1 1.6 80 20.1 1.6 120 21.3 1.6 Figure 12: Yield estimates based on the statistical model and standard error associated with the estimate. This analysis found a significant difference between the '0' treatment and the ‘120’ treatment. Since treatment was significant for Yield, 90% and 95% confidence intervals were constructed around the estimates and the difference between treatments. Based on this analysis we are 90% confident that the mean yield for treatment 0 is between 13.9 and 19.3, and we are 90% certain the mean yield for treatment 120 is between 18.7 and 24.0. Said in another way, we are 90% confident that treatment ‘120’ has a mean yield that is between 2.25 and 7.22 larger than that of treatment ‘0’. Similarly, we are 95% confident that the mean yield for treatment ‘0’ is between 13.4 and 19.8 and the mean for an application of 120 pounds of N would fall between 18.1 and 24.5. Likewise, we are 95% confident that treatment ‘120’ has a mean yield that is between 1.75 and 7.73 more than treatment ‘0’. Based on the significant difference found between ‘0’ and ‘120’ and the 90% and 95% confidence intervals, return on investments (ROI) analysis was completed. This ROI analysis was found to be positive at both the 90% and 95% confidences when using the economic values of $0.60 per pound of N and $60.00 per wet ton of corn silage (Figure 13). N Applica- tion (pounds per acre) Cost of N Applica- tion (dollars) Value of Corn Silage Increased Yield from application (90% Confidence) Increased Yield from application (95% Confidence) Return on investment (90% Confidence) Return on investment (95% Confidence) 120 $ 91.00 $ 1,278.00 2.25-7.55 1.75-7.73 $ 44.00 - $ 362.00 $14.00 - $372.80 Figure 13: the Return on Investment analysis was shown to be positive for both the 90 and 95 percent confidence intervals.
- 11. 10 ACS Farmer-Driven Research Program Forage Quality – 2015 Analysis Twelve parameters were used to assess forage quality; percent crude protein (%CP), percent Acid Detergent Fiber (%ADF), percent neutral detergent fiber (%NDF), percent lignin, percent starch, three measurements of energy, VanAmburgh rate of digestion and measurements for Phosphorus, Magnesium, Potassium and Sulfur. None of the quality parameters showed a statistical significant change based on treatment in trials conducted in 2015. Site Treat- ment Ton per Acre % Crude Protein % Acid Deter- gent Fiber % Neutral Deter- gent Fiber % Lignin % Starch NEL Mcal /Lb NDFD 48hr % of NDF kd % hr IVTD 48hr % of DM % Phosp -horus % Potass -ium 41-1 120 24.9 6.9 20.4 38.5 2.2 40.9 0.85 80 4.51 92 0.23 0.82 41-2 40 20.0 6 23.8 43.6 2.3 37 0.81 80 4.19 91 0.22 0.89 41-3 80 23.4 6.6 22.5 42.3 2.2 39.7 0.82 84 4.97 93 0.23 0.66 41-4 0 18.4 5.4 27.9 48.7 2.8 24.6 0.74 80 4.39 90 0.21 0.87 41-5 40 22.3 5.4 25.4 46 2.7 33 0.78 77 4.04 89 0.23 0.99 41-6 80 23.6 6.8 27.8 48.4 2.9 28.7 0.74 75 3.77 88 0.25 1.27 41-7 0 17.3 6 27.5 50.9 2.5 28.4 0.73 78 3.86 89 0.23 1.24 41-8 120 25.8 7.1 23.3 44.5 2.5 34.8 0.79 79 4.19 91 0.27 1.09 41-9 80 26.2 6.6 24.2 45.5 2.5 34.2 0.79 82 4.69 92 0.27 1.05 41-10 0 28.7 5.6 23.2 43.2 2.6 37.7 0.81 78 4.19 90 0.2 1.05 41-11 120 29.8 6.5 25.2 46.9 2.6 32.1 0.77 75 3.69 88 0.24 1.14 41-12 40 28.3 5.6 24.6 46 2.8 35.4 0.78 74 3.74 88 0.2 1.01 41-13 120 29.4 6.5 23.5 44.9 2.4 36 0.79 80 4.25 91 0.26 0.92 41-14 80 29.2 8.2 28.3 50.3 2.8 26.3 0.73 74 3.53 87 0.28 1.38 41-15 40 29.5 7.3 25.3 46.4 2.5 29.5 0.77 80 4.32 91 0.28 1.27 41-16 0 23.0 4.8 27.2 49.7 1.8 32.8 0.76 79 3.71 90 0.24 1.13 70/1 120 22.6 6.7 22.6 39.7 2.8 39.3 0.82 73 3.8 89 0.22 1.02 70/2 40 20.7 6.4 25.8 47.3 2.5 32.1 0.76 75 3.65 88 0.22 1.05
- 12. 11 ACS Farmer-Driven Research Program 70/3 80 24.1 6.2 24.9 45.5 2.9 33.3 0.78 74 3.8 88 0.22 1.12 70/4 0 21.9 6.5 18.7 36.6 2.2 42.6 0.87 78 4.15 92 0.23 0.93 70/5 40 19.4 7.4 20.8 38.1 2.3 40.5 0.84 77 4.06 91 0.22 1.03 70/6 80 21.0 7.3 19.3 36.7 2.3 42.5 0.85 77 4.18 92 0.22 0.93 70/7 0 16.2 6.5 25.3 44.7 3.3 33 0.78 72 3.72 87 0.21 1.17 70/8 120 20.1 7.3 23.4 43.3 2.9 34.7 0.8 75 3.92 89 0.22 1.21 70/9 80 19.6 7.5 20.2 37.7 2.4 40.2 0.85 74 3.78 90 0.2 0.95 70/10 0 14.3 7.4 21.8 41.1 2.5 37.1 0.83 77 4.2 91 0.25 1 70/11 120 20.0 7.5 17.6 35.7 2.2 43.1 0.87 78 4.24 92 0.23 0.84 70/12 40 16.4 5.5 20.4 37 2.3 43.6 0.85 73 3.59 90 0.21 0.78 70/13 120 18.0 6.4 19 36 1.9 45 0.87 77 3.86 92 0.23 0.96 70/14 80 15.6 6.6 25.1 46.1 2.9 34.7 0.77 73 3.64 88 0.21 0.93 70/15 40 16.9 70/16 0 15.2
- 13. 12 ACS Farmer-Driven Research Program Preliminary Conclusions Adapt N (0 lbs) and Encirca (30lbs) Nitrogen models both underestimated the nitrogen sidedress N need for field 41 in the 2015 test plot fields on 6/26. Adapt N (0lbs) and Encrica (0lbs) Nitrogen models both underestimated the nitrogen sidedress N need for field 70 in the 2015 test plot fields on 6/26. The ACS agronomist looking at the farms nutrient management plan, use of a PSNT and knowing the unquantifiable losses from 20”+ of rainfall recommended 60 and 80 lbs of N respectively resulting in a 3.5 Ton/ac increase in the yield average over Adapt N. Adapt N has corrected their model based on this project and would now recommend 65 lbs on N for field 41 and 75lbs of N for field 70 on 6/26. Future Work This nitrogen response curve will return for the 2016 crop year to be funded by Adapt N, ACS and a participating farm. The 2016 test plot will be conducted in fields displaying consistent soils and yield potentials of conventional corn silage on a farm with a yield monitor, ability to sidedress 60’ plots and a willingness to host Farmer Driven Research.