Download as PDF, PPTX

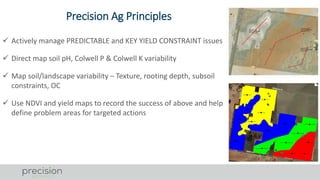


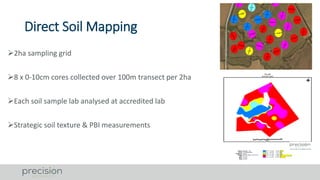


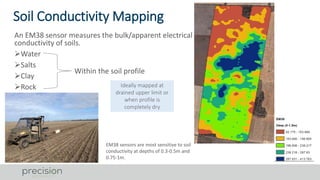


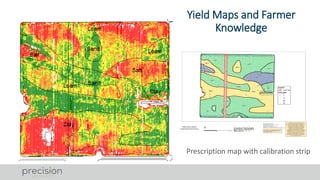

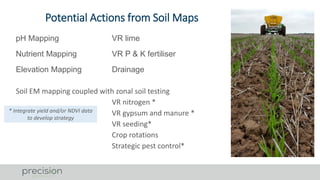


The document discusses various soil and landscape mapping technologies utilized in precision agriculture to enhance yield and manage constraints. It outlines the processes for variable rate applications of lime and phosphorus, emphasizing the benefits of direct soil mapping and using EM38 sensors for soil conductivity mapping. It also highlights the importance of integrating yield data and soil analysis for effective crop management strategies.


