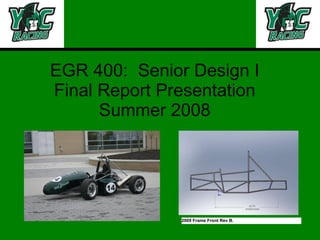
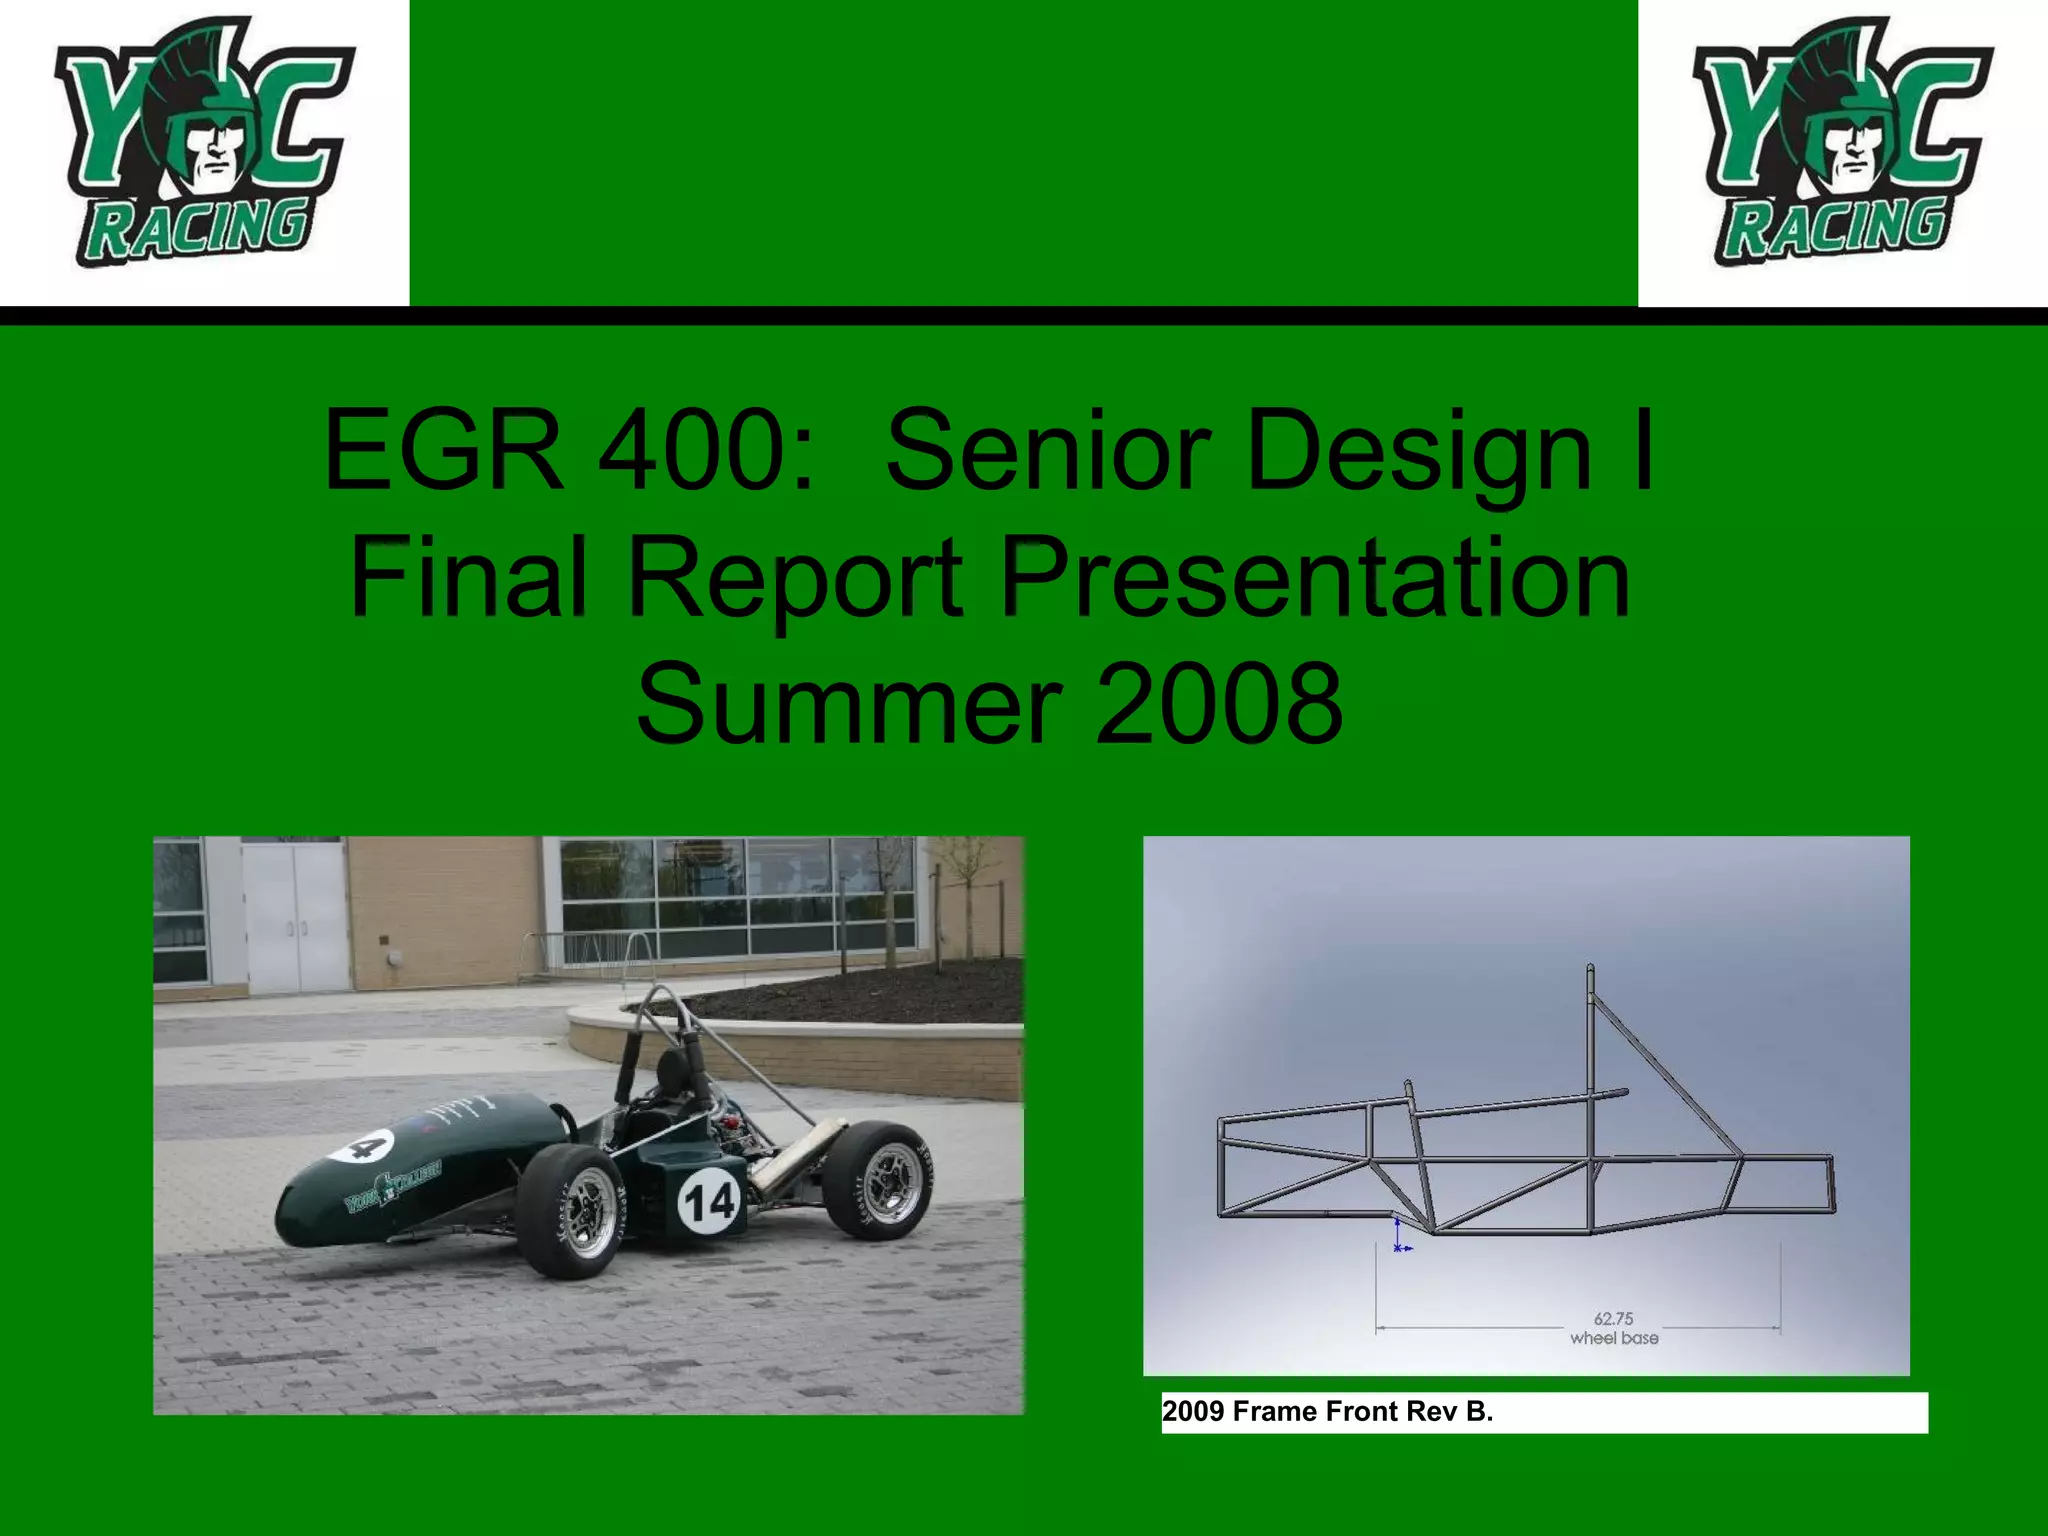
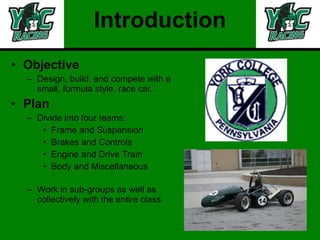
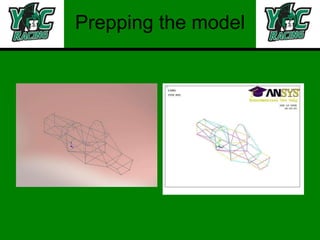
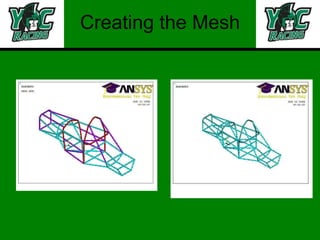
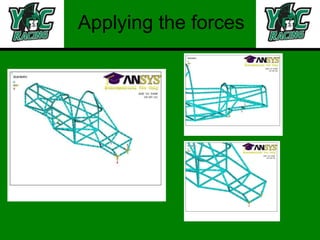
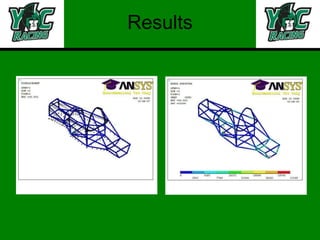
EGR 400:  Senior Design I Final Report Presentation Summer 2008 2009 Frame Front Rev B.
Introduction Objective Design, build, and compete with a small, formula style, race car.  Plan Divide into four teams: Frame and Suspension Brakes and Controls Engine and Drive Train Body and Miscellaneous Work in sub-groups as well as collectively with the entire class.
2009 Frame Used 2008 frame model as foundation for our design Many changes were implemented and there are more to come
Design Goals Improve driver safety Prevent driver’s arms from hitting sides of cockpit Eliminate “C-notch” Follow 2009 rules Two templates for cockpit Knee clearance for front roll hoop Two inches of clearance over driver’s head between front and main roll hoops Decrease weight of frame Decrease wheel base from 64” to 60” Shorten front of car while leaving room for pedals Fit every component needed
Benchmarks in the road we’ve traveled June 22: build prototype frame out of MDF Week of June 23: learn how to manipulate 2008 frame model Week of July 24: make 2 different revisions of the model to compare concepts Week of July 28: receive final front and rear suspension points from suspension team August 6: selection revision B as design
Prototype Goals Elbow clearance Foot pedal positions Height of roll hoops Line of sight Angle of drivers seat Adjustable for changes Steering wheel mounting
Prototype Success
Rev A vs. Rev B Revisions made to model to correct weight distribution problems Revision A:  62.75” wheelbase Rear tire back 2”  Revision B: 63.75” wheelbase Rear tire back 1” Driver forwards 1”
Driver safety 2008 Frame 2009 Frame
Side impact structure
C-notch
Templates Must fit in seating area Must fit in leg area
Templates
Suspension Points
Interaction with engine team Met with engine team  Engine compartment has approximately equal room to 2008 car, space won’t be an issue Engine mounts will be added to the model after they are designed
FEA with CosmosWorks
Material Properties Material properties obtained from MatWeb. Custom material created in SolidWorks. Material Properties: S ut  = 128 ksi S y  = 113 ksi
Torsional Stiffness Methodology: Back and left front were restrained. Torque of 2000 ft-lbs was applied at the right front. Deflection of right front was measured in inches. Torsional Stiffness was calculated as follows:
Torsional Stiffness
Worst Case Stress Methodology: Back restrained and a weight hung from the front. At 90 lbs  max stress was 104.2 ksi At 110 lbs  max stress was 127.3 ksi
Case 1 Suspension Methodology Force vectors for the three main scenarios were obtained from the suspension team. Force vectors were applied to each of the 16 suspension points. The rear was restrained.
Case 1:  Worst Case Stress Max stress occurred at the left rear lower A-arm suspension point Max stress was 35.92 ksi Factor of safety against yielding is 3.15 Factor of safety against failure is 3.56
Case 1:  Displacement
Case 1:  Bending Stress Max stress occurred at the right rear A-arm front suspension point Max stress was 14.37 ksi Factor of safety against yielding is 7.86 Factor of safety against failure is 8.91
FEA w/ ANSYS
Prepping the model
Creating the Mesh
Applying the forces
Results
What’s Next? Analysis needs to be completed for case 2 and case 3. Results from ANSYS analysis need to be compared. Anticipate similar results.
Conclusions from FEA We have a frame that will meet or exceed all the physical requirements.
Changes Planned Main roll hoop  Radii of bends Height Front roll hoop Radii of bends Number of bends Main roll hoop bracing Front suspension point member Shoulder harness and back brace Add gussets for shoulder harness and back brace  Engine mounts
Engine Sensors Sensors Throttle Position Air Temperature Water Temperature Crank Position Each sensor delivers feedback to the ECU Plan to add a Manifold Absolute Pressure sensor.
Engine Tuning Goals Began with acquiring a FSAE 4cly. Engine map from Performance Electronics. Read the tuning manual for the ECU to understand the different parameters of the engine Engine started Tune engine
Engine Tuning
Engine Tuning We tuned the engine Real World Stand testing The fuel map is tuned to be the correct ratio Spark map was left alone because that has more chance of damaging the engine
Engine Goals Acceleration and Deceleration compensations need more tuning Re-tune the fuel and spark maps once the MAP sensor is installed Also, need re-tune for our intake and exhaust designs Swap engines with 2008 FSAE car
Drive Train: Goals Improve upon current design Lighter/smaller differential Account for torque steer and misaligned sprocket Improve acceleration Gear ratio Larger rear sprocket
Drive Train: Sprocket Use basic concept from current car 11 tooth pinion At least 48 tooth rear sprocket Testing must be done to determine effectiveness of more teeth  Gear ratio: 4.364
Drive Train: Differential Design choices: Honda ATV diff. Audi diff. (2007 FSAE) Miata diff. (2008 FSAE) New diff. Considerations: Ease of adaptation Weight Simplicity
Drive Train- Axles Sprocket misalignment Solution/Alternatives Center the differential Multi-stage gear Larger differential housing Use different diameter axles Provide calculations to prove design choices
Drive Train- Axles Factory Specifications: Peak horsepower- 123hp Peak RPM- 13000rpm Pinion torque- 49ftlbf Gears: N p = 11 teeth N g = 48 teeth Assumed dimensions: Short shaft- 16in, 1in diameter Long shaft- 24in, 1 in diameter
Drive Train- Axles Calculations: Gear RPM- 2979rpm Gear torque- 216ftlbf Angle of twist Φ short = 1.04deg Φ long = 1.56deg Difference= .519deg Calculate the new diameter of the longer shaft: D long = 1.10in With: D short = 1.0in Not large enough to have an impact Would require 2 different sized bearings
Intake Philosophy Components of Intake Calculations Preliminary Design Future Plans
Philosophy Effectively designed intake will improve volumetric efficiency Torque Horsepower Fuel efficiency
Components of Intake Air Filter Removes impurities Throttle Body Manage air flow Restrictor FSAE mandated Plenum Air reservoir Fuel Injectors Fuel regulation Runners Cylinder air delivery
Restrictor 20mm Venturi Restrictor Placed after throttle body Severely limits air flow
Restrictor D 35 mm L1 35 mm R1 48.125 mm α1 21 Degrees R2 72.5 mm Dt 20 mm L3 6.67 mm R3 100 mm α2 7 Degrees R4 100 mm L5 35 mm
Plenum Smooth out turbulence Even flow distribution 4-6X engine displacement 3000cc Shape not yet determined
Runners Employed resonance equations L total =18” Primary tuning peak=5000 RPM Helmholtz peak=7500 RPM Helmholtz peak=11250 RPM
Preliminary Design Overhead Entrance Straight delivery=Minimal flow loss Easier construction Side Entrance More bends=More flow loss More difficult construction
Preliminary Design
Future Plans Verify runner length Ricardo  Ohata & Ishida Better CAD model CFD’s Fabrication
Exhaust Design Overview Components Header Design Considerations Selected design Muffler design Considerations Selected Muffler
Exhaust Components Header  Collector  Muffler
Header Design Concerns Type of Header 4 to 2 to 1 4 to 1 Primary Pipe Length Pipe Inner Diameter Stepped Pipe
Header Design Competition Requirements Final Design  Primary Pipe Length Pipe Diameter  Collector
Muffler Design Concerns Muffler Types Resonance Absorptive Back Pressure Materials Titanium Stainless Steel Carbon Fiber
Supertrapp Universal fit Adjustable Stainless Steel
Suspension Goals:  Maximize Friction Establishes ability to steer, brake, and accelerate Provide steering stability and feedback Determines the handling of the vehicle
Suspension Geometry King Pin Inclination 2.5° Helps with packaging Provides steering feedback Increases steering effort Scrub Radius .75” Similar effects as KPI
Suspension  Geometry Static Camber Front: -1°, Rear: -.5° Negative camber maximizes the size of the tire patch Caster 4° Provides beneficial camber gain during steering Increases steering effort
Front View Geometry Solidworks/Excel Parameters set in Excel and imported into Solidworks Solidworks used to cycle suspension through range of motion Results graphed in Excel
Camber Curves
Stress Analysis Excel sheet used to find wheel loads MathCAD file used to find forces in each member Excel sheet used to calculate safety factors in tension, compression, and buckling
Suspension Dynamics:  Tire Behavior Slip angle Cornering force curve Pneumatic trail Aligning torque Steering torque
Suspension Dynamics:  Ride & Roll Rates Lateral Load Transfer Wheel center rate Ride rate Roll rate
Worst case scenario: Critical speed at tightest turn Weight & CG Assumptions Iterative design process Preliminary results Roll gradient & body roll angle Wheel, spring & anti-roll bar rates Slip angle, aligning torque & steering torque Suspension Dynamics:  Ride & Roll Rate Calculations
Pull rod vs. push rod Lower CG & reduce weight Rocker arm Installation ratio of 1: increased sensitivity  Anti-roll bar Blades: increased adjustability  Shocks 1’’ jounce, 1’’ rebound Suspension Linkage  Design Overview
Suspension Linkage  Design Overview II
Suspension Linkage  Design Overview III
Upright Design Design Goals Material Weight / Strength / Cost Easy to manufacture Similar manufacturing procedure KPI, Brakes, A-Arms, Steering Prototypes
Front Uprights
Rear Uprights Design Goals Interchangeable Lightweight Design Considerations A-arms Tie-Rod Bearing
Steering Design Goals No > 180 º for  any  turn 60º - 80º steer = 9.5m turn Ratio for manageable steer Rack total travel ≤ stock
Steering Basic Geometry Steering Calculation Find point B WRT A Calculate angle CAB Subtract arm angle Subtract angle to vertical Steering angle Calculate Steering ratio
Steering Ackermann Steering
Brakes Design Goals Max pedal force < 100lbf  No lock < 60lbf pedal force Lock front wheels first Built-in Bias Light, Compact, Inexpensive
Brakes System Layout
Aerodynamics Benefits Stability & Control Increase Downforce Better Traction Air Flow Control Drag Reduction
Aerodynamics Drag Components Basic External Shape Less than Perfect Shape Interference Internal Flow Devices External Flow Devices Wheels & Wheel Wells
Aerodynamics Internal Flow Devices Goal: Optimize Cooling Efficiency Types Ram Air Ducts Nose Side Scoops (High-Mounted Units) Flush Duct (NACA Submerged Inlet)
Aerodynamics Side Ram Air Duct Benefit: Easy Input & Output Adjustments Scoop Benefit: Low Speed Operations Coverts Air Velocity to Pressure
Aerodynamics External Flow Devices Surface Roughness Permissible Grain Diameter = 0.0021in Same as for Unpainted Sheet Metal Vortex Generators Control & Delay Flow Separation
Aerodynamics Rear Wings Rear Downforce & Increased Deceleration  Rear Spoilers Separate Air Flow & Rear Downforce Slotted Front Wings Frontal Downforce & Very Little Drag Rear Wheel Curved Guide Vanes Decrease Drag & Increase Downforce on Tires
Aerodynamics Ground Effects “Sucker Car” Increased Downforce from 1.3 to 1.7g’s Low Speeds Nose Angle Horizontal to 10° Down  Lift Coefficient from -0.95 to -2.3
Aerodynamics Venturi Upsweep Controls strength of two vortices Height of Side Skirts Drawback Open Wheeled Vehicles Diminish Effects
Aerodynamics Testing Wind Tunnel Employ Correction Factors CAD Program Know Programs Limitations Calculate Frontal Area Guess Overall Drag Coefficient Estimate Drag Components Guess Interference Effects
Aerodynamics Conclusion Explored Variety of Aerodynamic Designs Promising Low Speed Design Options Side Ram Air Duct Slotted Front Wings Venturi Upsweeps Will Effect Handling Ability to “Grip” the Road Skid Pad Autocross

Senior Design Summer 2008 Presentation

  • 1.
    EGR 400: Senior Design I Final Report Presentation Summer 2008 2009 Frame Front Rev B.
  • 2.
    Introduction Objective Design,build, and compete with a small, formula style, race car. Plan Divide into four teams: Frame and Suspension Brakes and Controls Engine and Drive Train Body and Miscellaneous Work in sub-groups as well as collectively with the entire class.
  • 3.
    2009 Frame Used2008 frame model as foundation for our design Many changes were implemented and there are more to come
  • 4.
    Design Goals Improvedriver safety Prevent driver’s arms from hitting sides of cockpit Eliminate “C-notch” Follow 2009 rules Two templates for cockpit Knee clearance for front roll hoop Two inches of clearance over driver’s head between front and main roll hoops Decrease weight of frame Decrease wheel base from 64” to 60” Shorten front of car while leaving room for pedals Fit every component needed
  • 5.
    Benchmarks in theroad we’ve traveled June 22: build prototype frame out of MDF Week of June 23: learn how to manipulate 2008 frame model Week of July 24: make 2 different revisions of the model to compare concepts Week of July 28: receive final front and rear suspension points from suspension team August 6: selection revision B as design
  • 6.
    Prototype Goals Elbowclearance Foot pedal positions Height of roll hoops Line of sight Angle of drivers seat Adjustable for changes Steering wheel mounting
  • 7.
  • 8.
    Rev A vs.Rev B Revisions made to model to correct weight distribution problems Revision A: 62.75” wheelbase Rear tire back 2” Revision B: 63.75” wheelbase Rear tire back 1” Driver forwards 1”
  • 9.
    Driver safety 2008Frame 2009 Frame
  • 10.
  • 11.
  • 12.
    Templates Must fitin seating area Must fit in leg area
  • 13.
  • 14.
  • 15.
    Interaction with engineteam Met with engine team Engine compartment has approximately equal room to 2008 car, space won’t be an issue Engine mounts will be added to the model after they are designed
  • 16.
  • 17.
    Material Properties Materialproperties obtained from MatWeb. Custom material created in SolidWorks. Material Properties: S ut = 128 ksi S y = 113 ksi
  • 18.
    Torsional Stiffness Methodology:Back and left front were restrained. Torque of 2000 ft-lbs was applied at the right front. Deflection of right front was measured in inches. Torsional Stiffness was calculated as follows:
  • 19.
  • 20.
    Worst Case StressMethodology: Back restrained and a weight hung from the front. At 90 lbs max stress was 104.2 ksi At 110 lbs max stress was 127.3 ksi
  • 21.
    Case 1 SuspensionMethodology Force vectors for the three main scenarios were obtained from the suspension team. Force vectors were applied to each of the 16 suspension points. The rear was restrained.
  • 22.
    Case 1: Worst Case Stress Max stress occurred at the left rear lower A-arm suspension point Max stress was 35.92 ksi Factor of safety against yielding is 3.15 Factor of safety against failure is 3.56
  • 23.
    Case 1: Displacement
  • 24.
    Case 1: Bending Stress Max stress occurred at the right rear A-arm front suspension point Max stress was 14.37 ksi Factor of safety against yielding is 7.86 Factor of safety against failure is 8.91
  • 25.
  • 26.
  • 27.
  • 28.
  • 29.
  • 30.
    What’s Next? Analysisneeds to be completed for case 2 and case 3. Results from ANSYS analysis need to be compared. Anticipate similar results.
  • 31.
    Conclusions from FEAWe have a frame that will meet or exceed all the physical requirements.
  • 32.
    Changes Planned Mainroll hoop Radii of bends Height Front roll hoop Radii of bends Number of bends Main roll hoop bracing Front suspension point member Shoulder harness and back brace Add gussets for shoulder harness and back brace Engine mounts
  • 33.
    Engine Sensors SensorsThrottle Position Air Temperature Water Temperature Crank Position Each sensor delivers feedback to the ECU Plan to add a Manifold Absolute Pressure sensor.
  • 34.
    Engine Tuning GoalsBegan with acquiring a FSAE 4cly. Engine map from Performance Electronics. Read the tuning manual for the ECU to understand the different parameters of the engine Engine started Tune engine
  • 35.
  • 36.
    Engine Tuning Wetuned the engine Real World Stand testing The fuel map is tuned to be the correct ratio Spark map was left alone because that has more chance of damaging the engine
  • 37.
    Engine Goals Accelerationand Deceleration compensations need more tuning Re-tune the fuel and spark maps once the MAP sensor is installed Also, need re-tune for our intake and exhaust designs Swap engines with 2008 FSAE car
  • 38.
    Drive Train: GoalsImprove upon current design Lighter/smaller differential Account for torque steer and misaligned sprocket Improve acceleration Gear ratio Larger rear sprocket
  • 39.
    Drive Train: SprocketUse basic concept from current car 11 tooth pinion At least 48 tooth rear sprocket Testing must be done to determine effectiveness of more teeth Gear ratio: 4.364
  • 40.
    Drive Train: DifferentialDesign choices: Honda ATV diff. Audi diff. (2007 FSAE) Miata diff. (2008 FSAE) New diff. Considerations: Ease of adaptation Weight Simplicity
  • 41.
    Drive Train- AxlesSprocket misalignment Solution/Alternatives Center the differential Multi-stage gear Larger differential housing Use different diameter axles Provide calculations to prove design choices
  • 42.
    Drive Train- AxlesFactory Specifications: Peak horsepower- 123hp Peak RPM- 13000rpm Pinion torque- 49ftlbf Gears: N p = 11 teeth N g = 48 teeth Assumed dimensions: Short shaft- 16in, 1in diameter Long shaft- 24in, 1 in diameter
  • 43.
    Drive Train- AxlesCalculations: Gear RPM- 2979rpm Gear torque- 216ftlbf Angle of twist Φ short = 1.04deg Φ long = 1.56deg Difference= .519deg Calculate the new diameter of the longer shaft: D long = 1.10in With: D short = 1.0in Not large enough to have an impact Would require 2 different sized bearings
  • 44.
    Intake Philosophy Componentsof Intake Calculations Preliminary Design Future Plans
  • 45.
    Philosophy Effectively designedintake will improve volumetric efficiency Torque Horsepower Fuel efficiency
  • 46.
    Components of IntakeAir Filter Removes impurities Throttle Body Manage air flow Restrictor FSAE mandated Plenum Air reservoir Fuel Injectors Fuel regulation Runners Cylinder air delivery
  • 47.
    Restrictor 20mm VenturiRestrictor Placed after throttle body Severely limits air flow
  • 48.
    Restrictor D 35mm L1 35 mm R1 48.125 mm α1 21 Degrees R2 72.5 mm Dt 20 mm L3 6.67 mm R3 100 mm α2 7 Degrees R4 100 mm L5 35 mm
  • 49.
    Plenum Smooth outturbulence Even flow distribution 4-6X engine displacement 3000cc Shape not yet determined
  • 50.
    Runners Employed resonanceequations L total =18” Primary tuning peak=5000 RPM Helmholtz peak=7500 RPM Helmholtz peak=11250 RPM
  • 51.
    Preliminary Design OverheadEntrance Straight delivery=Minimal flow loss Easier construction Side Entrance More bends=More flow loss More difficult construction
  • 52.
  • 53.
    Future Plans Verifyrunner length Ricardo Ohata & Ishida Better CAD model CFD’s Fabrication
  • 54.
    Exhaust Design OverviewComponents Header Design Considerations Selected design Muffler design Considerations Selected Muffler
  • 55.
    Exhaust Components Header Collector Muffler
  • 56.
    Header Design ConcernsType of Header 4 to 2 to 1 4 to 1 Primary Pipe Length Pipe Inner Diameter Stepped Pipe
  • 57.
    Header Design CompetitionRequirements Final Design Primary Pipe Length Pipe Diameter Collector
  • 58.
    Muffler Design ConcernsMuffler Types Resonance Absorptive Back Pressure Materials Titanium Stainless Steel Carbon Fiber
  • 59.
    Supertrapp Universal fitAdjustable Stainless Steel
  • 60.
    Suspension Goals: Maximize Friction Establishes ability to steer, brake, and accelerate Provide steering stability and feedback Determines the handling of the vehicle
  • 61.
    Suspension Geometry KingPin Inclination 2.5° Helps with packaging Provides steering feedback Increases steering effort Scrub Radius .75” Similar effects as KPI
  • 62.
    Suspension GeometryStatic Camber Front: -1°, Rear: -.5° Negative camber maximizes the size of the tire patch Caster 4° Provides beneficial camber gain during steering Increases steering effort
  • 63.
    Front View GeometrySolidworks/Excel Parameters set in Excel and imported into Solidworks Solidworks used to cycle suspension through range of motion Results graphed in Excel
  • 64.
  • 65.
    Stress Analysis Excelsheet used to find wheel loads MathCAD file used to find forces in each member Excel sheet used to calculate safety factors in tension, compression, and buckling
  • 66.
    Suspension Dynamics: Tire Behavior Slip angle Cornering force curve Pneumatic trail Aligning torque Steering torque
  • 67.
    Suspension Dynamics: Ride & Roll Rates Lateral Load Transfer Wheel center rate Ride rate Roll rate
  • 68.
    Worst case scenario:Critical speed at tightest turn Weight & CG Assumptions Iterative design process Preliminary results Roll gradient & body roll angle Wheel, spring & anti-roll bar rates Slip angle, aligning torque & steering torque Suspension Dynamics: Ride & Roll Rate Calculations
  • 69.
    Pull rod vs.push rod Lower CG & reduce weight Rocker arm Installation ratio of 1: increased sensitivity Anti-roll bar Blades: increased adjustability Shocks 1’’ jounce, 1’’ rebound Suspension Linkage Design Overview
  • 70.
    Suspension Linkage Design Overview II
  • 71.
    Suspension Linkage Design Overview III
  • 72.
    Upright Design DesignGoals Material Weight / Strength / Cost Easy to manufacture Similar manufacturing procedure KPI, Brakes, A-Arms, Steering Prototypes
  • 73.
  • 74.
    Rear Uprights DesignGoals Interchangeable Lightweight Design Considerations A-arms Tie-Rod Bearing
  • 75.
    Steering Design GoalsNo > 180 º for any turn 60º - 80º steer = 9.5m turn Ratio for manageable steer Rack total travel ≤ stock
  • 76.
    Steering Basic GeometrySteering Calculation Find point B WRT A Calculate angle CAB Subtract arm angle Subtract angle to vertical Steering angle Calculate Steering ratio
  • 77.
  • 78.
    Brakes Design GoalsMax pedal force < 100lbf No lock < 60lbf pedal force Lock front wheels first Built-in Bias Light, Compact, Inexpensive
  • 79.
  • 80.
    Aerodynamics Benefits Stability& Control Increase Downforce Better Traction Air Flow Control Drag Reduction
  • 81.
    Aerodynamics Drag ComponentsBasic External Shape Less than Perfect Shape Interference Internal Flow Devices External Flow Devices Wheels & Wheel Wells
  • 82.
    Aerodynamics Internal FlowDevices Goal: Optimize Cooling Efficiency Types Ram Air Ducts Nose Side Scoops (High-Mounted Units) Flush Duct (NACA Submerged Inlet)
  • 83.
    Aerodynamics Side RamAir Duct Benefit: Easy Input & Output Adjustments Scoop Benefit: Low Speed Operations Coverts Air Velocity to Pressure
  • 84.
    Aerodynamics External FlowDevices Surface Roughness Permissible Grain Diameter = 0.0021in Same as for Unpainted Sheet Metal Vortex Generators Control & Delay Flow Separation
  • 85.
    Aerodynamics Rear WingsRear Downforce & Increased Deceleration Rear Spoilers Separate Air Flow & Rear Downforce Slotted Front Wings Frontal Downforce & Very Little Drag Rear Wheel Curved Guide Vanes Decrease Drag & Increase Downforce on Tires
  • 86.
    Aerodynamics Ground Effects“Sucker Car” Increased Downforce from 1.3 to 1.7g’s Low Speeds Nose Angle Horizontal to 10° Down Lift Coefficient from -0.95 to -2.3
  • 87.
    Aerodynamics Venturi UpsweepControls strength of two vortices Height of Side Skirts Drawback Open Wheeled Vehicles Diminish Effects
  • 88.
    Aerodynamics Testing WindTunnel Employ Correction Factors CAD Program Know Programs Limitations Calculate Frontal Area Guess Overall Drag Coefficient Estimate Drag Components Guess Interference Effects
  • 89.
    Aerodynamics Conclusion ExploredVariety of Aerodynamic Designs Promising Low Speed Design Options Side Ram Air Duct Slotted Front Wings Venturi Upsweeps Will Effect Handling Ability to “Grip” the Road Skid Pad Autocross