Downloaded 23 times

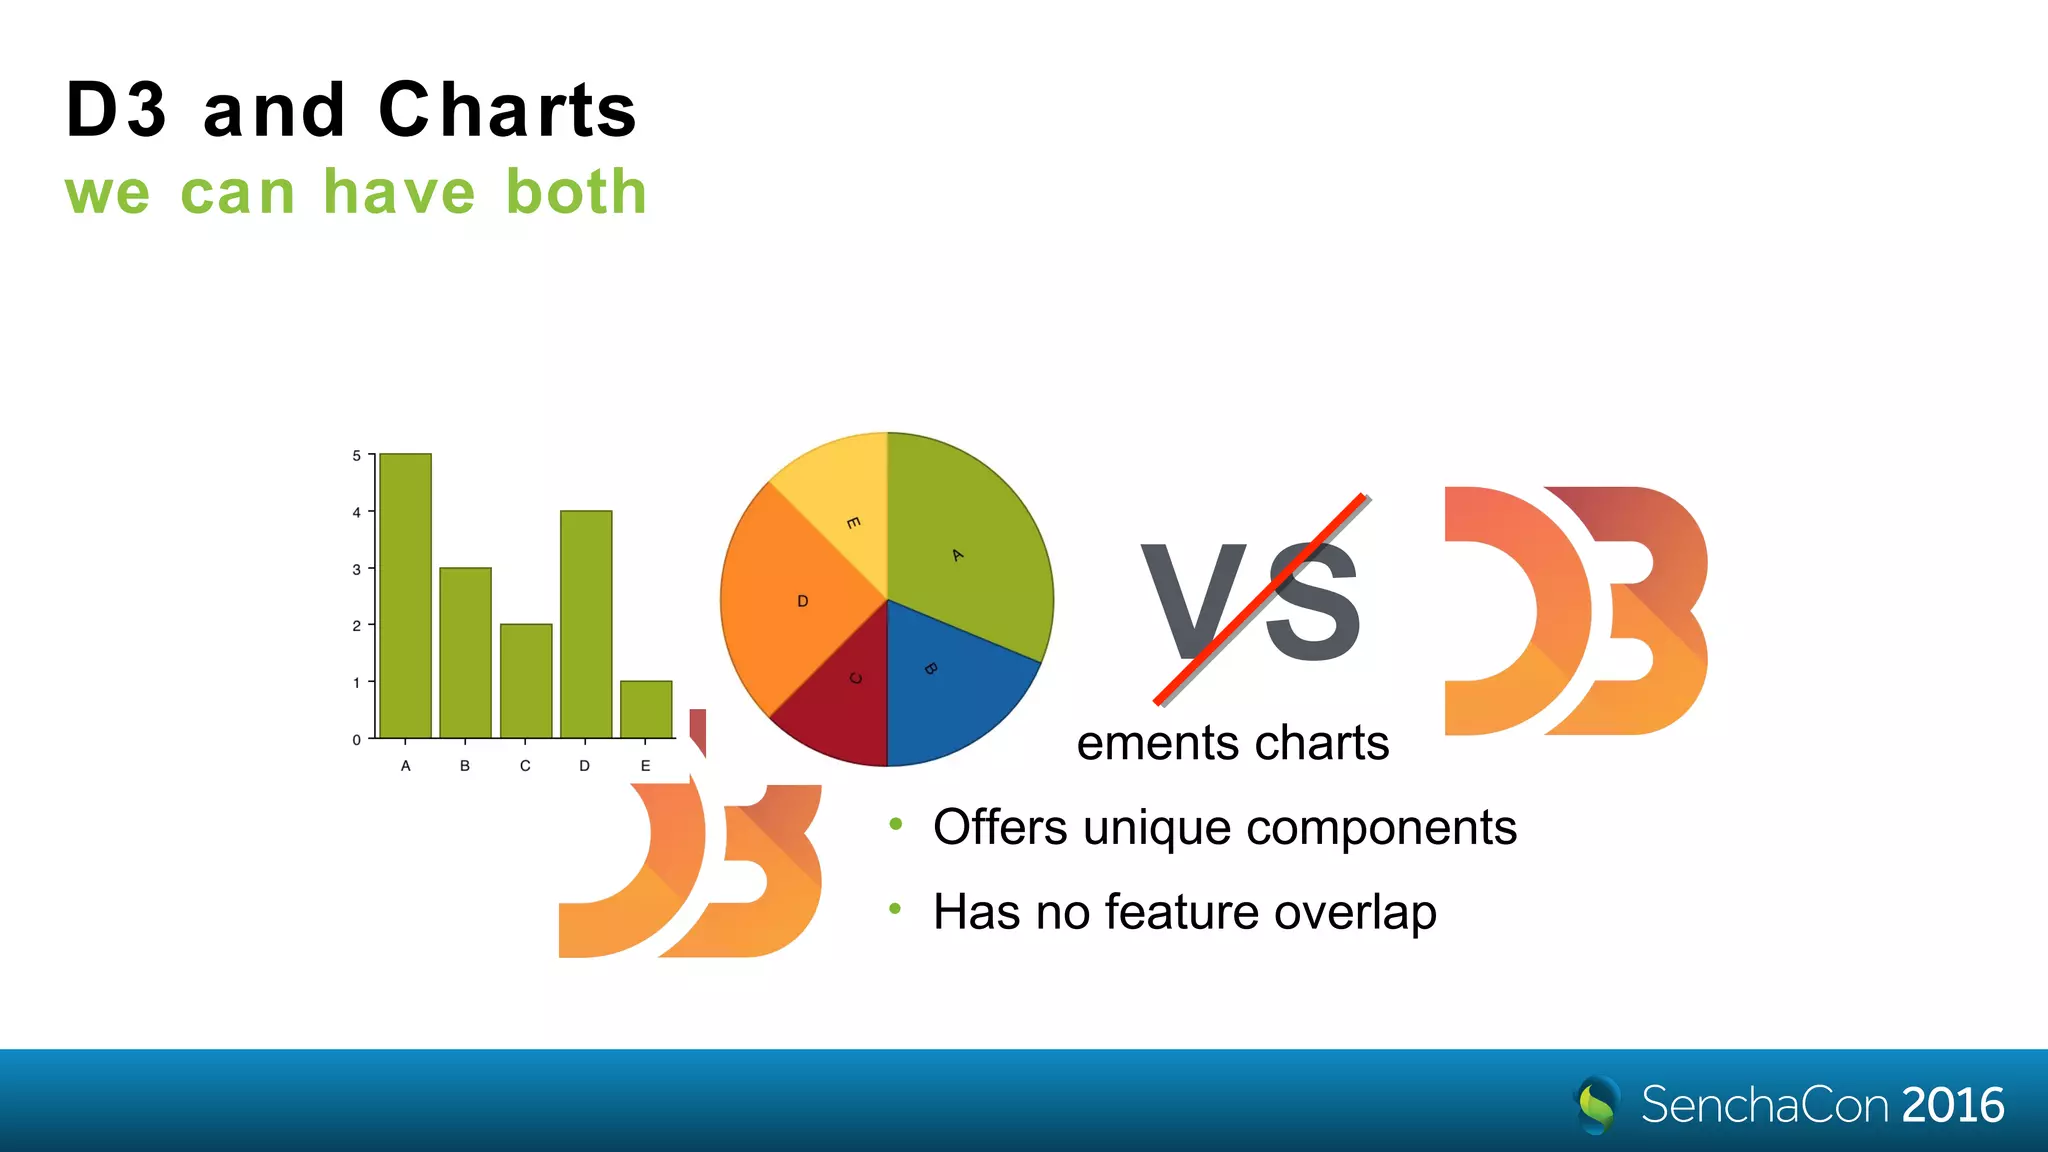

![The data is a tree of
objects with
•the name field
•the children array
{
name: 'A',
expanded: true,
children: [
{
name: 'B',
expanded: true,
children: [
{
name: 'D'
},
{
name: 'E'
}
]
},
{
name: 'C'
}
]
}
Data](https://image.slidesharecdn.com/vitaly-addmagictoyourextjsapps-161206022457/75/SenchaCon-2016-Add-Magic-to-Your-Ext-JS-Apps-with-D3-Visualizations-Vitaly-Kravchenko-6-2048.jpg)
![How do we know to fetch
the name?
• name and text are the defaults nodeText: ['name', 'text']
nodeText: 'foo'• but it can be anything
nodeText: function (component, node) {
var record = node.data;
return record.get('firstName')
+ ' '
+ record.get('lastName');
}
• including a calculated value](https://image.slidesharecdn.com/vitaly-addmagictoyourextjsapps-161206022457/75/SenchaCon-2016-Add-Magic-to-Your-Ext-JS-Apps-with-D3-Visualizations-Vitaly-Kravchenko-8-2048.jpg)
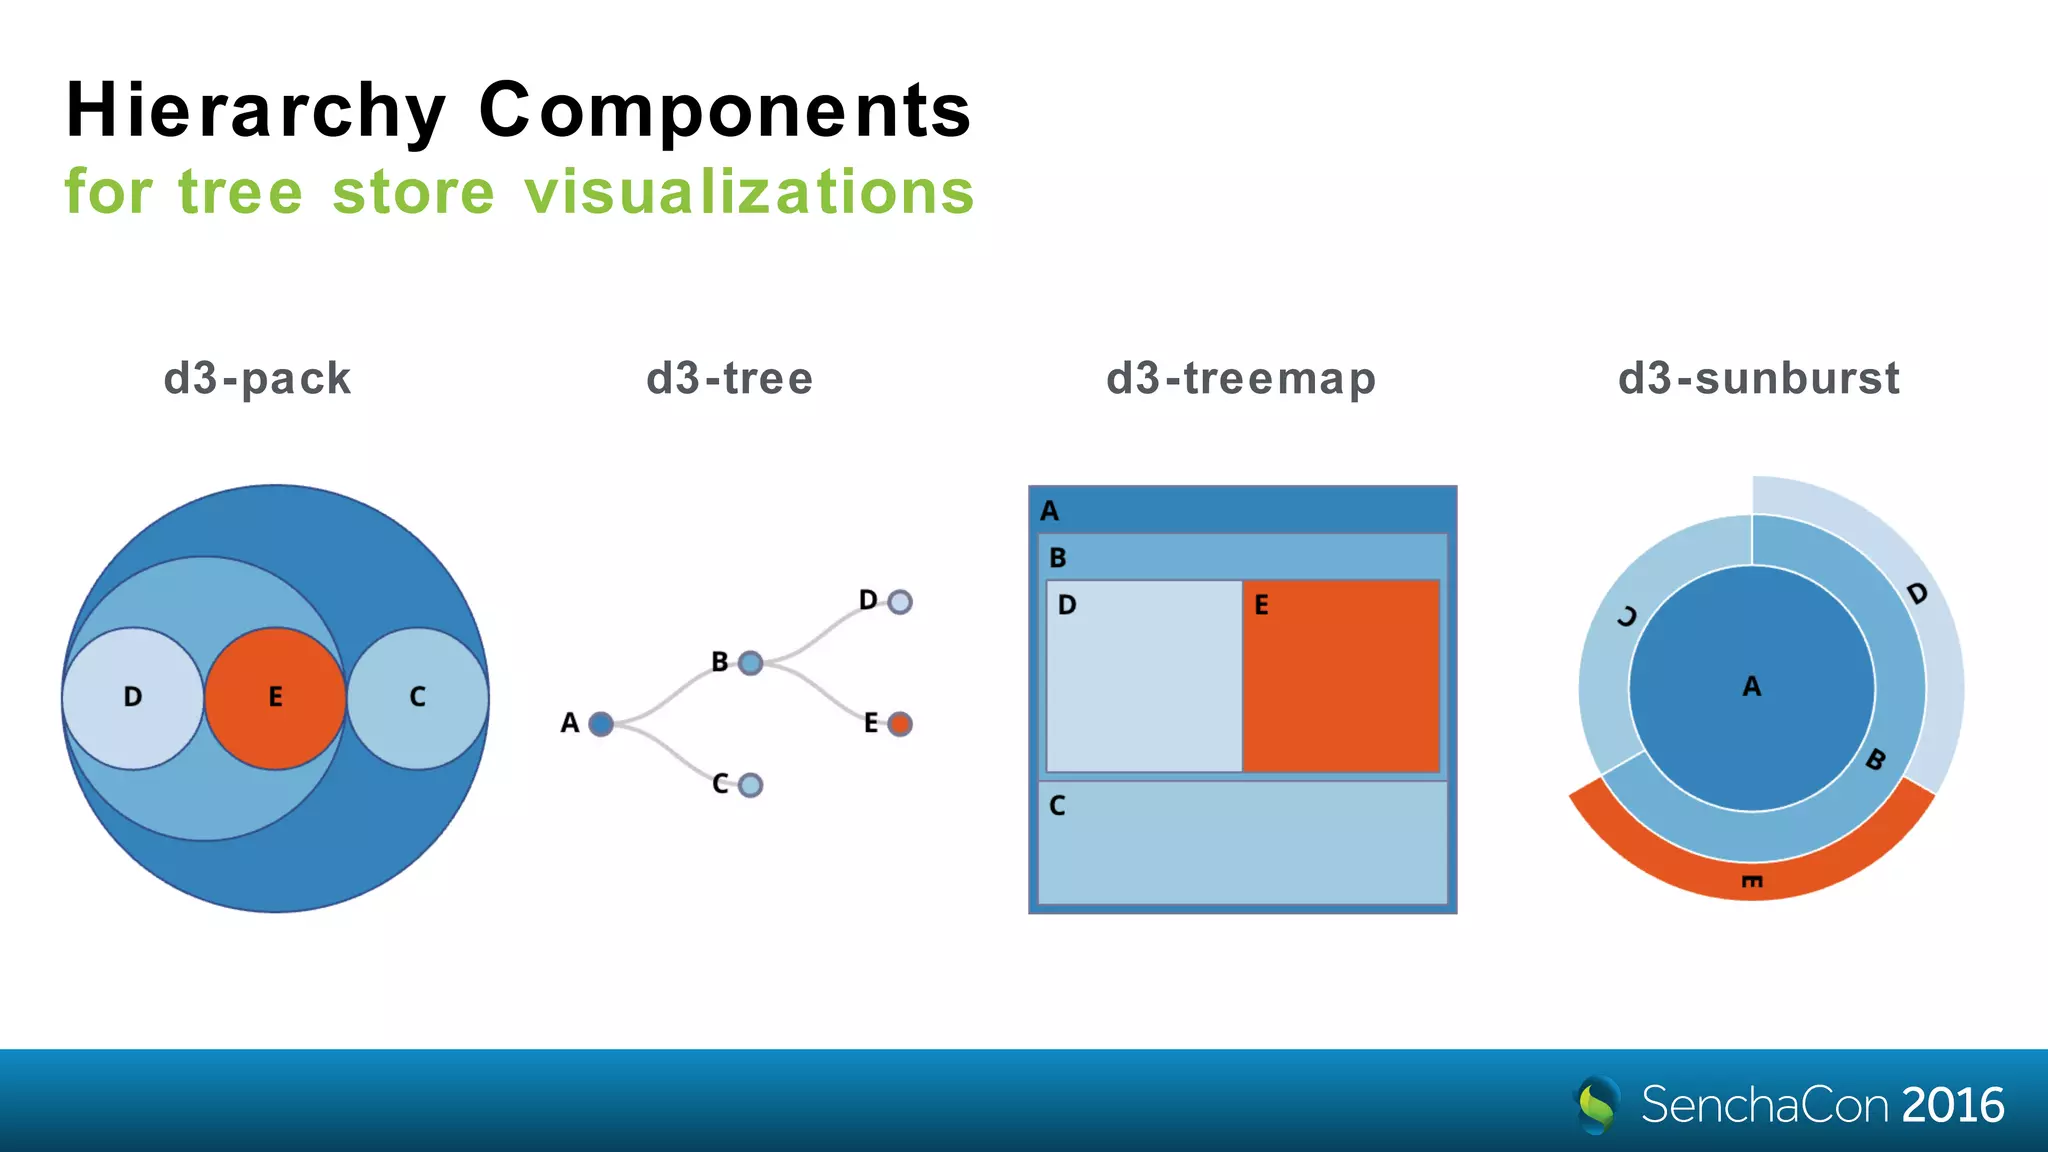
![Data
Binding
viewModel: vm,
defaults: {
bind: {
store: '{letters}',
selection: '{selection}',
},
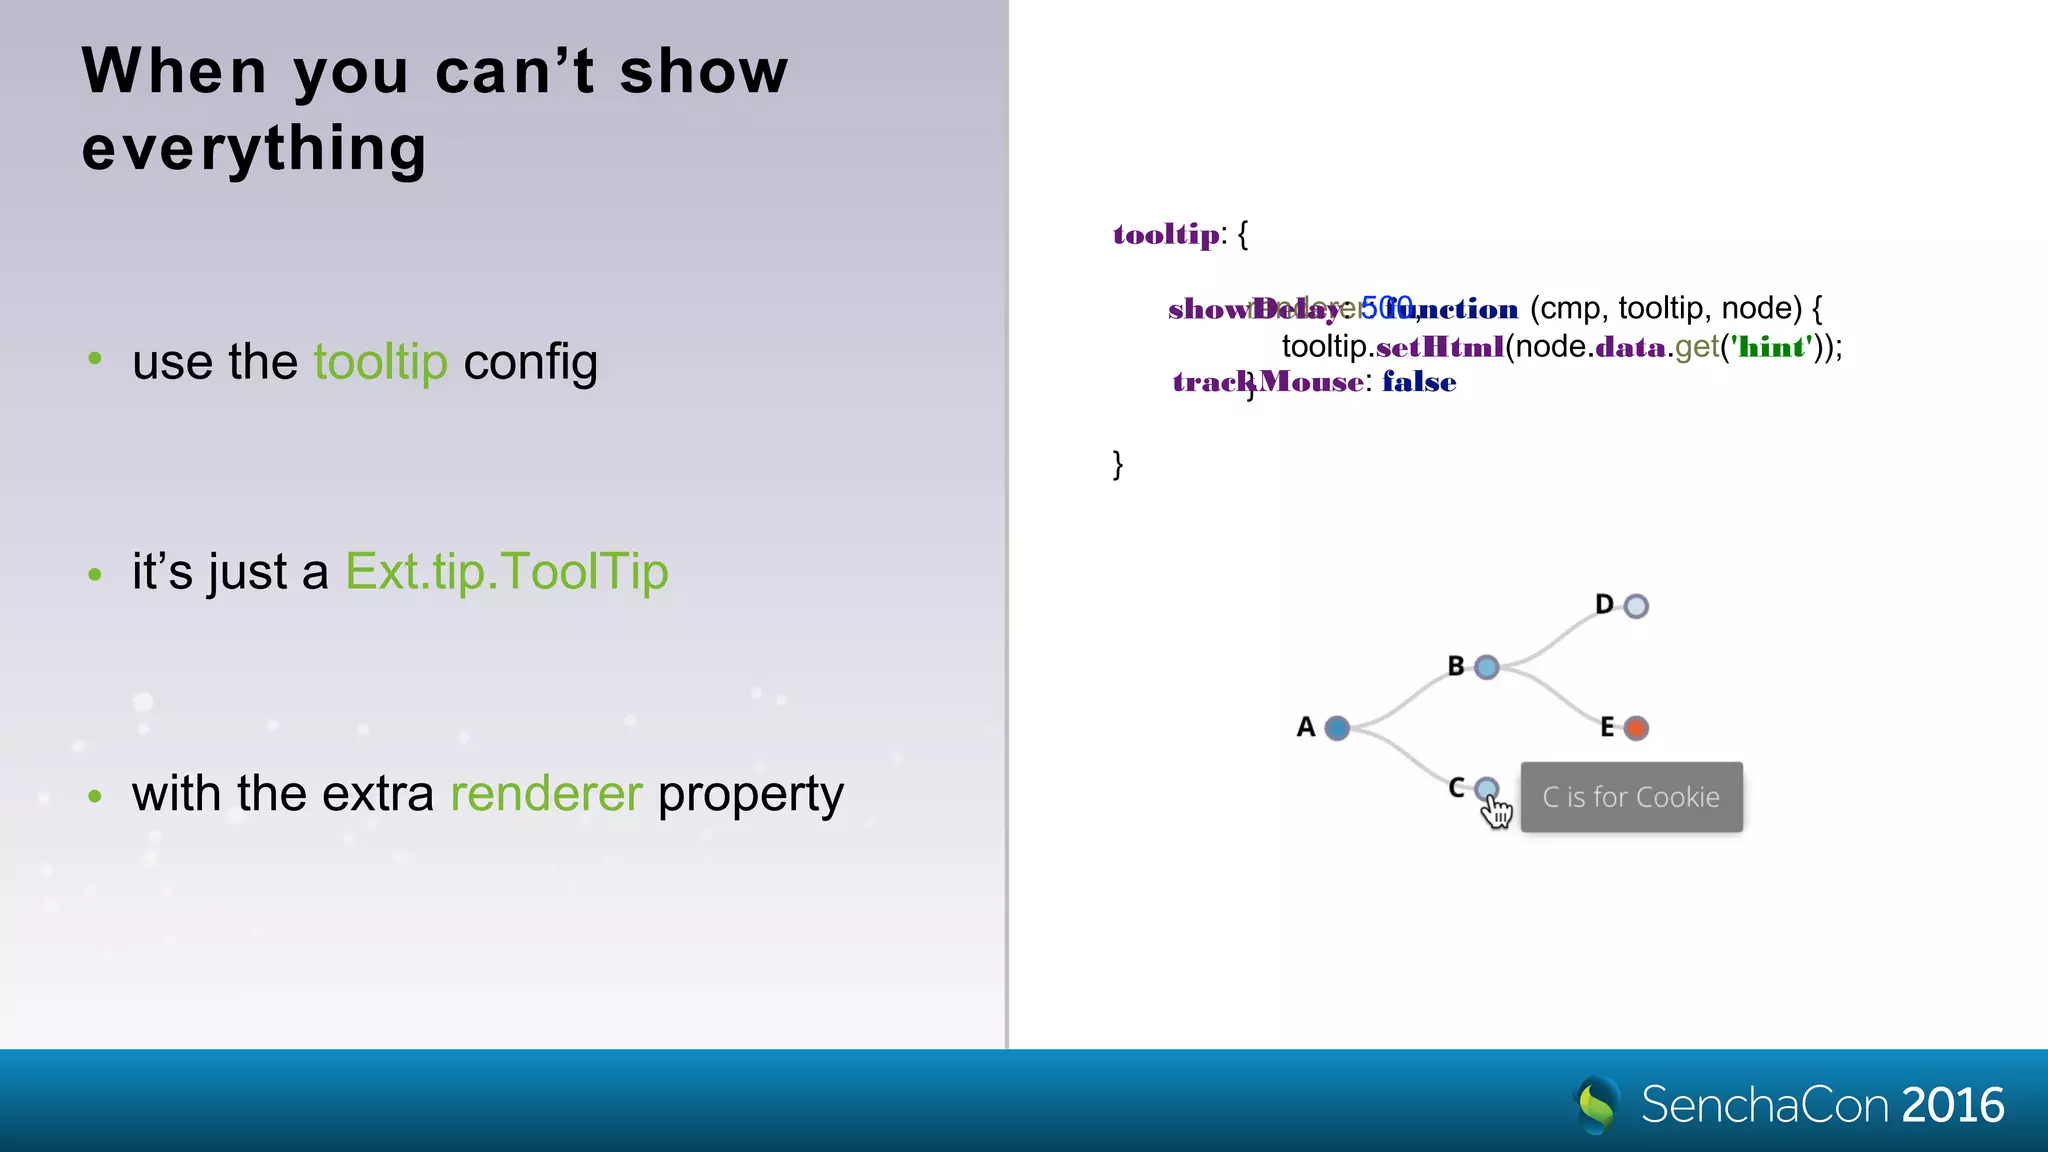
tooltip: {
renderer: function (component, tooltip, node, element) {
tooltip.setHtml(node.data.get('hint'));
}
}
},
items: [
{ xtype: 'd3-tree' },
{ xtype: 'd3-pack' },
{ xtype: 'd3-treemap' },
{ xtype: 'd3-sunburst' }
]](https://image.slidesharecdn.com/vitaly-addmagictoyourextjsapps-161206022457/75/SenchaCon-2016-Add-Magic-to-Your-Ext-JS-Apps-with-D3-Visualizations-Vitaly-Kravchenko-10-2048.jpg)

![Make the size
matter!
{
xtype: 'd3-treemap',
bind: {
store: '{letters}'
},
rootVisible: false,
nodeValue: 'frequency'
}
[{
name: 'A',
frequency: 8.167
}, {
name: 'B',
frequency: 1.492
}, {
name: 'C',
frequency: 2.782
}, {
name: 'D',
frequency: 4.253
}, {
name: 'E',
frequency: 12.702
}]
{
xtype: 'd3-treemap',
bind: {
store: '{letters}'
},
rootVisible: false,
nodeValue: 1 // default
}](https://image.slidesharecdn.com/vitaly-addmagictoyourextjsapps-161206022457/75/SenchaCon-2016-Add-Magic-to-Your-Ext-JS-Apps-with-D3-Visualizations-Vitaly-Kravchenko-12-2048.jpg)
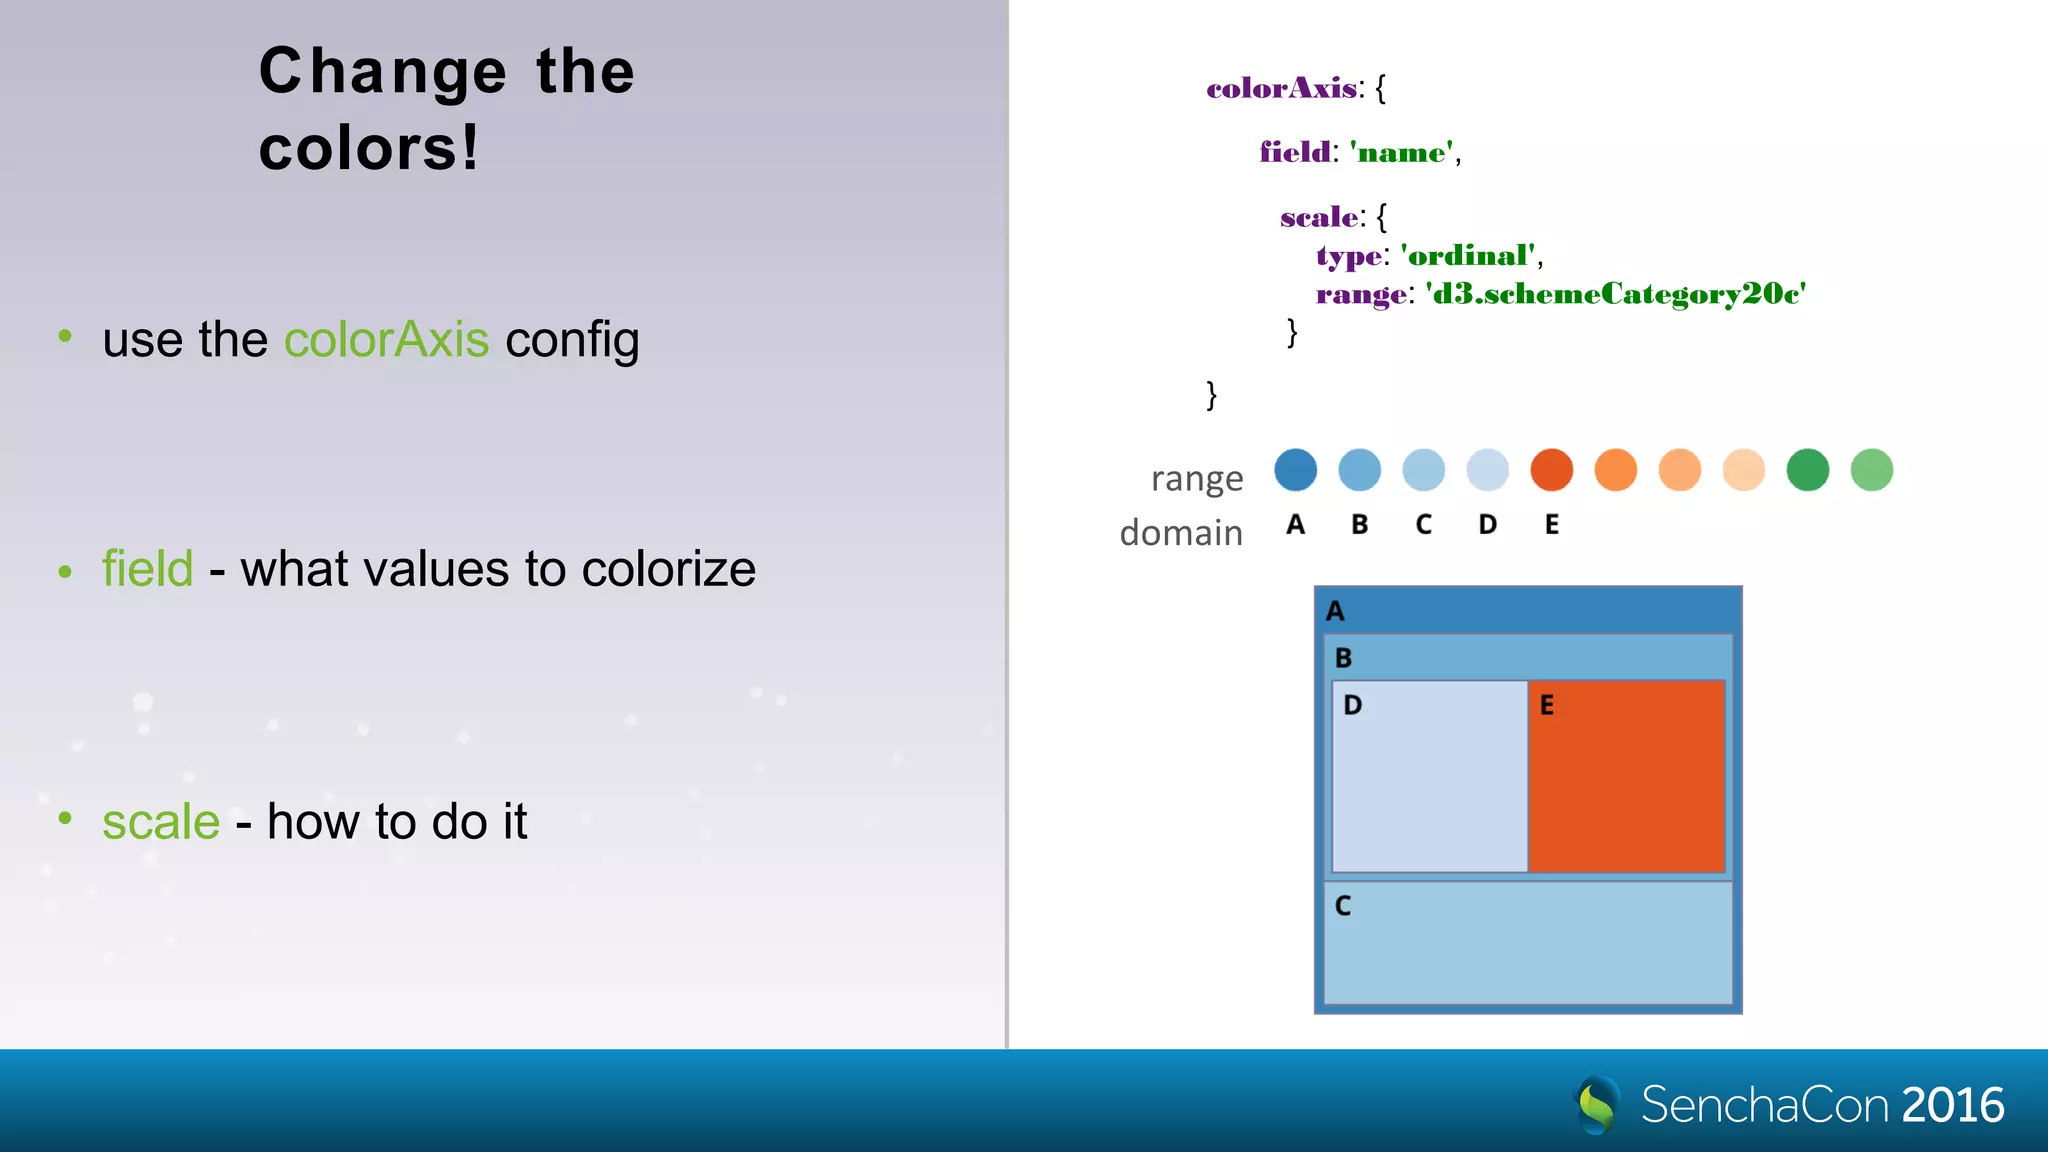
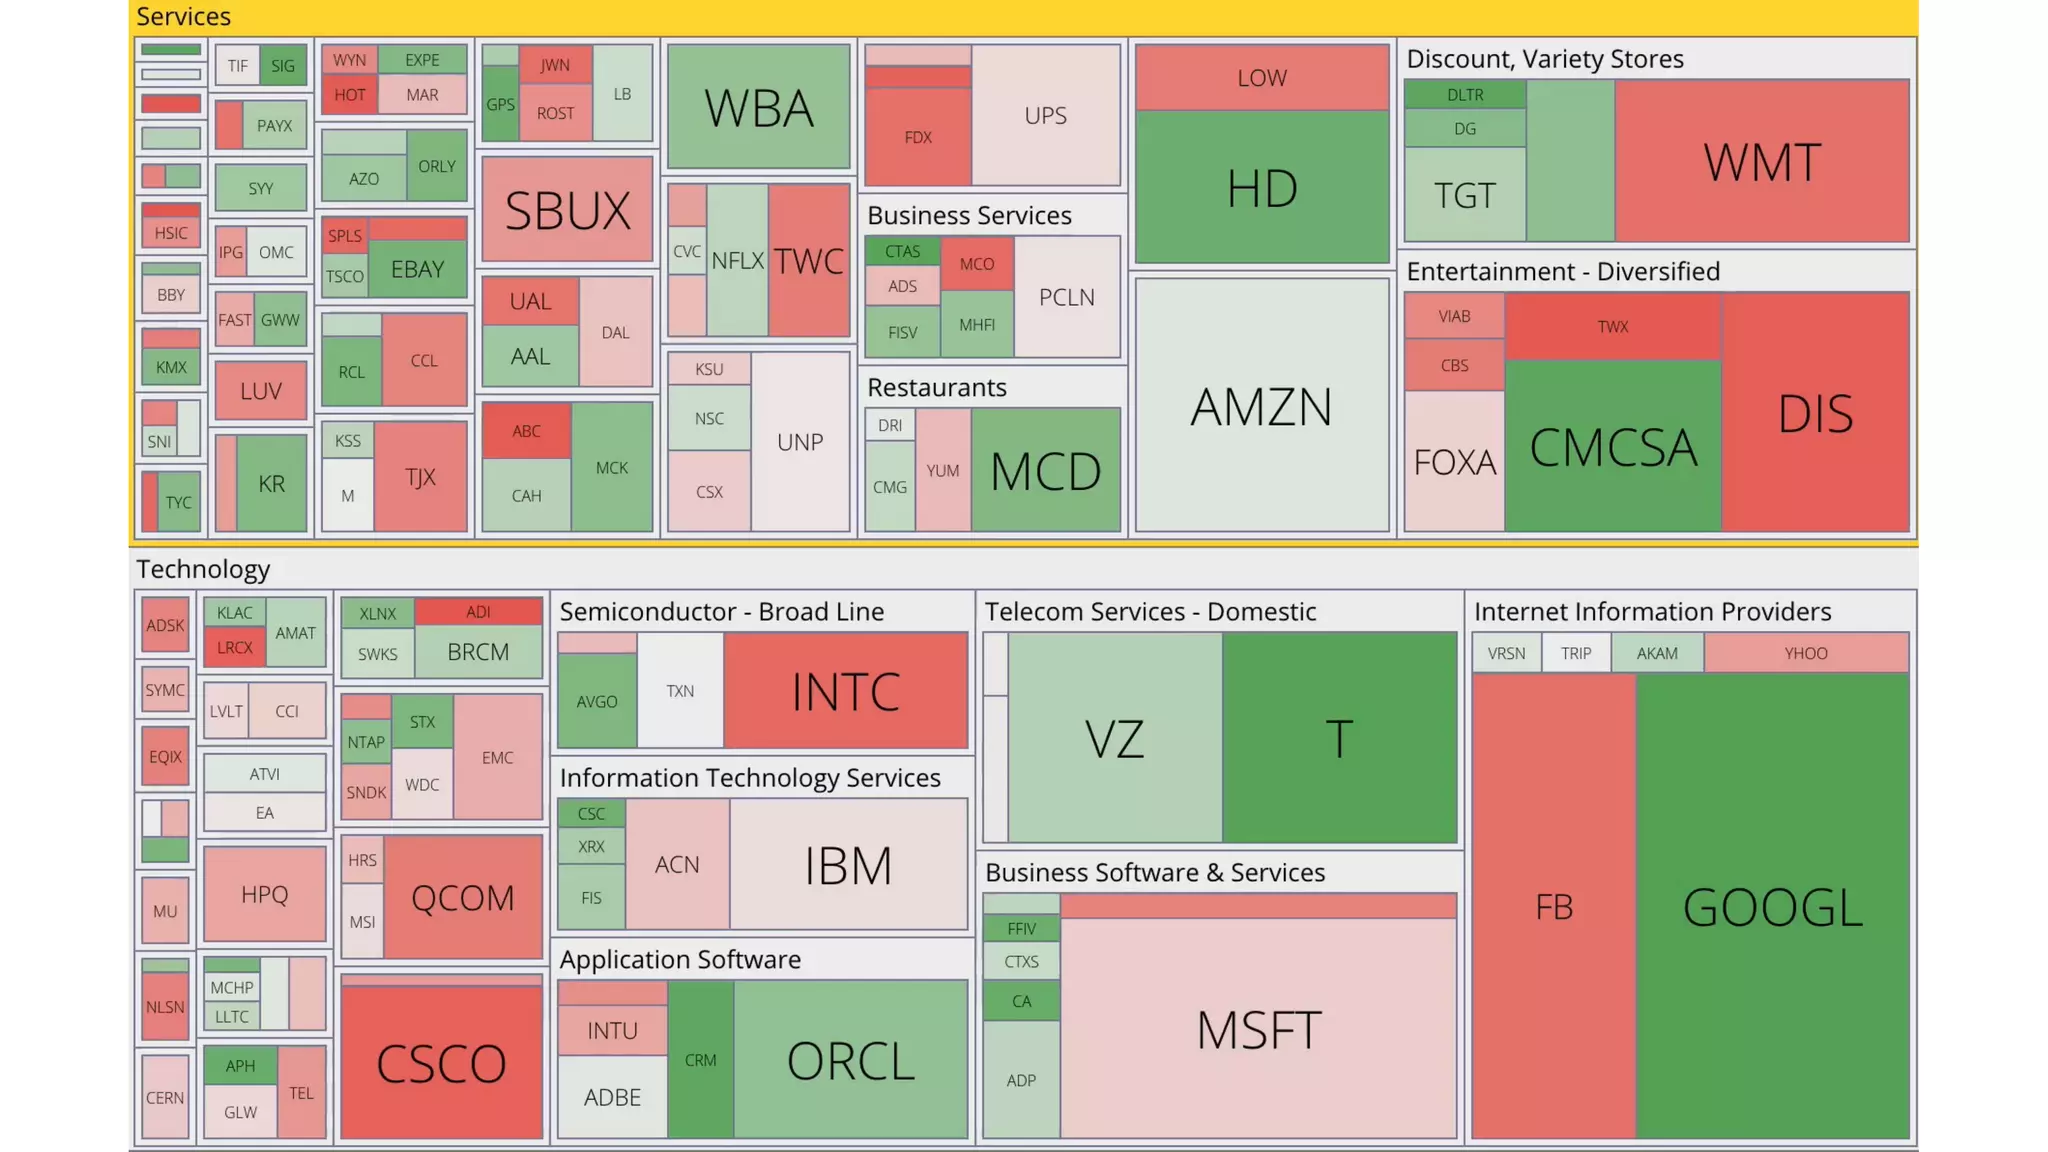
![Flexible coloring
options
• custom scales (e.g. polylinear)
• custom logic
colorAxis: {
field: 'change',
scale: {
type: 'linear',
domain: [ -5, 0, 5 ],
range: ['red', 'lightgray', 'green']
},
processor: function (axis, scale, node, field) {
var record = node.data;
return record.isLeaf()
? scale(record.get(field))
: 'lightgray'; // sector color
}
}](https://image.slidesharecdn.com/vitaly-addmagictoyourextjsapps-161206022457/75/SenchaCon-2016-Add-Magic-to-Your-Ext-JS-Apps-with-D3-Visualizations-Vitaly-Kravchenko-15-2048.jpg)

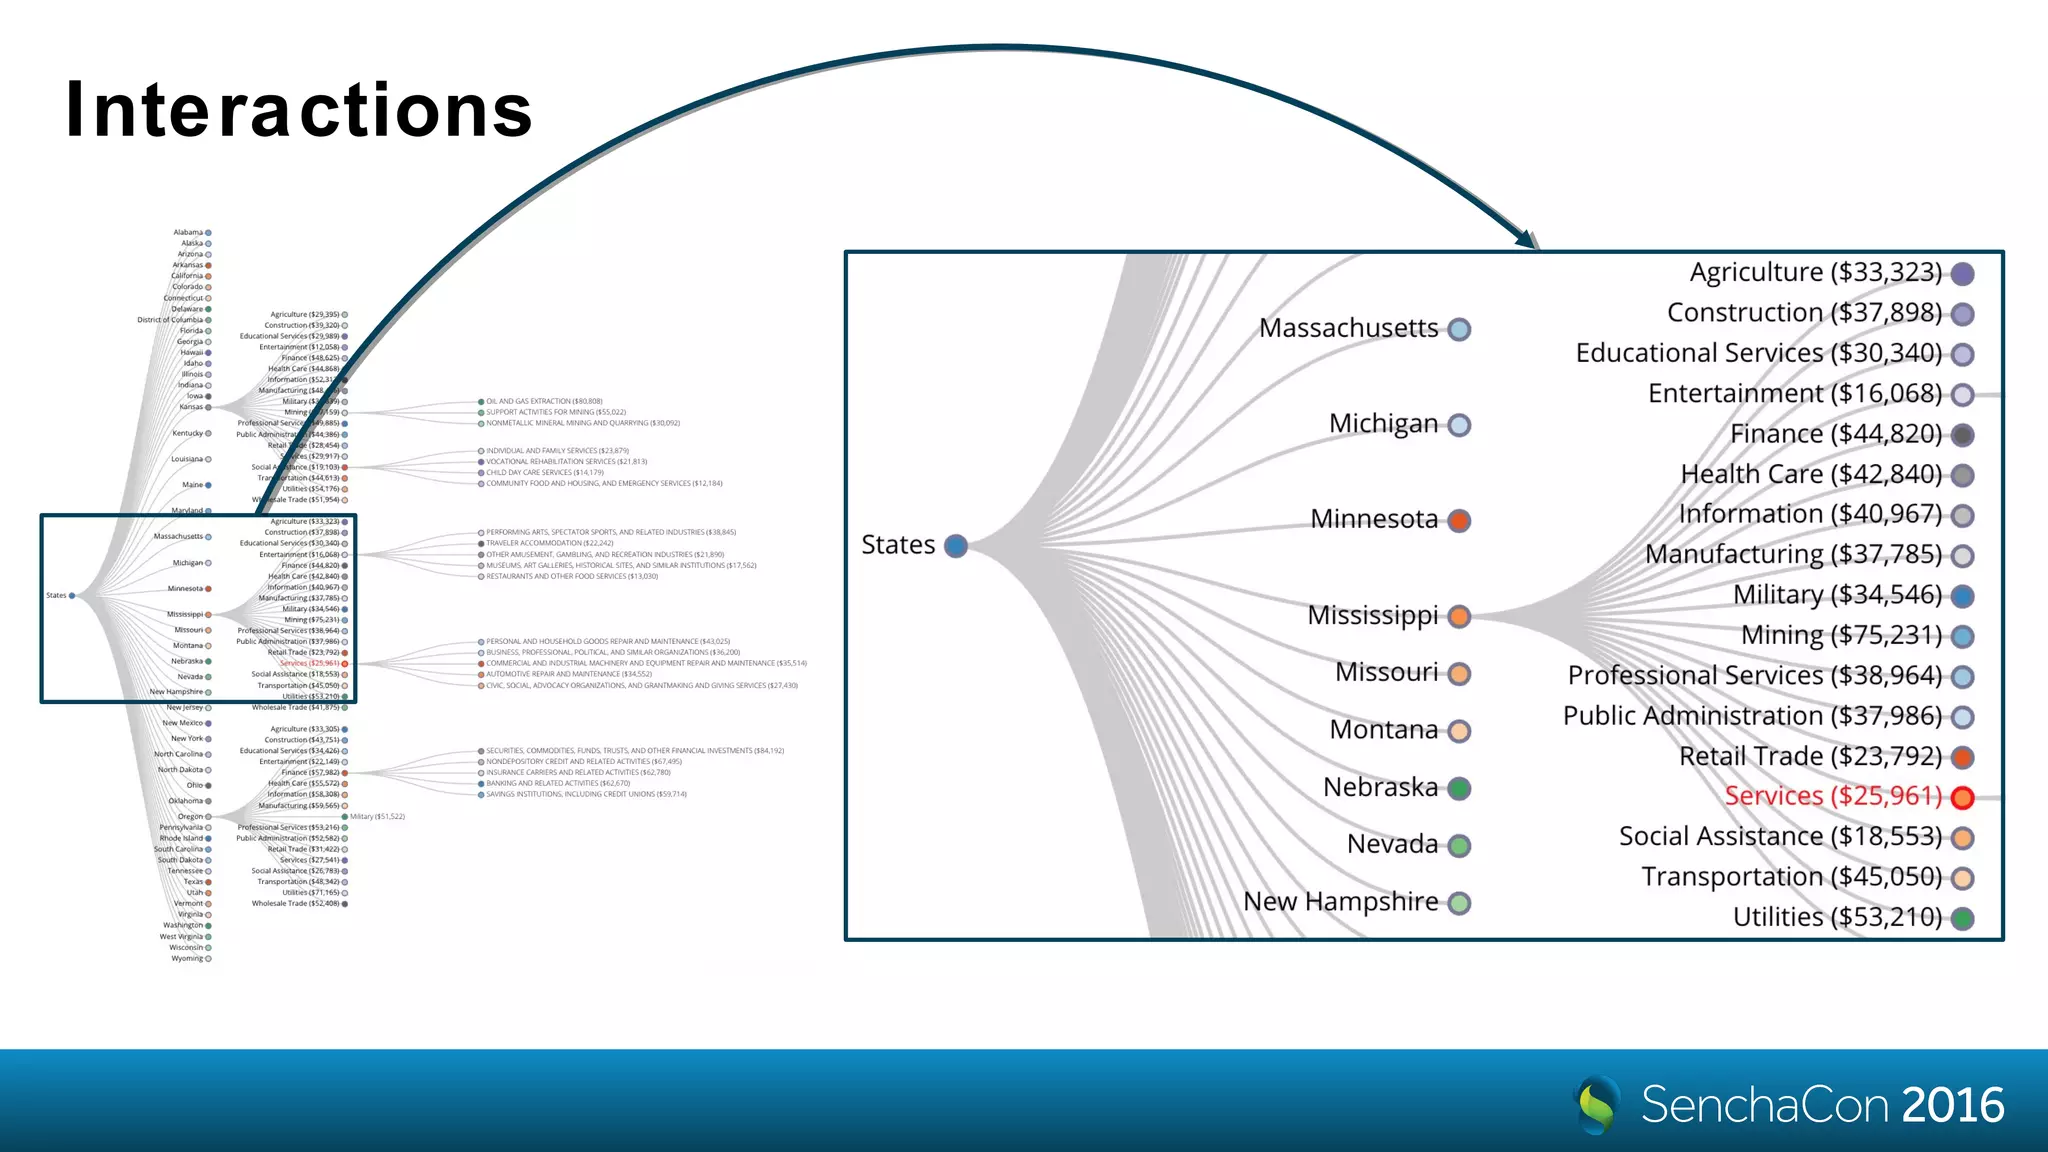
![panzoom
interaction
• it’s like zoom behavior with extras
• plays nice with Ext event/gesture
system
• kinetic scrolling
• constraints, elastic borders
• scroll indicators
interactions: {
type: 'panzoom'
}
pan: {
gesture: 'drag',
constrain: true,
momentum: {
friction: 1,
spring: 0.2
}
},
zoom: {
gesture: 'pinch',
extent: [1, 3],
uniform: true,
mouseWheel: {
factor: 1.02
},
doubleTap: {
factor: 1.1
}
}](https://image.slidesharecdn.com/vitaly-addmagictoyourextjsapps-161206022457/75/SenchaCon-2016-Add-Magic-to-Your-Ext-JS-Apps-with-D3-Visualizations-Vitaly-Kravchenko-20-2048.jpg)
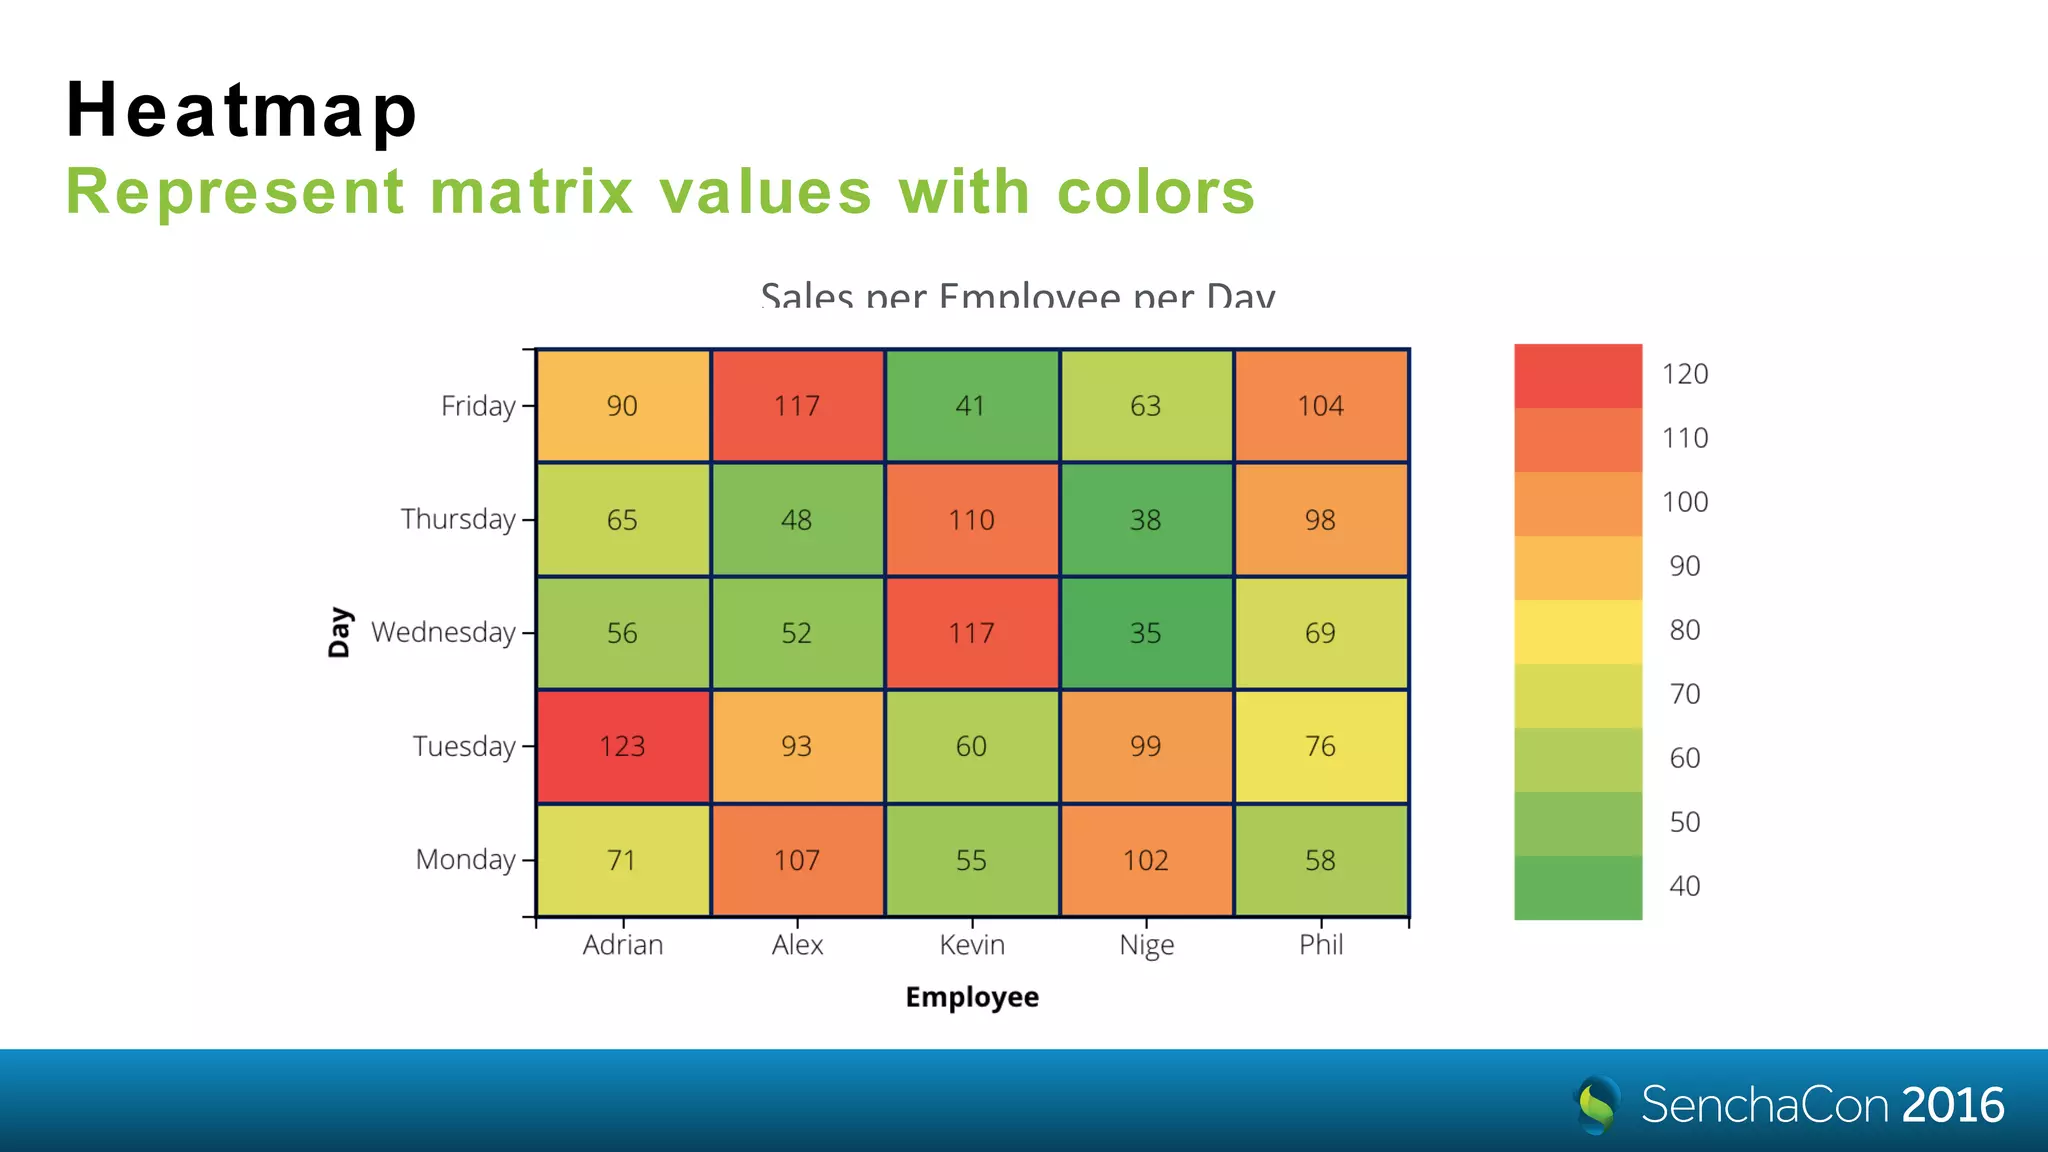
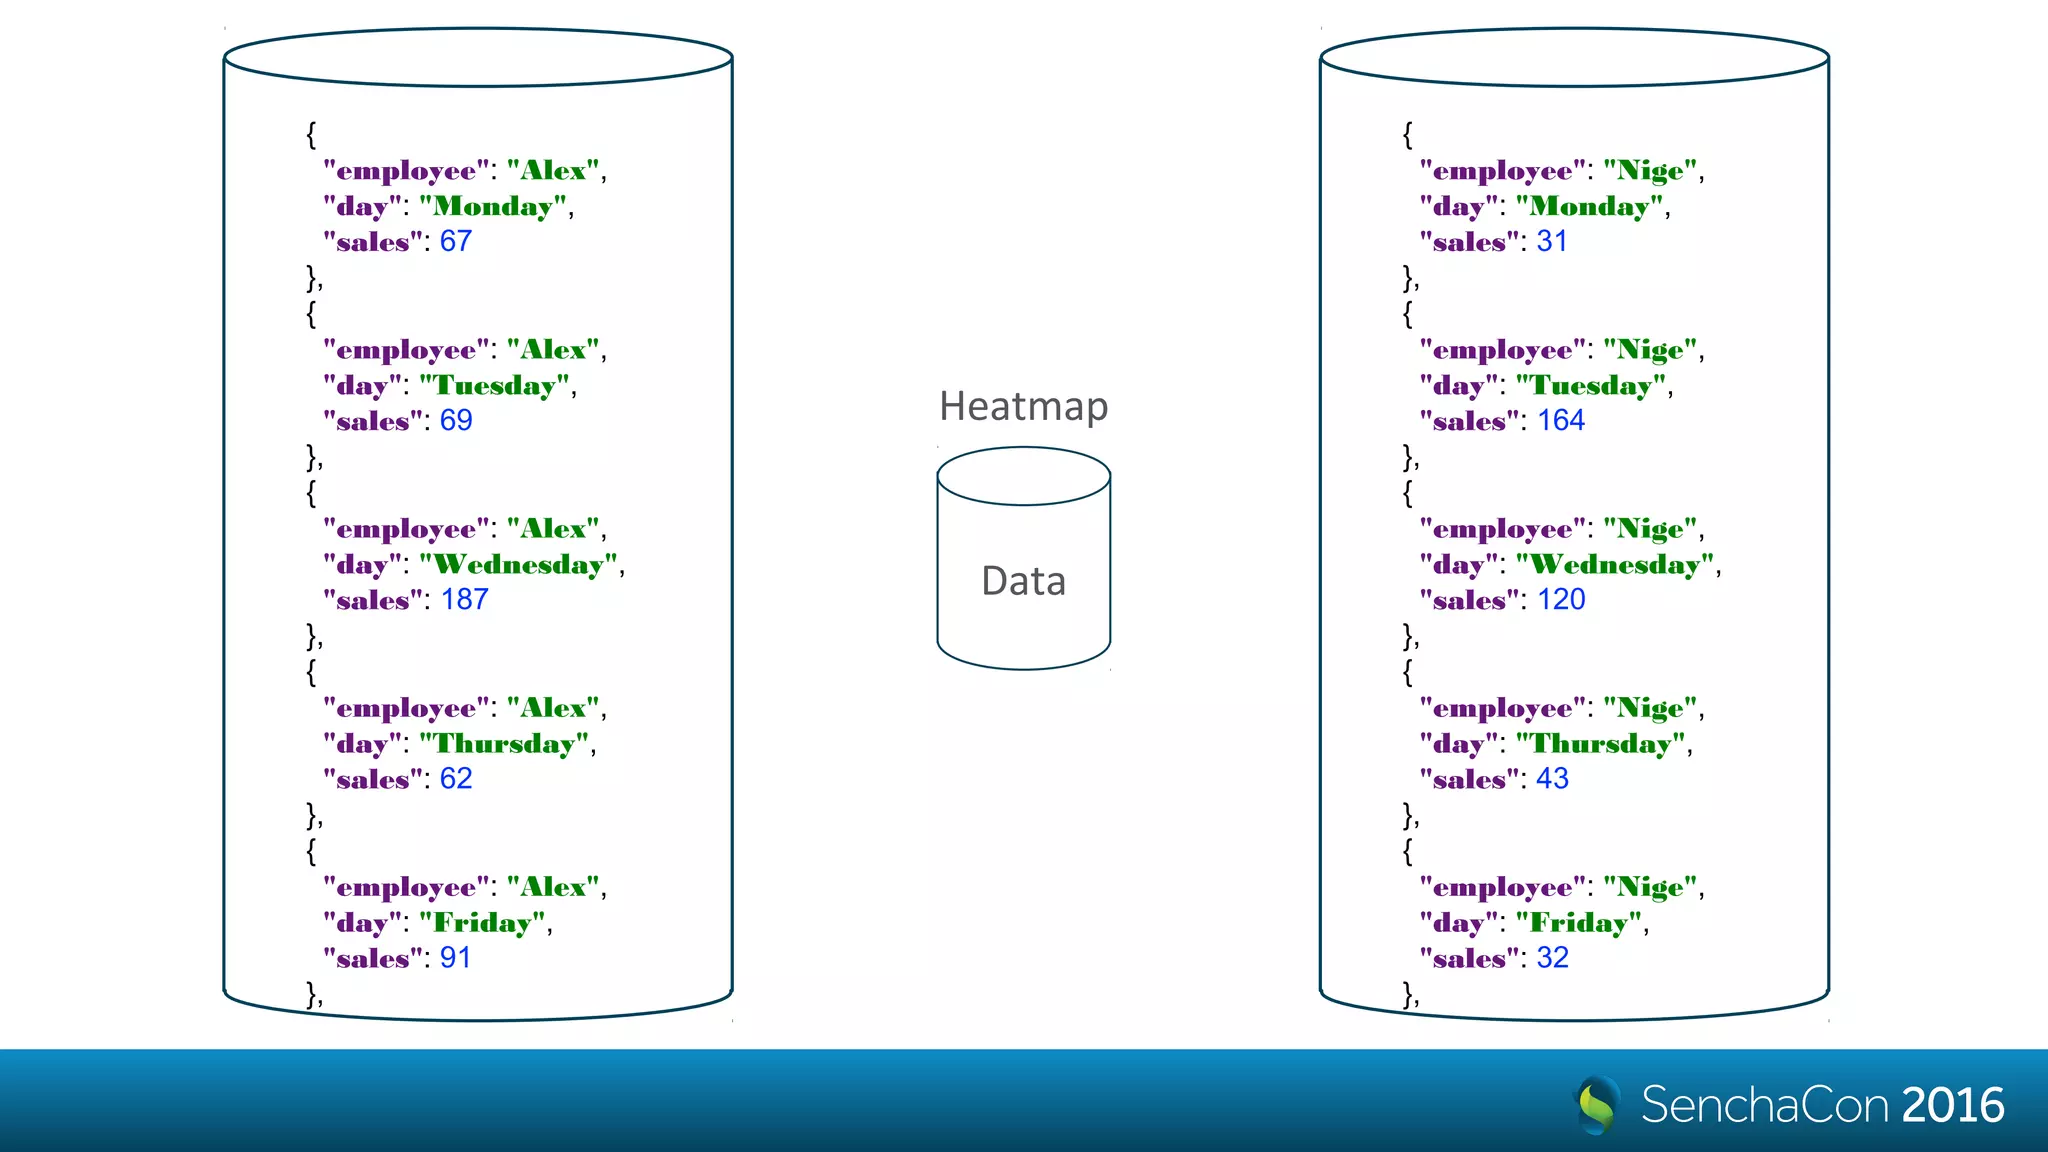
![Heatmap definition
colorAxis: {
field: 'sales',
scale: {
type: 'linear',
range: [
'green’,
'yellow',
'red'
]
}
}
Colors
tiles: {
attr: {
'stroke': 'darkblue',
'stroke-width': 2
}
}
Styles](https://image.slidesharecdn.com/vitaly-addmagictoyourextjsapps-161206022457/75/SenchaCon-2016-Add-Magic-to-Your-Ext-JS-Apps-with-D3-Visualizations-Vitaly-Kravchenko-25-2048.jpg)


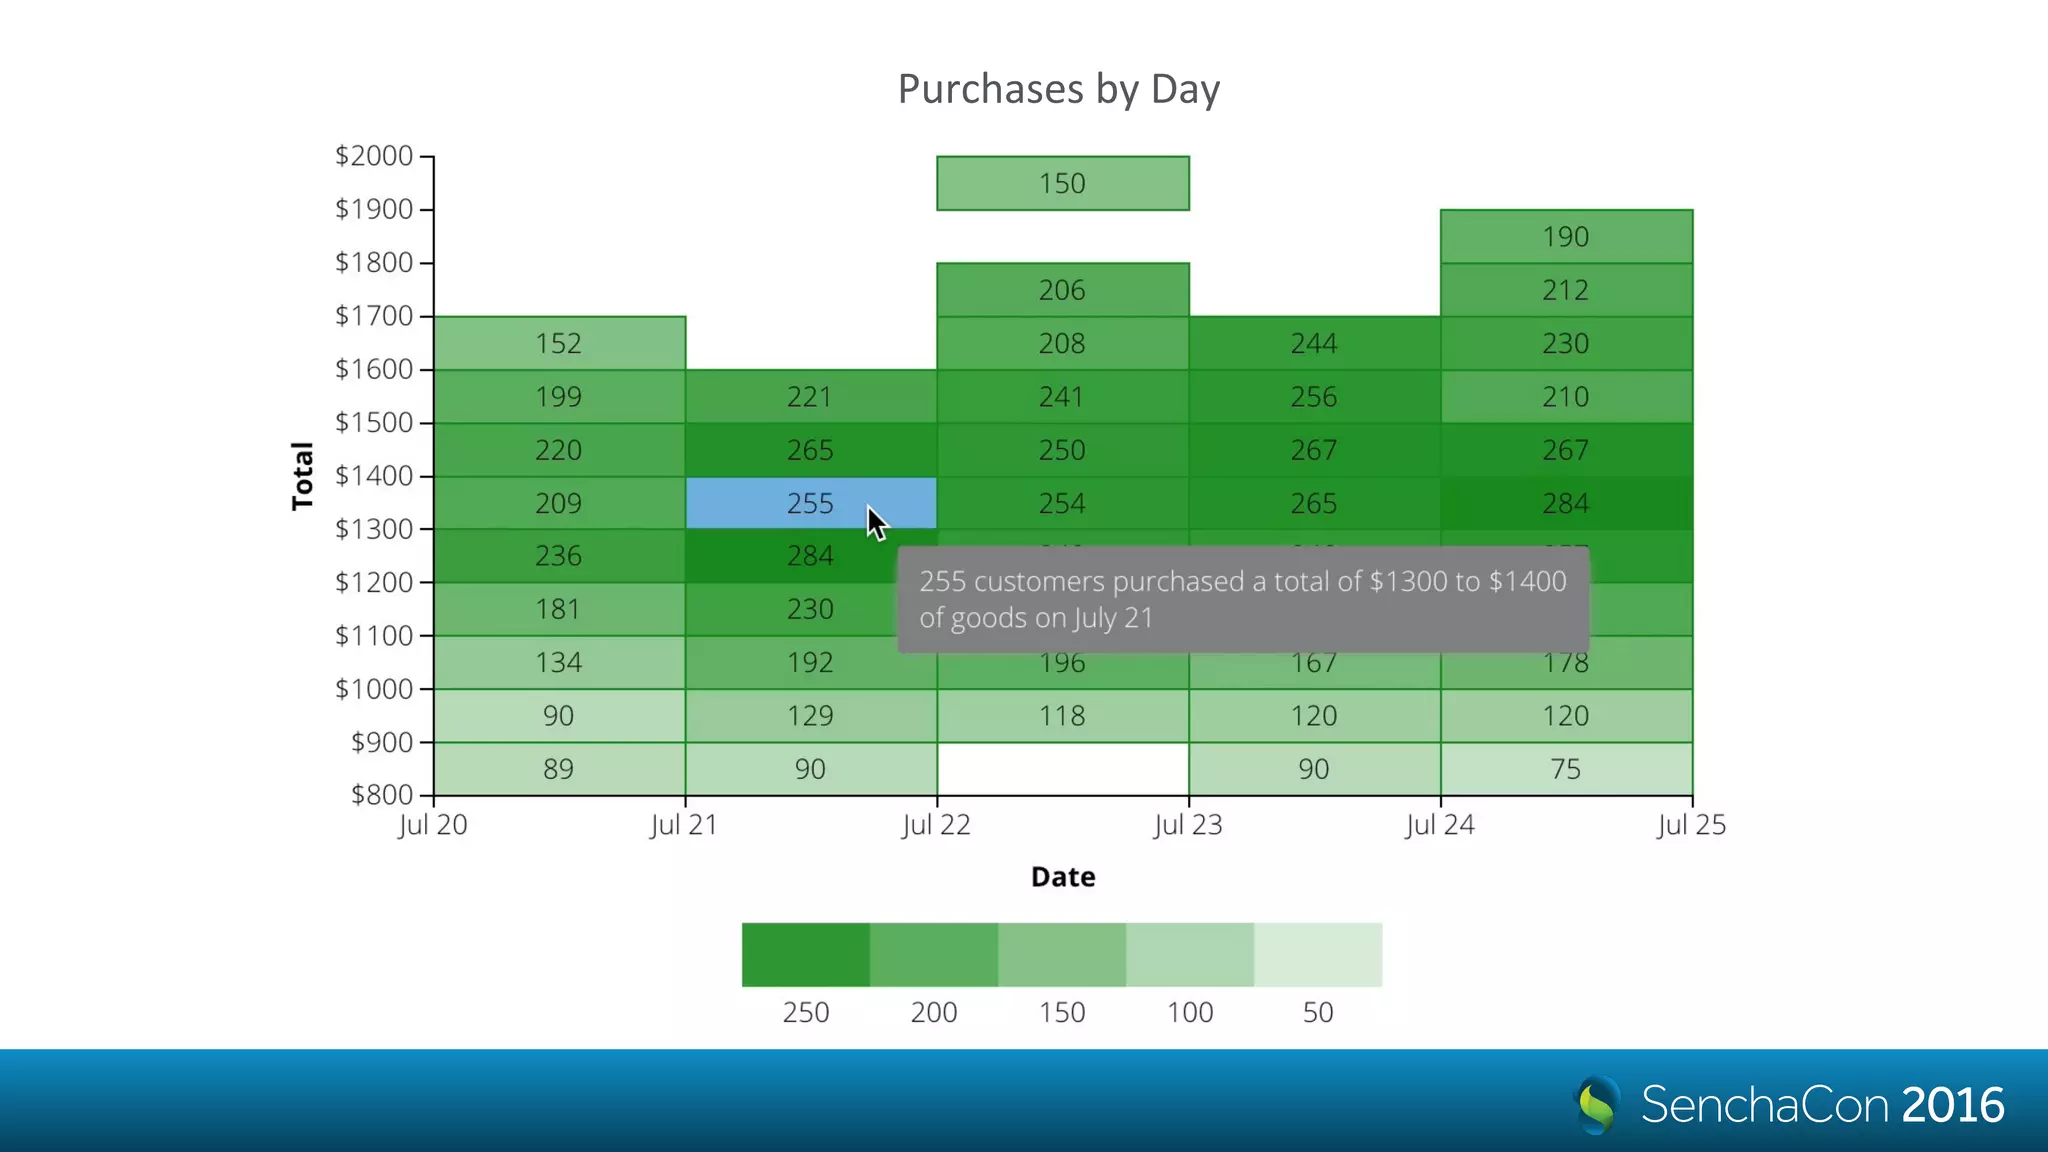
![Heatmap definition
colorAxis: {
field: 'count',
scale: {
type: 'linear',
range: ['white', 'green']
},
minimum: 0
}
Colors
tiles: {
attr: {
'stroke': 'green',
'stroke-width': 1
}
}
Styles](https://image.slidesharecdn.com/vitaly-addmagictoyourextjsapps-161206022457/75/SenchaCon-2016-Add-Magic-to-Your-Ext-JS-Apps-with-D3-Visualizations-Vitaly-Kravchenko-35-2048.jpg)
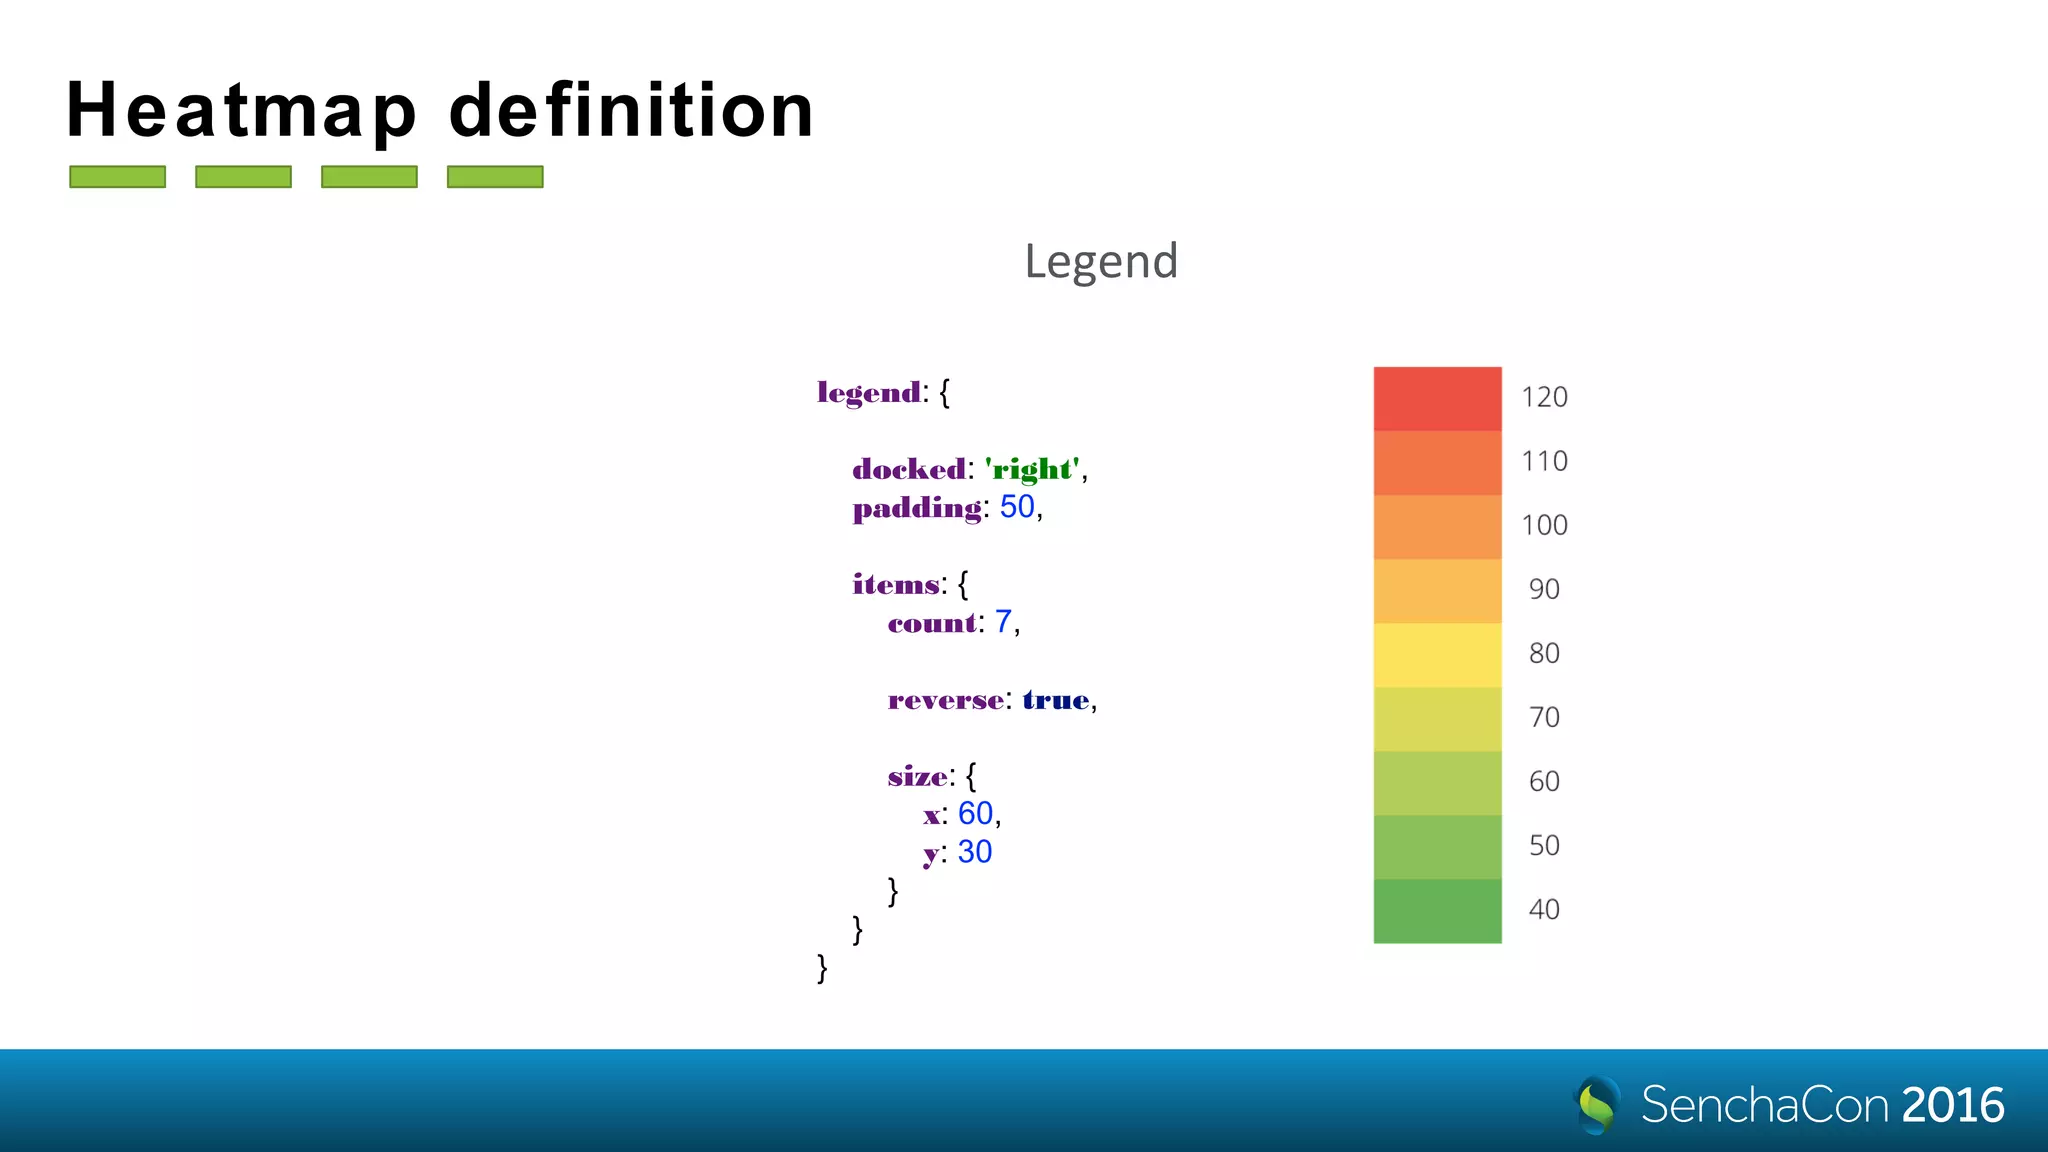
![Heatmap definition
legend: {
docked: 'bottom',
padding: 60,
items: {
count: 7,
slice: [1],
reverse: true,
size: {
x: 60,
y: 30
}
}
}
Legend](https://image.slidesharecdn.com/vitaly-addmagictoyourextjsapps-161206022457/75/SenchaCon-2016-Add-Magic-to-Your-Ext-JS-Apps-with-D3-Visualizations-Vitaly-Kravchenko-36-2048.jpg)

![How D3 selections work?
a quick aside
d3.select('body') // a selection (a transient object that holds the 'body' element)
d3.select('body').selectAll('div') // a selection of all 'div' elements in the body
// joining data with selected 'div' elements:
var update = d3.select('body').selectAll('div').data([0, 1, 2, 3, 4])
// existing DOM elements in the selection
// for which no new datum was found:
update.exit()
// a selection of successfully updated DOM elements:
update
// a selection with placeholder nodes
// for data that has no corresponding DOM elements:
update.enter()
update.enter().append('div')
<div>.__data__ = 0
<div>.__data__ = 1
...
<div>.__data__ = 4](https://image.slidesharecdn.com/vitaly-addmagictoyourextjsapps-161206022457/75/SenchaCon-2016-Add-Magic-to-Your-Ext-JS-Apps-with-D3-Visualizations-Vitaly-Kravchenko-40-2048.jpg)

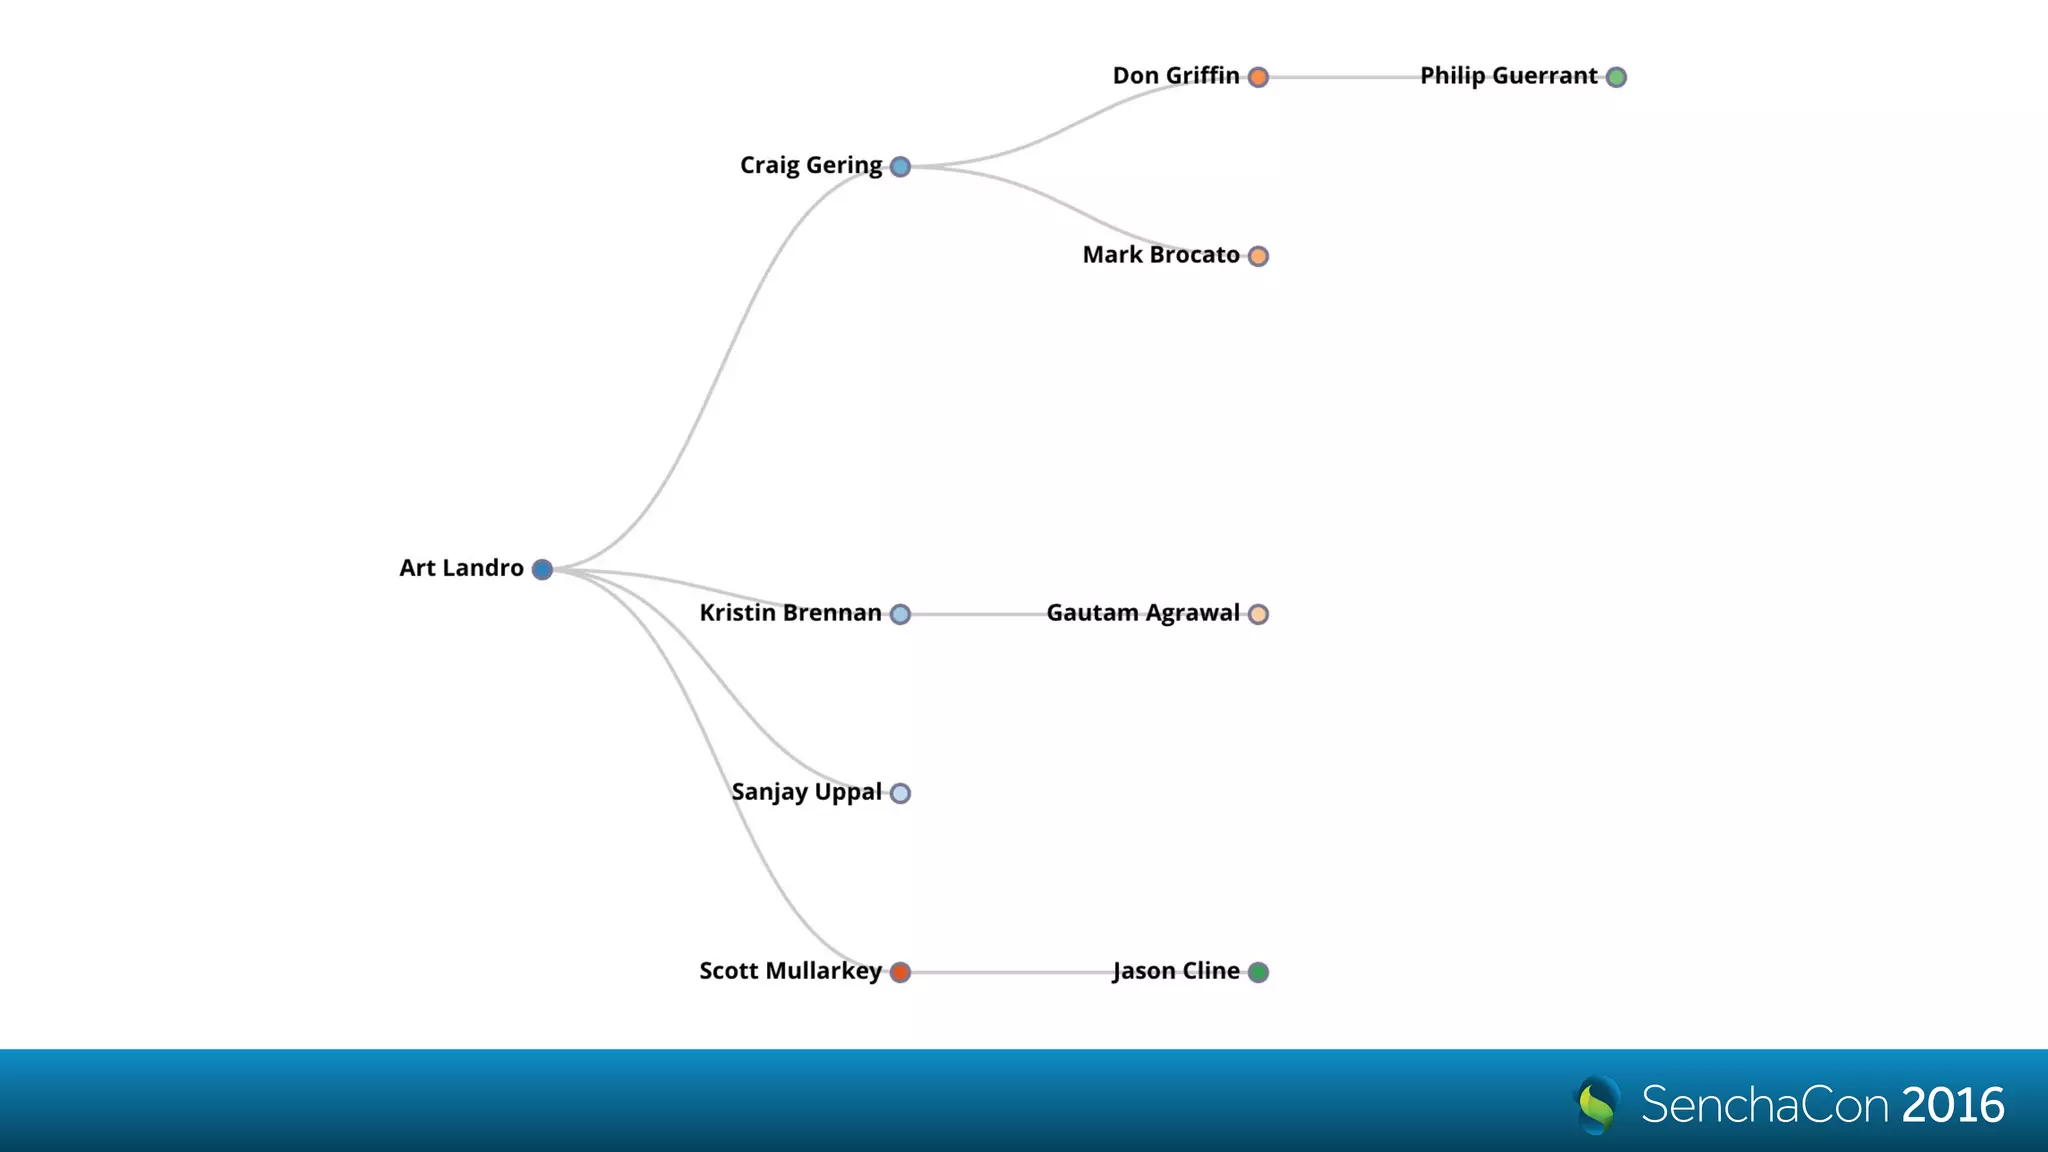
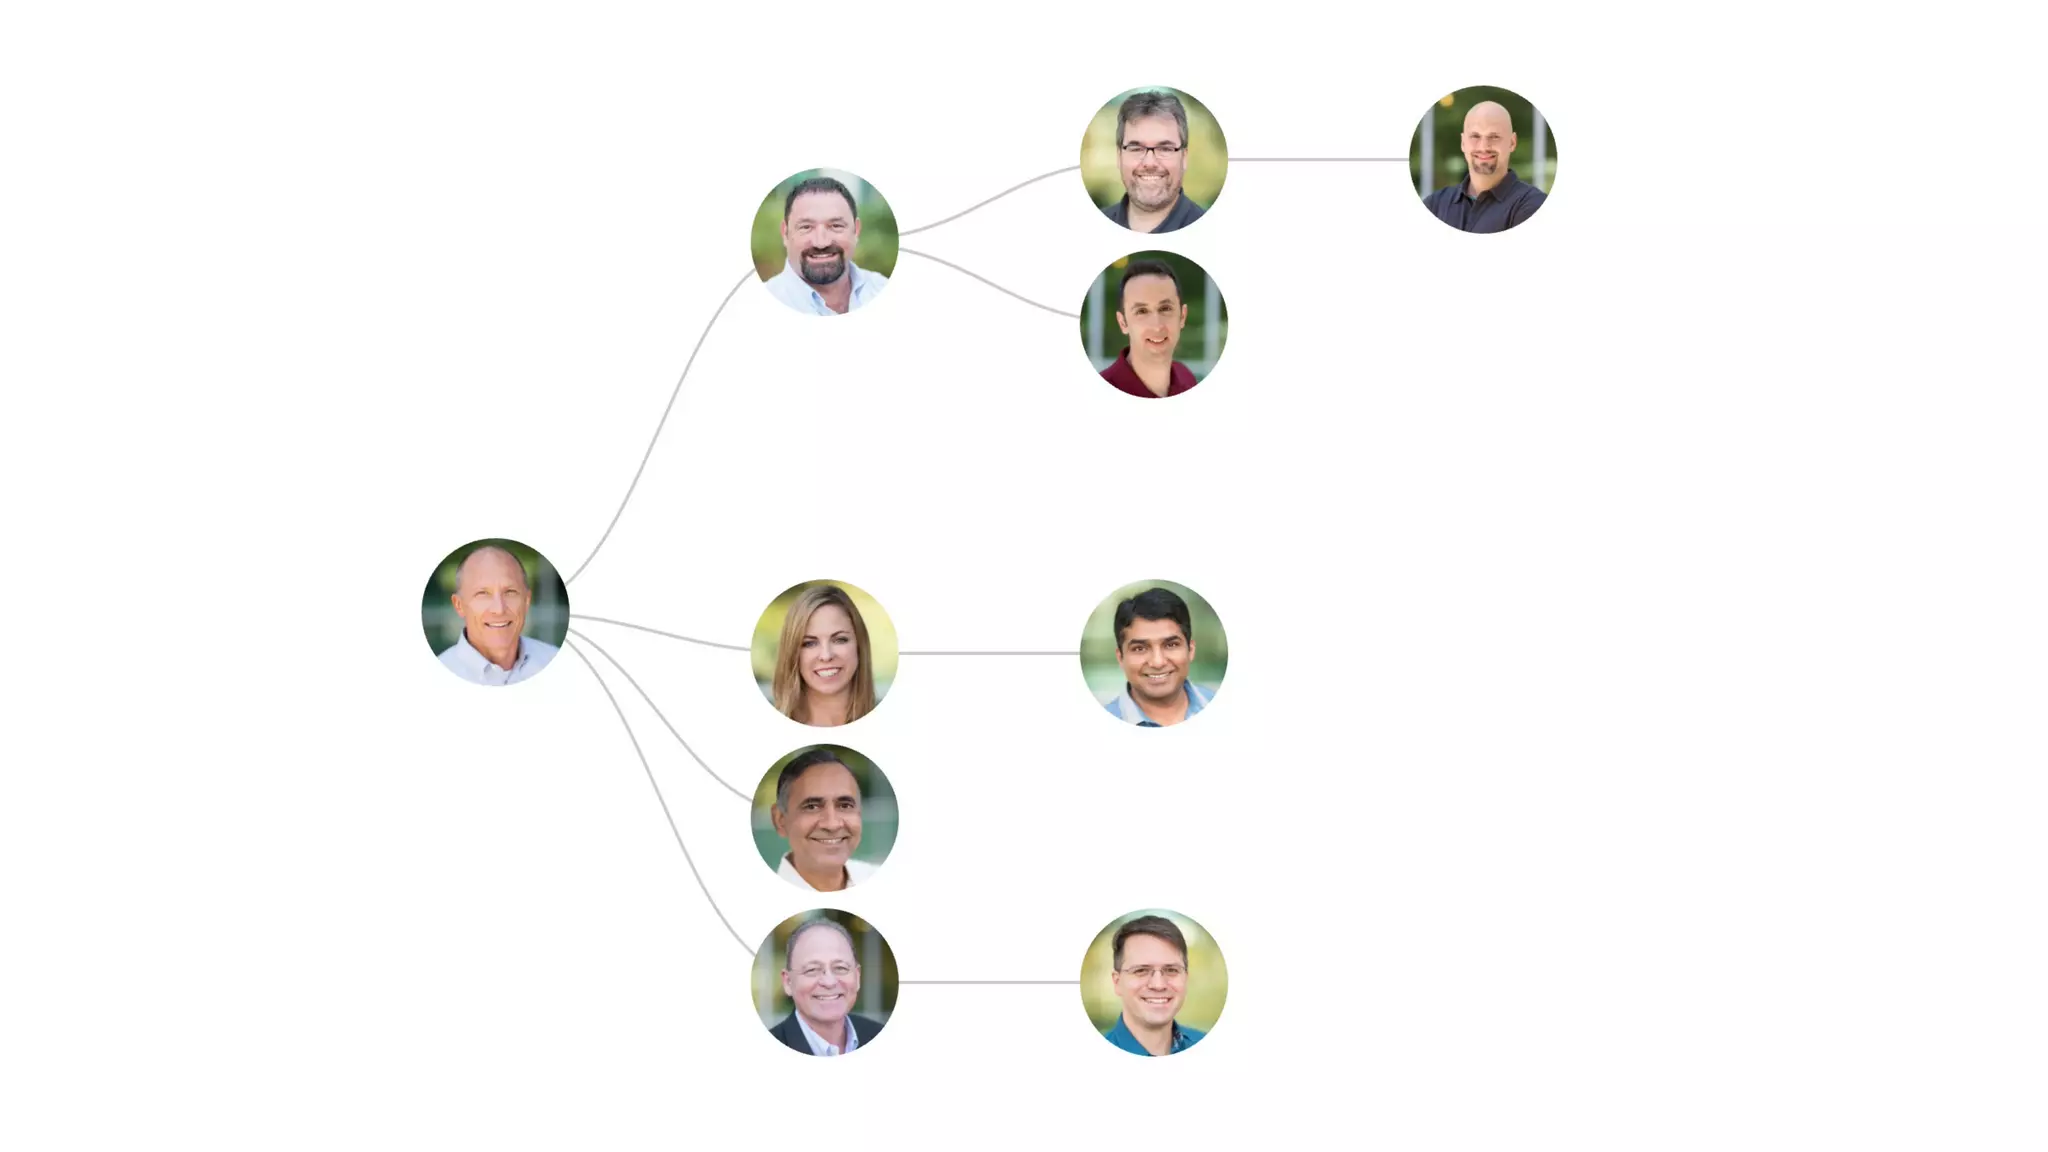
![{
name: 'Art Landro’,
url: '1.jpg',
children: [
{
name: 'Craig Gering',
url: '4.jpg',
},
...
{
xtype: 'd3-tree',
nodeSize: [200, 100],
interactions: {
type: 'panzoom',
zoom: {
doubleTap: false
}
},
store: {
root: data
}
}
Subclassing
let’s create an org chart](https://image.slidesharecdn.com/vitaly-addmagictoyourextjsapps-161206022457/75/SenchaCon-2016-Add-Magic-to-Your-Ext-JS-Apps-with-D3-Visualizations-Vitaly-Kravchenko-42-2048.jpg)


![{
name: 'Art Landro',
url: '1.jpg',
children: [
{
name: 'Craig Gering',
url: '4.jpg',
},
...
{
xtype: 'sencha-tree',
nodeSize: [200, 100],
interactions: {
type: 'panzoom',
zoom: {
doubleTap: false
}
},
store: {
root: data
}
}
Swapping the xtype](https://image.slidesharecdn.com/vitaly-addmagictoyourextjsapps-161206022457/75/SenchaCon-2016-Add-Magic-to-Your-Ext-JS-Apps-with-D3-Visualizations-Vitaly-Kravchenko-48-2048.jpg)

![Custom
visualizations
• d3-svg (aliased as d3)
- creates an SVG document for you
- takes care about the size
- responds to store changes
- has a life cycle of a component
onSceneSetup: function (component, scene) {
var data = ['A', 'B', 'C', 'D', ‘E',
'F', 'G', 'H', 'I', ‘J'],
color = d3.scaleOrdinal(d3.schemeCategory20c),
selection = scene.selectAll().data(data).enter(),
position = (d, i) => i * 30;
selection.append('circle')
.attr('fill', d => color(d))
.attr('cx', position)
.attr('r', 10);
selection.append('text')
.text((d, i) => i < 5 ? d : '')
.attr('x', position)
.attr('y', 30)
.attr('text-anchor', 'middle')
.attr('font-weight', 'bold');
}
{
xtype: 'd3',
listeners: {
scenesetup: 'onSceneSetup'
}
}
• d3-canvas - same as d3, but for
Canvas
- resolution independence](https://image.slidesharecdn.com/vitaly-addmagictoyourextjsapps-161206022457/75/SenchaCon-2016-Add-Magic-to-Your-Ext-JS-Apps-with-D3-Visualizations-Vitaly-Kravchenko-51-2048.jpg)


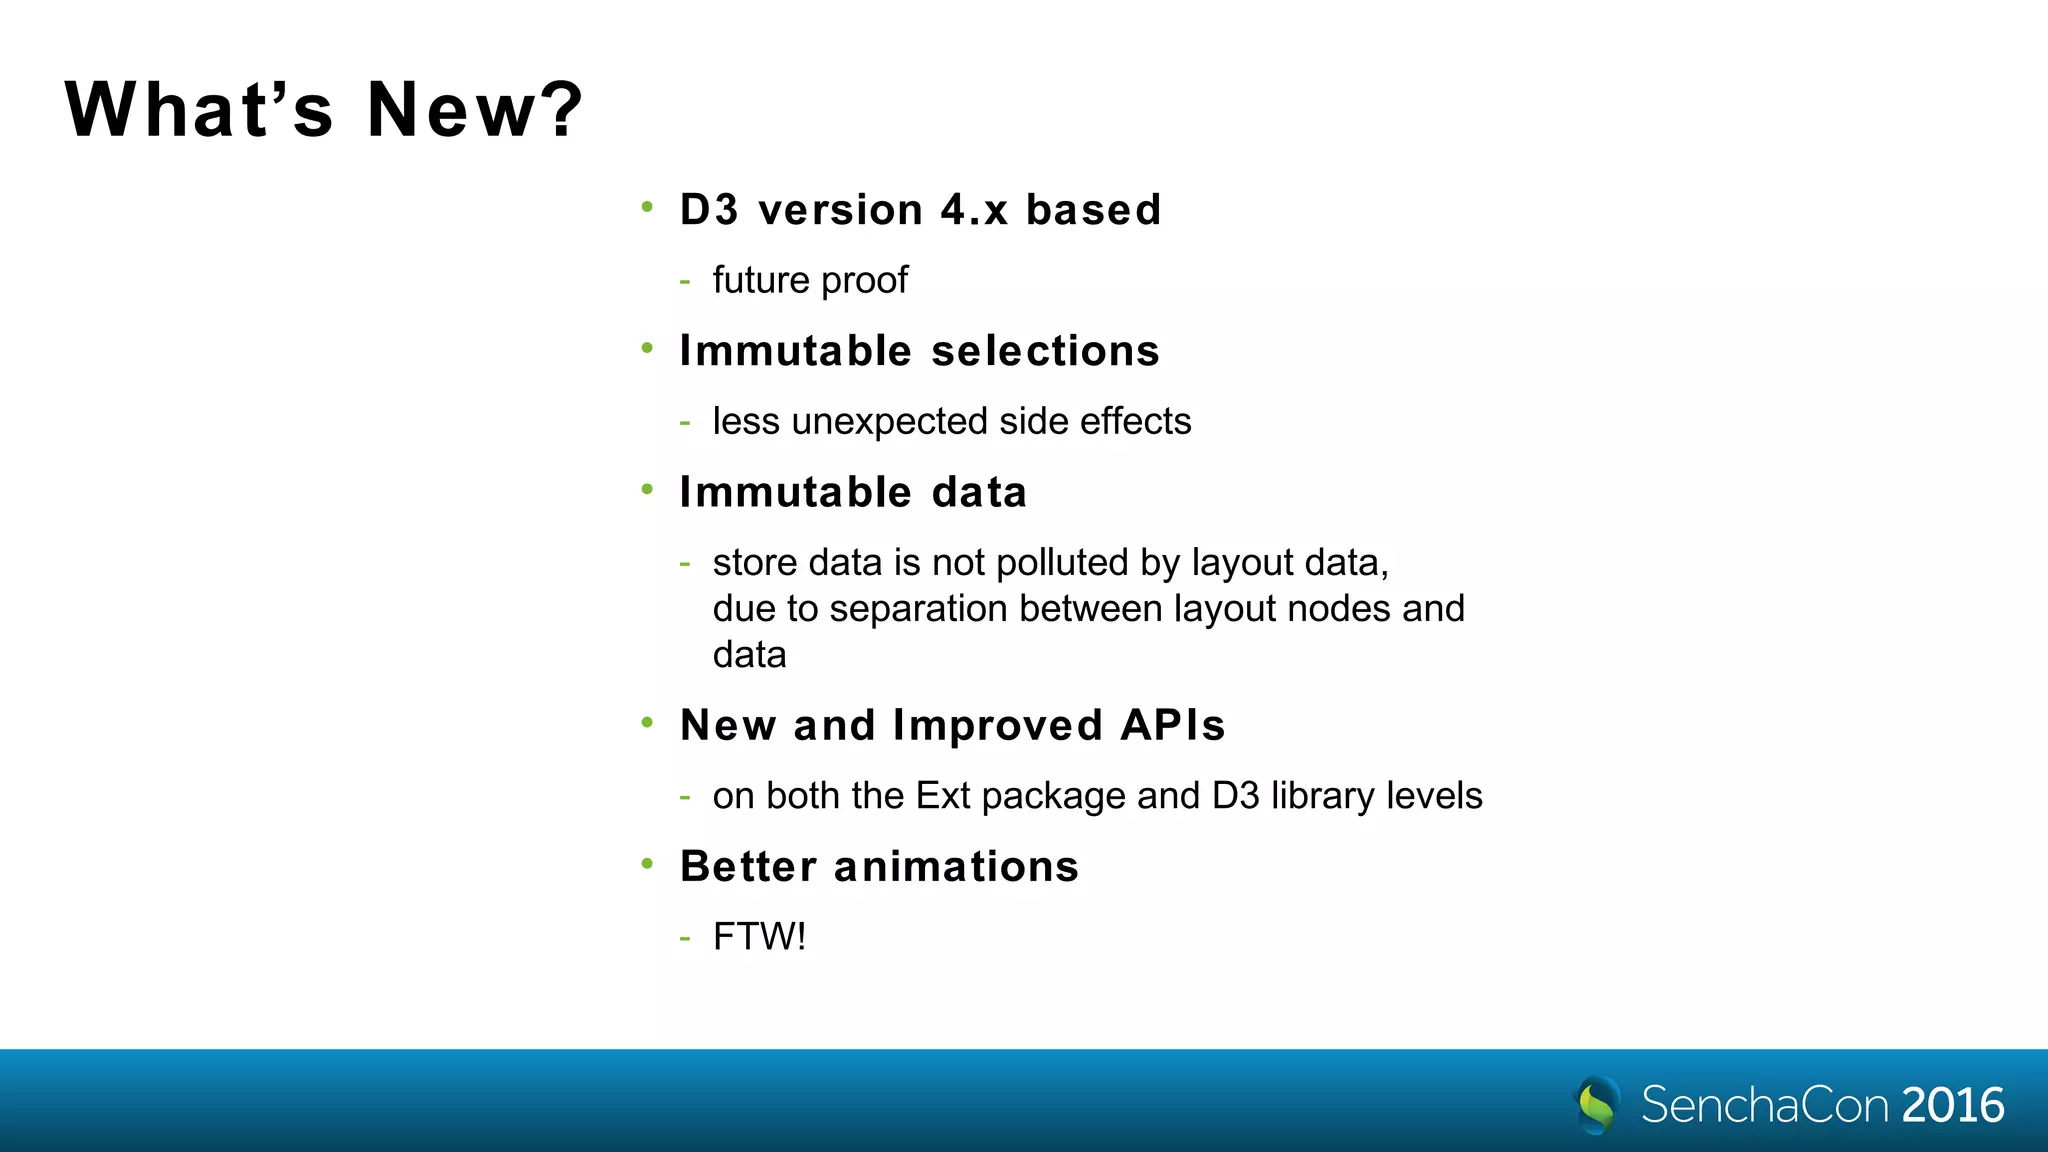
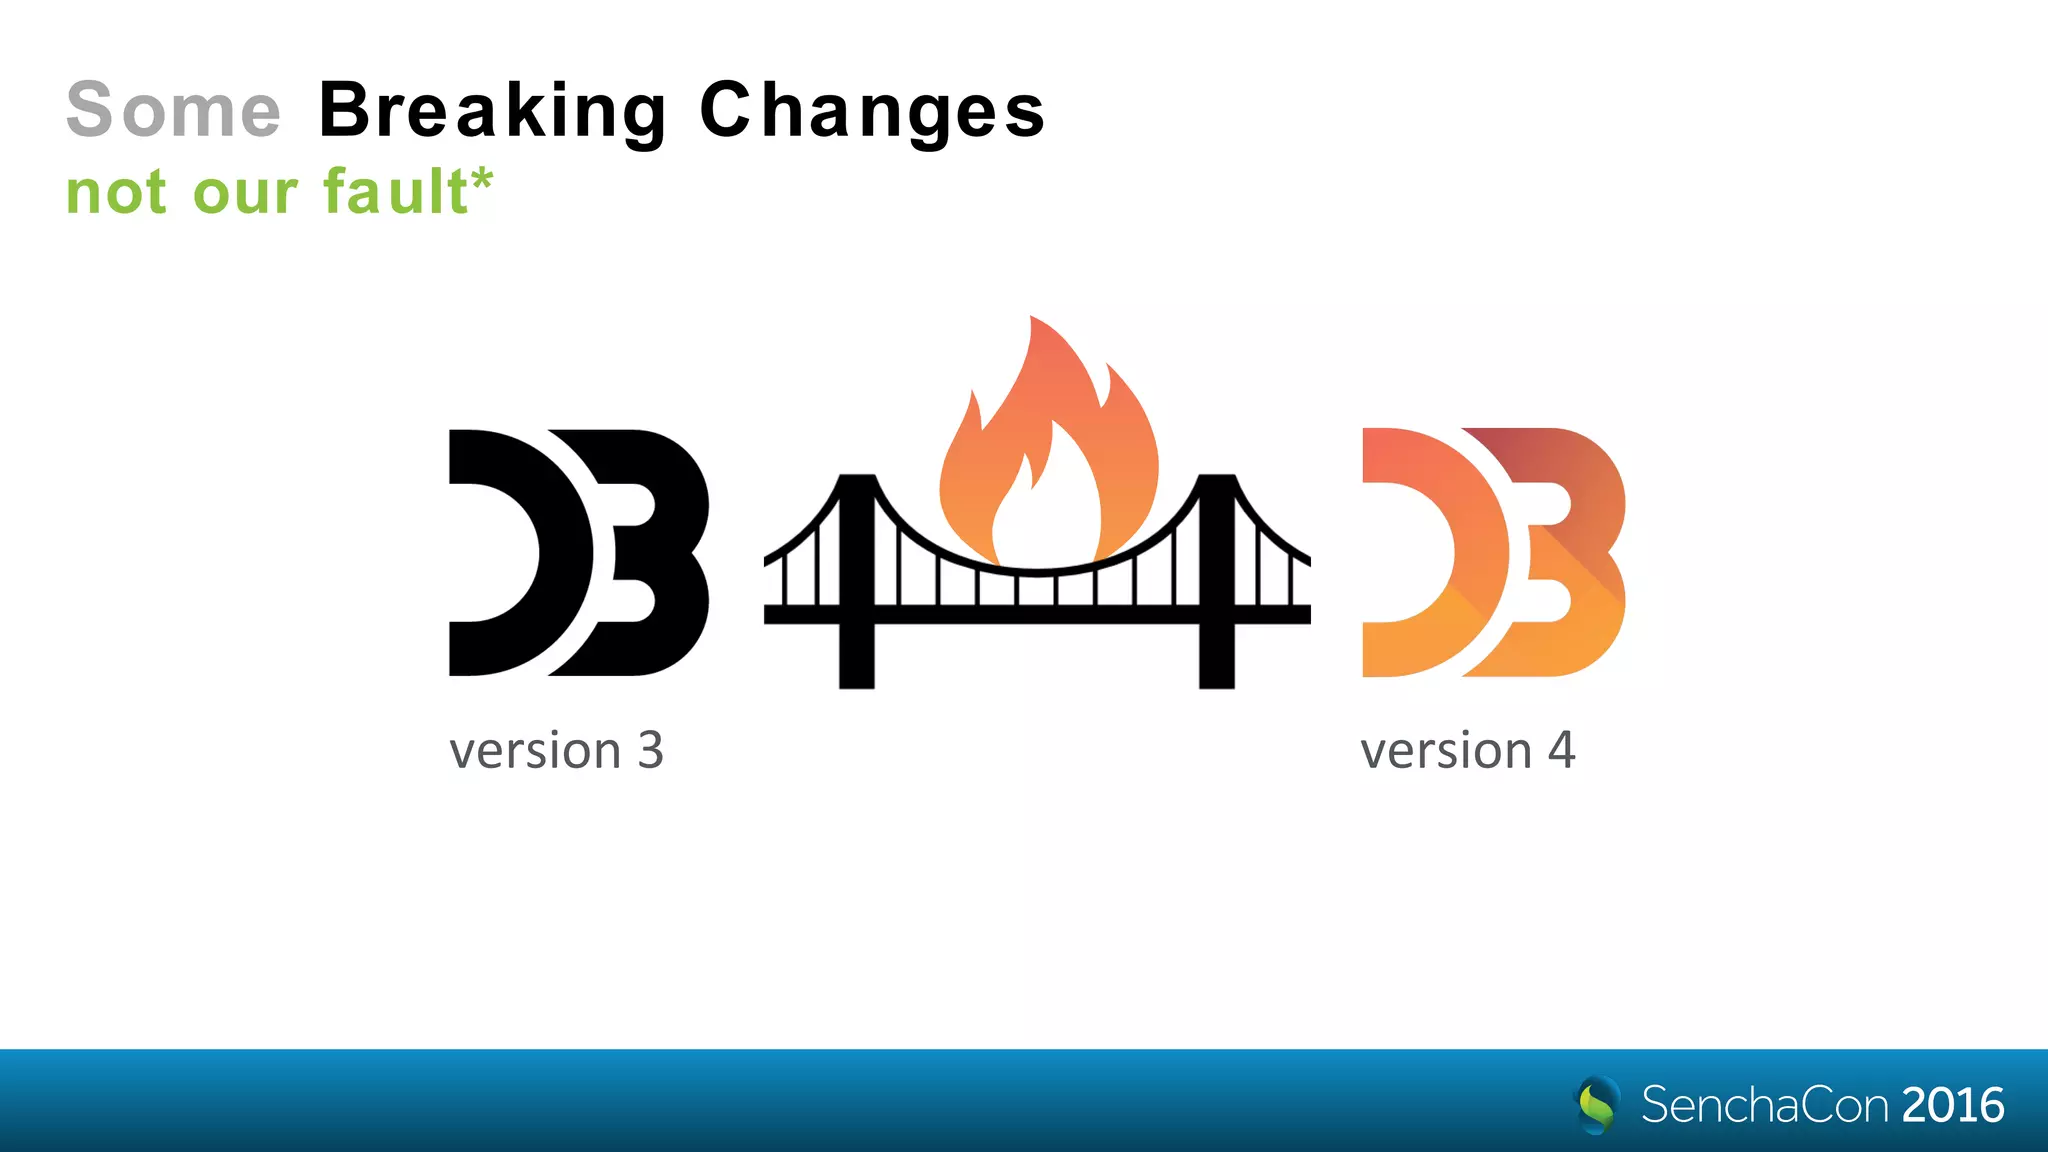
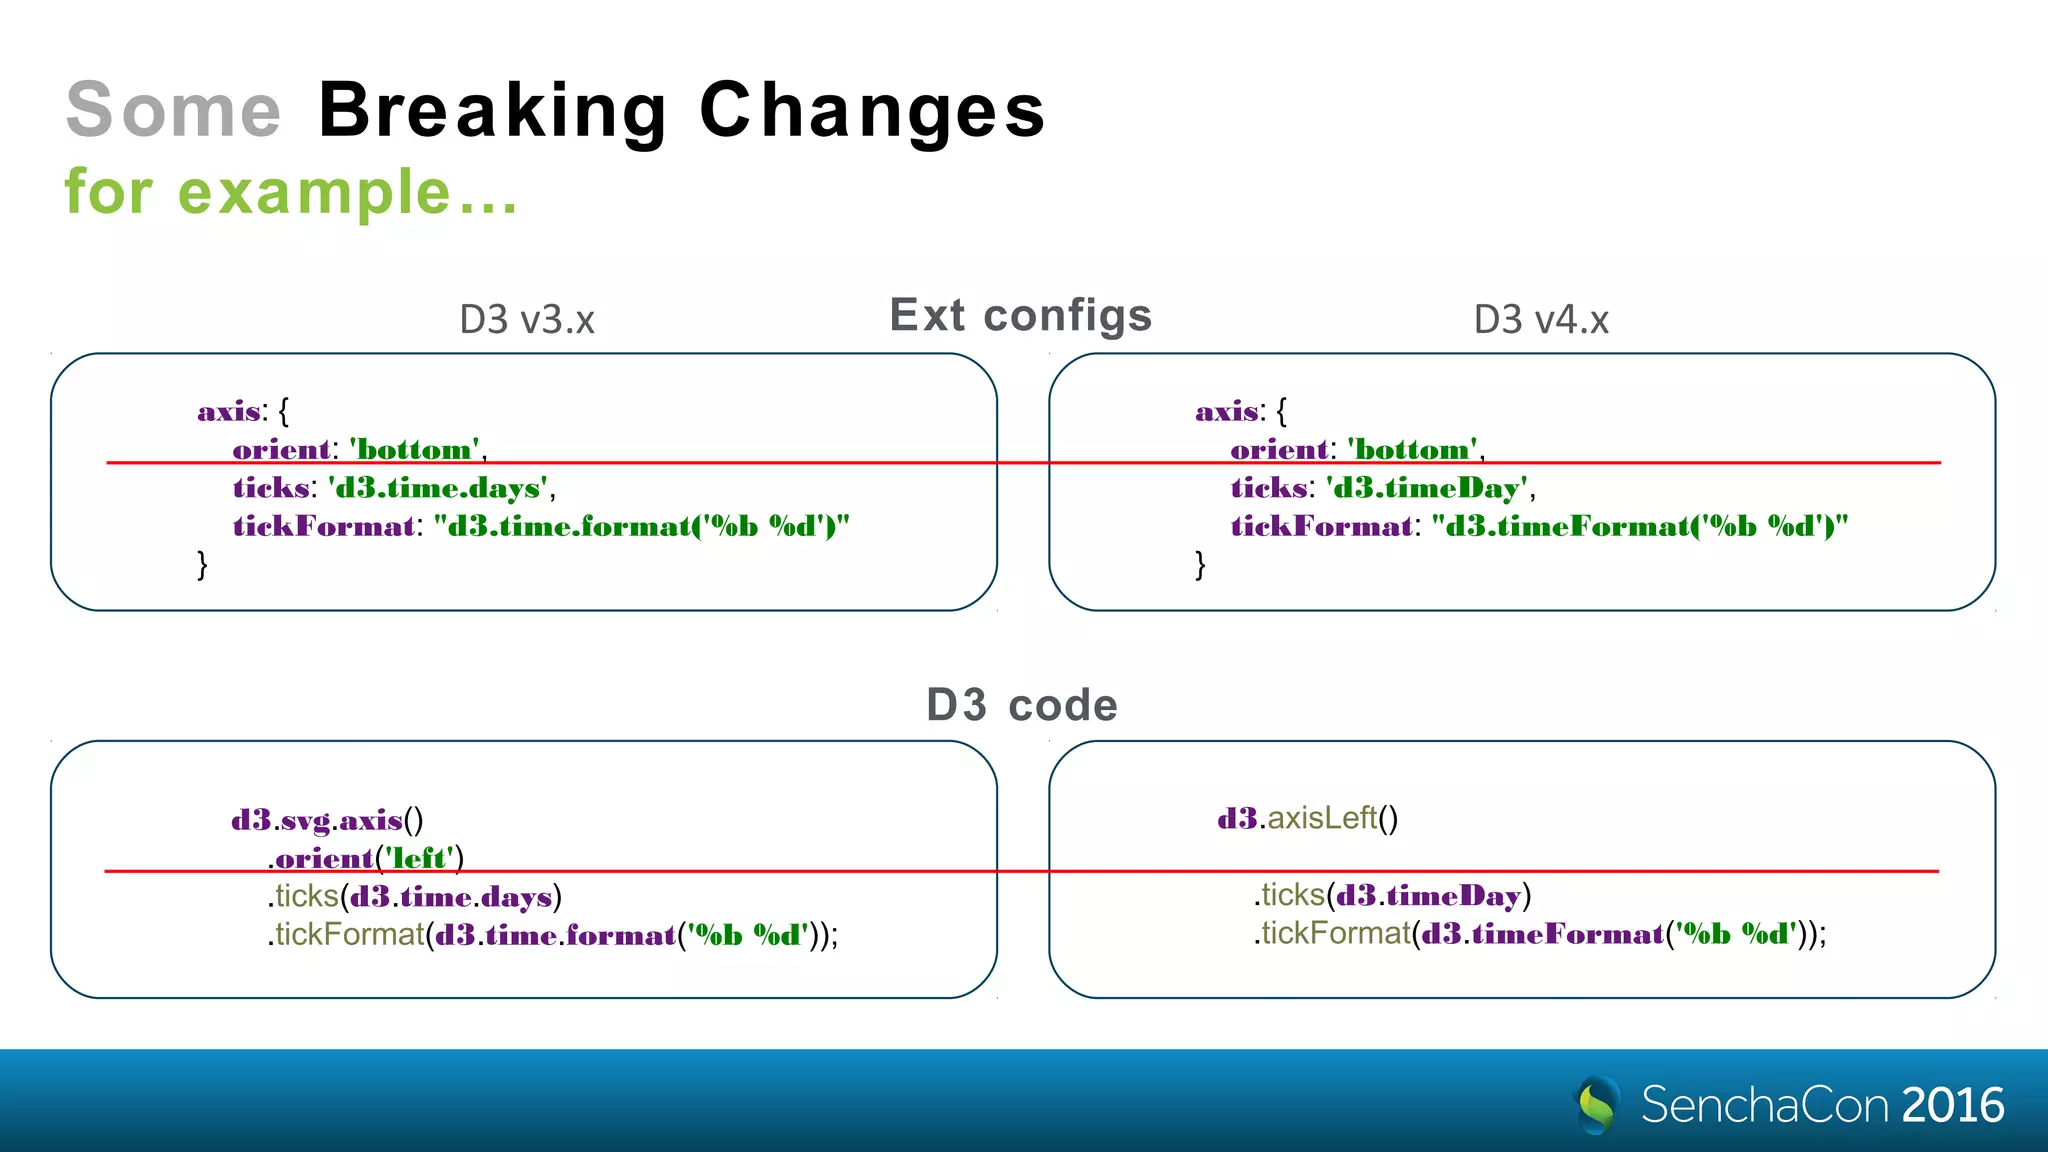


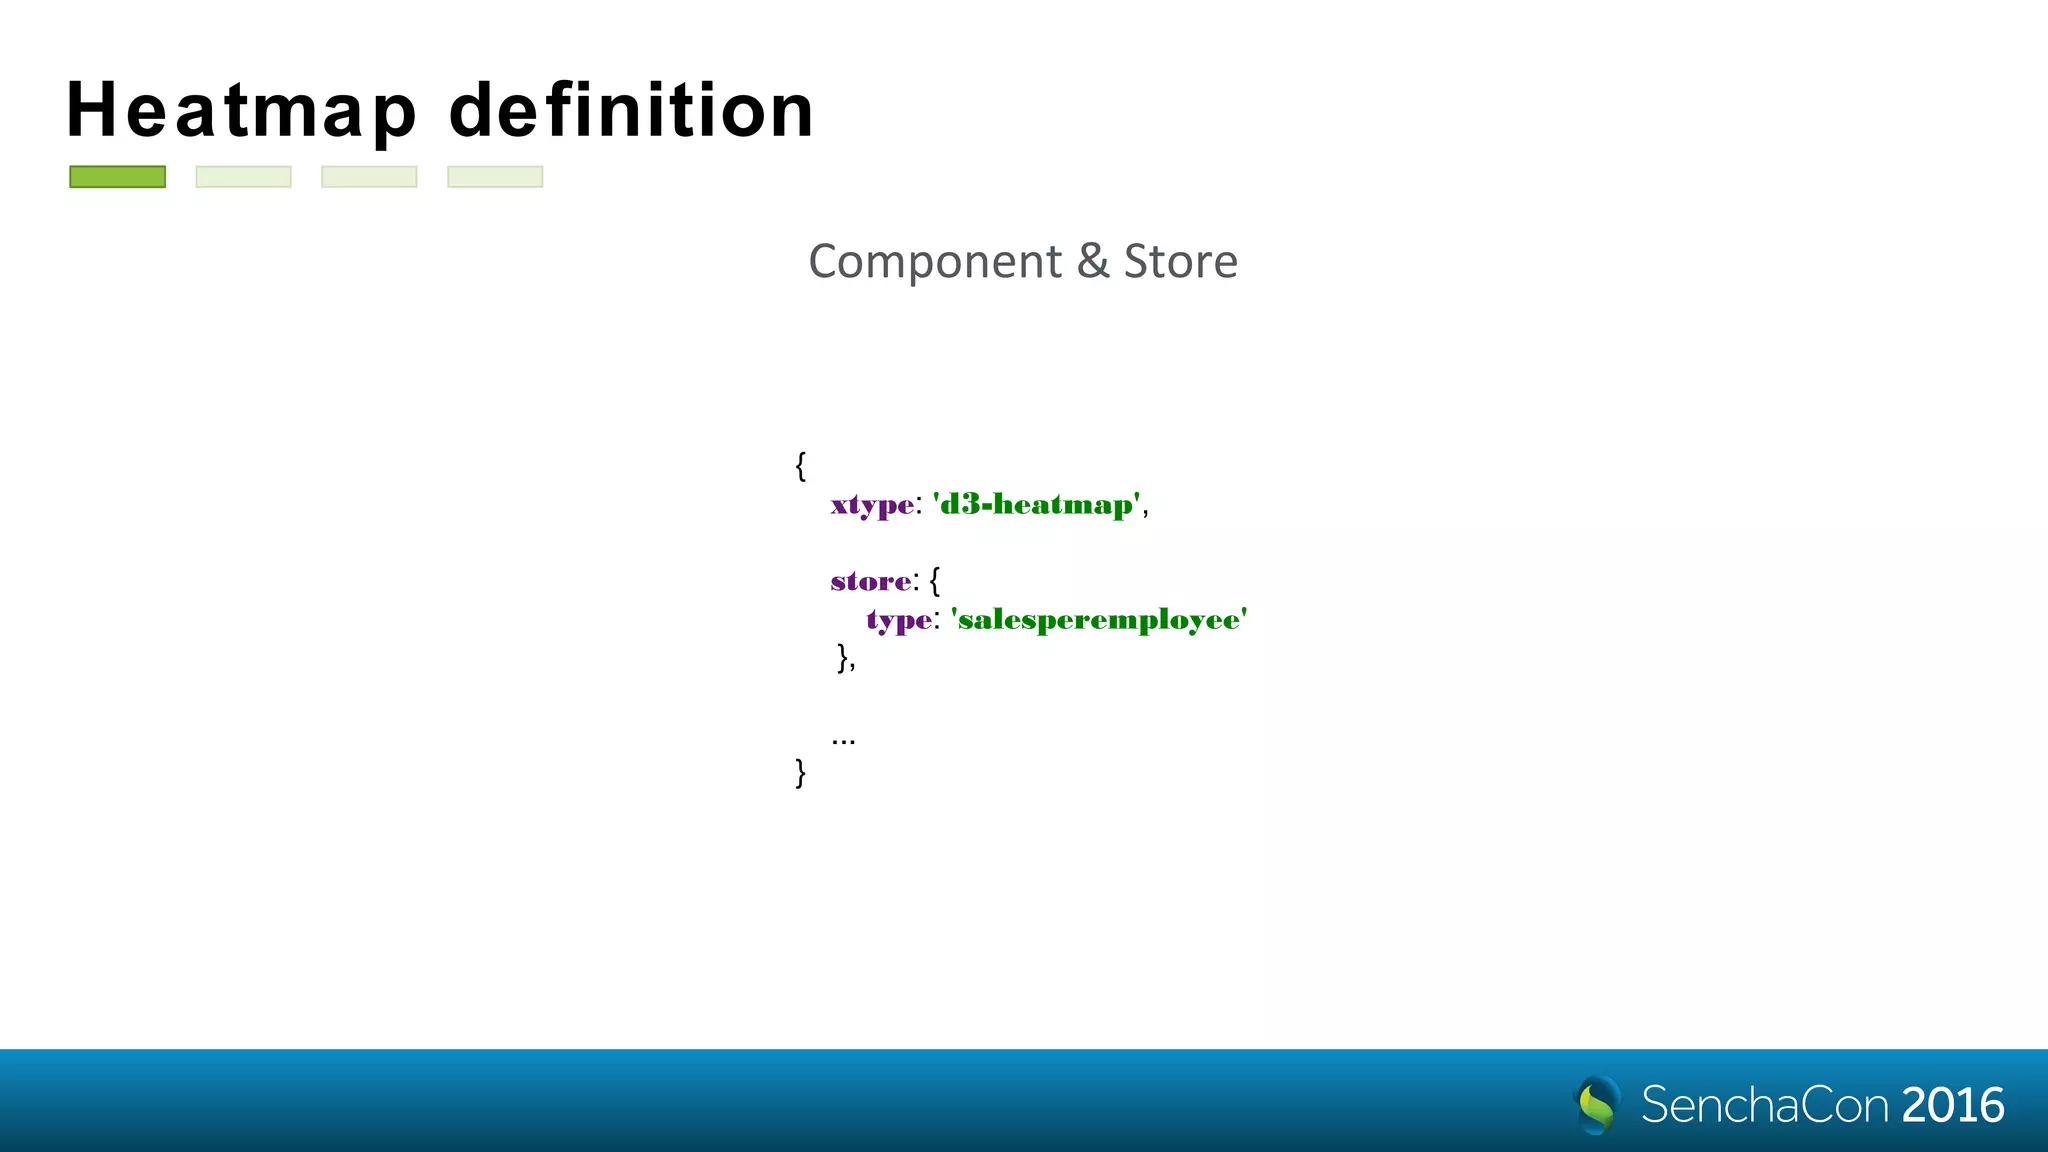
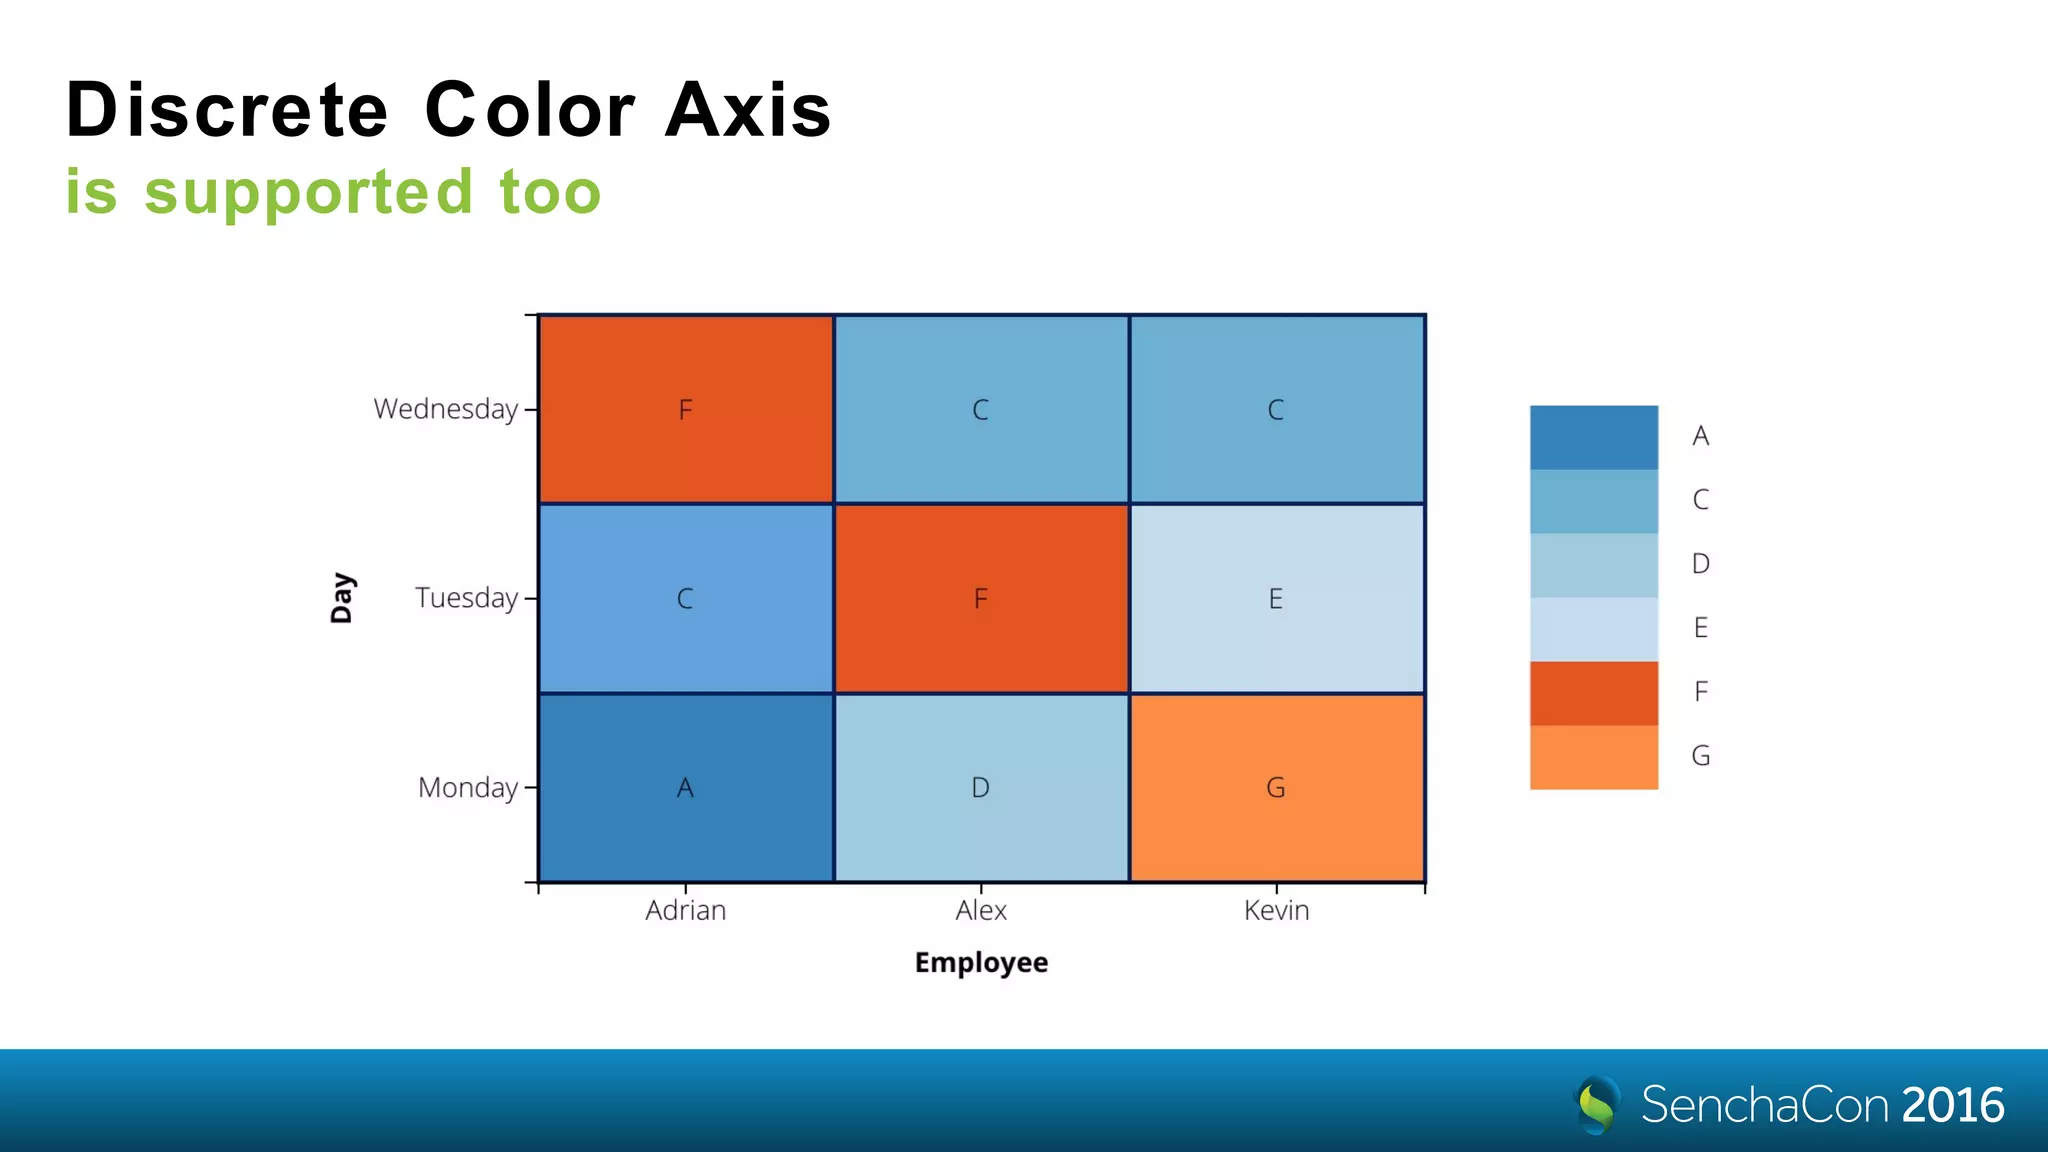
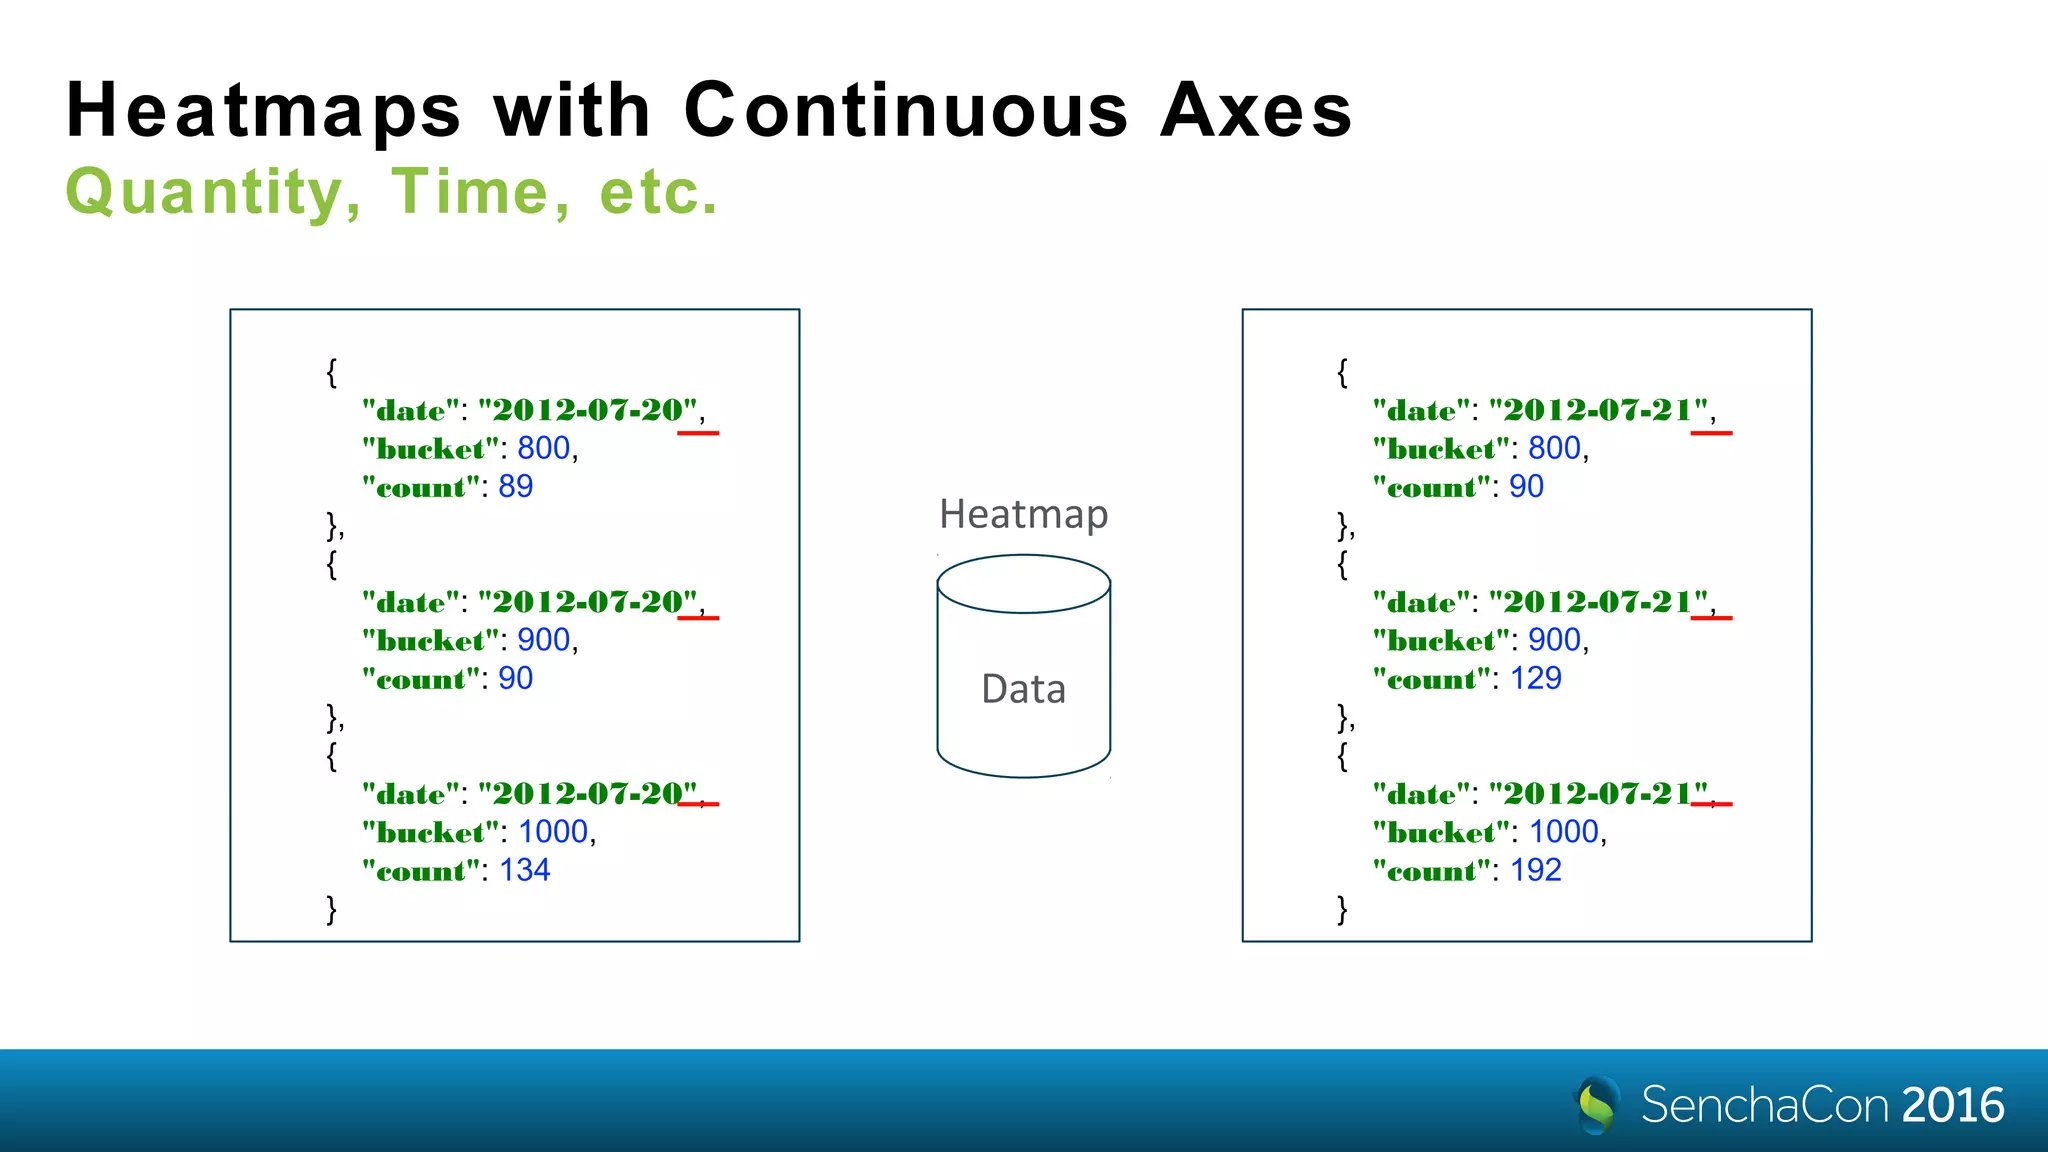
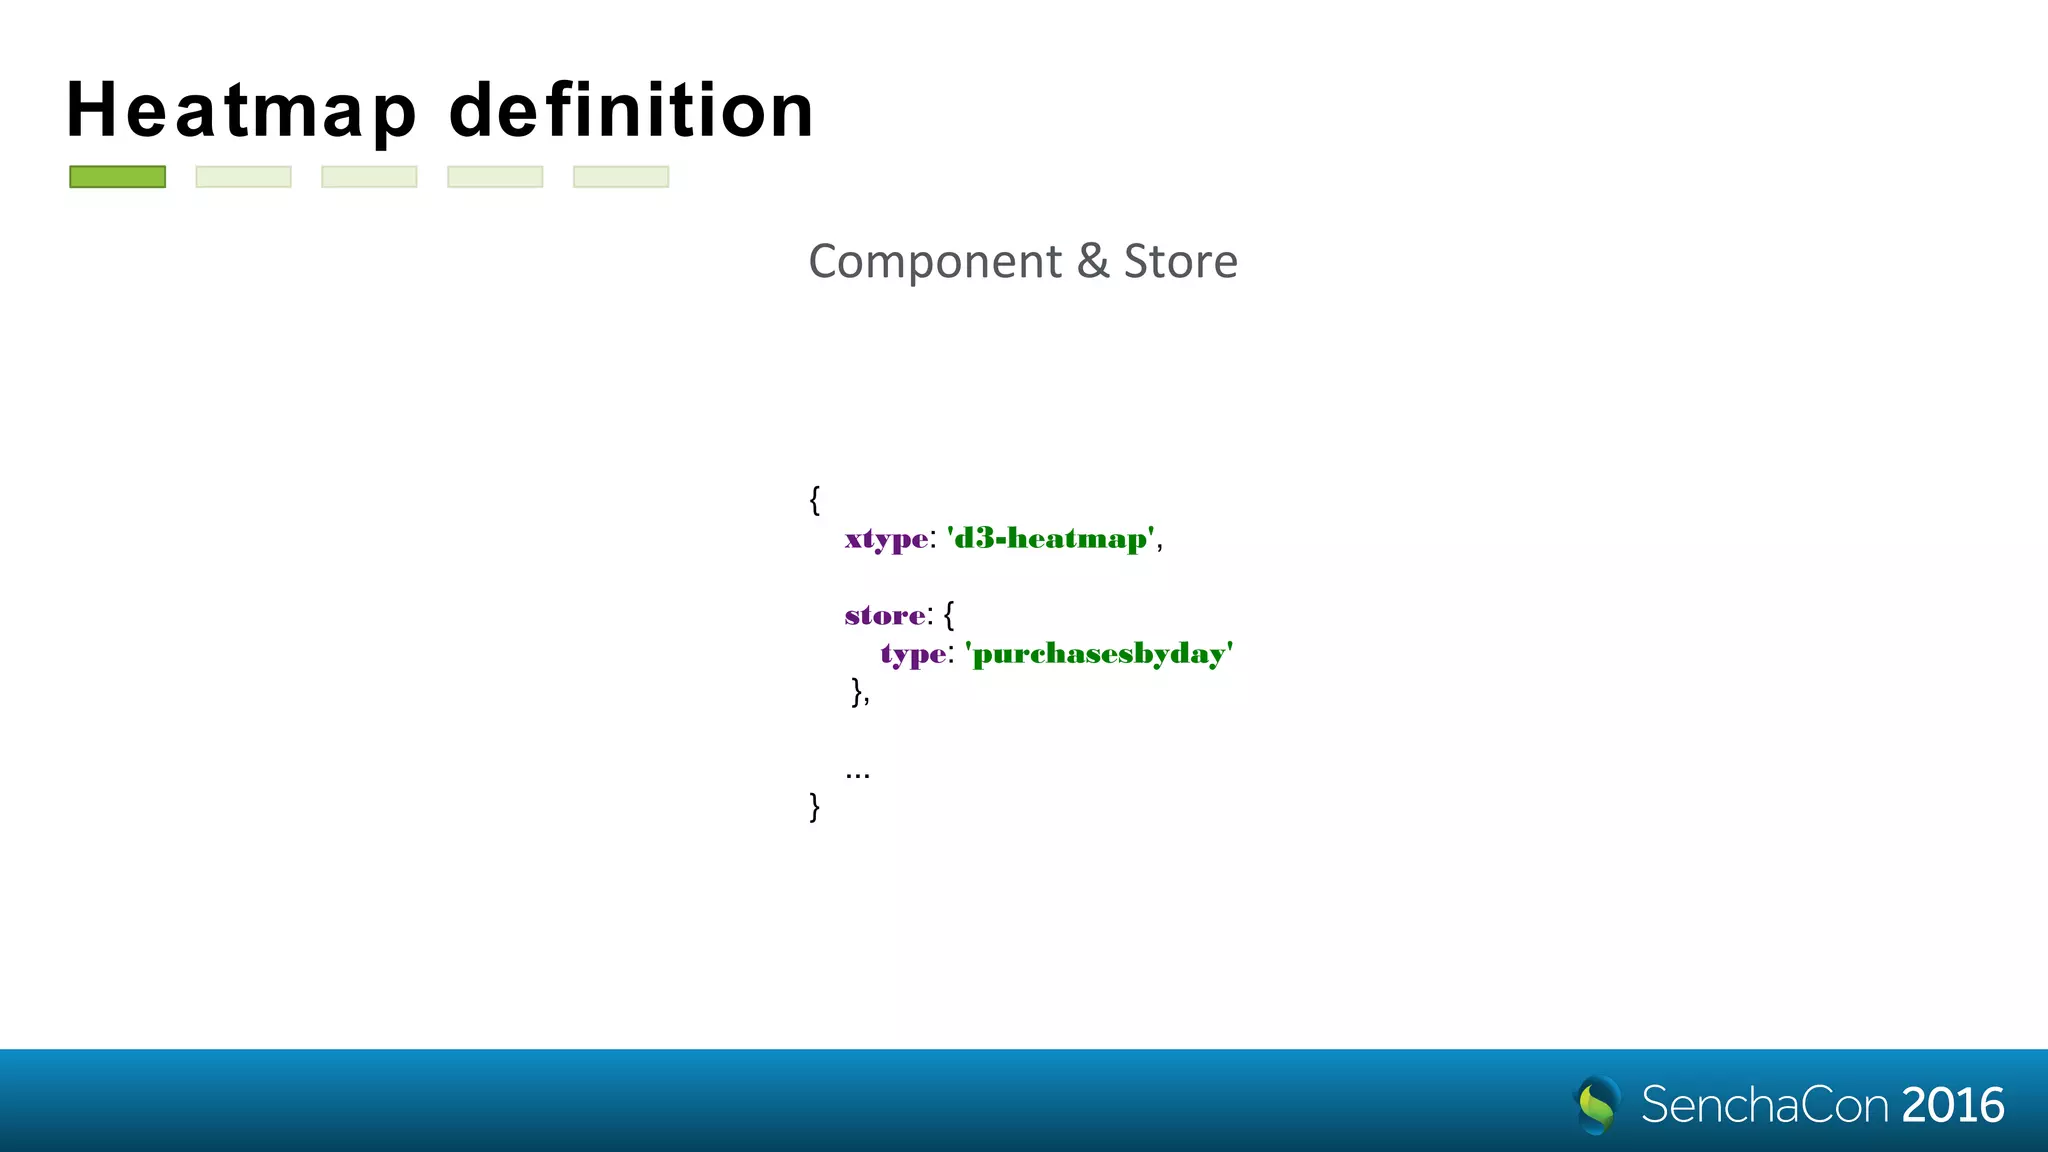
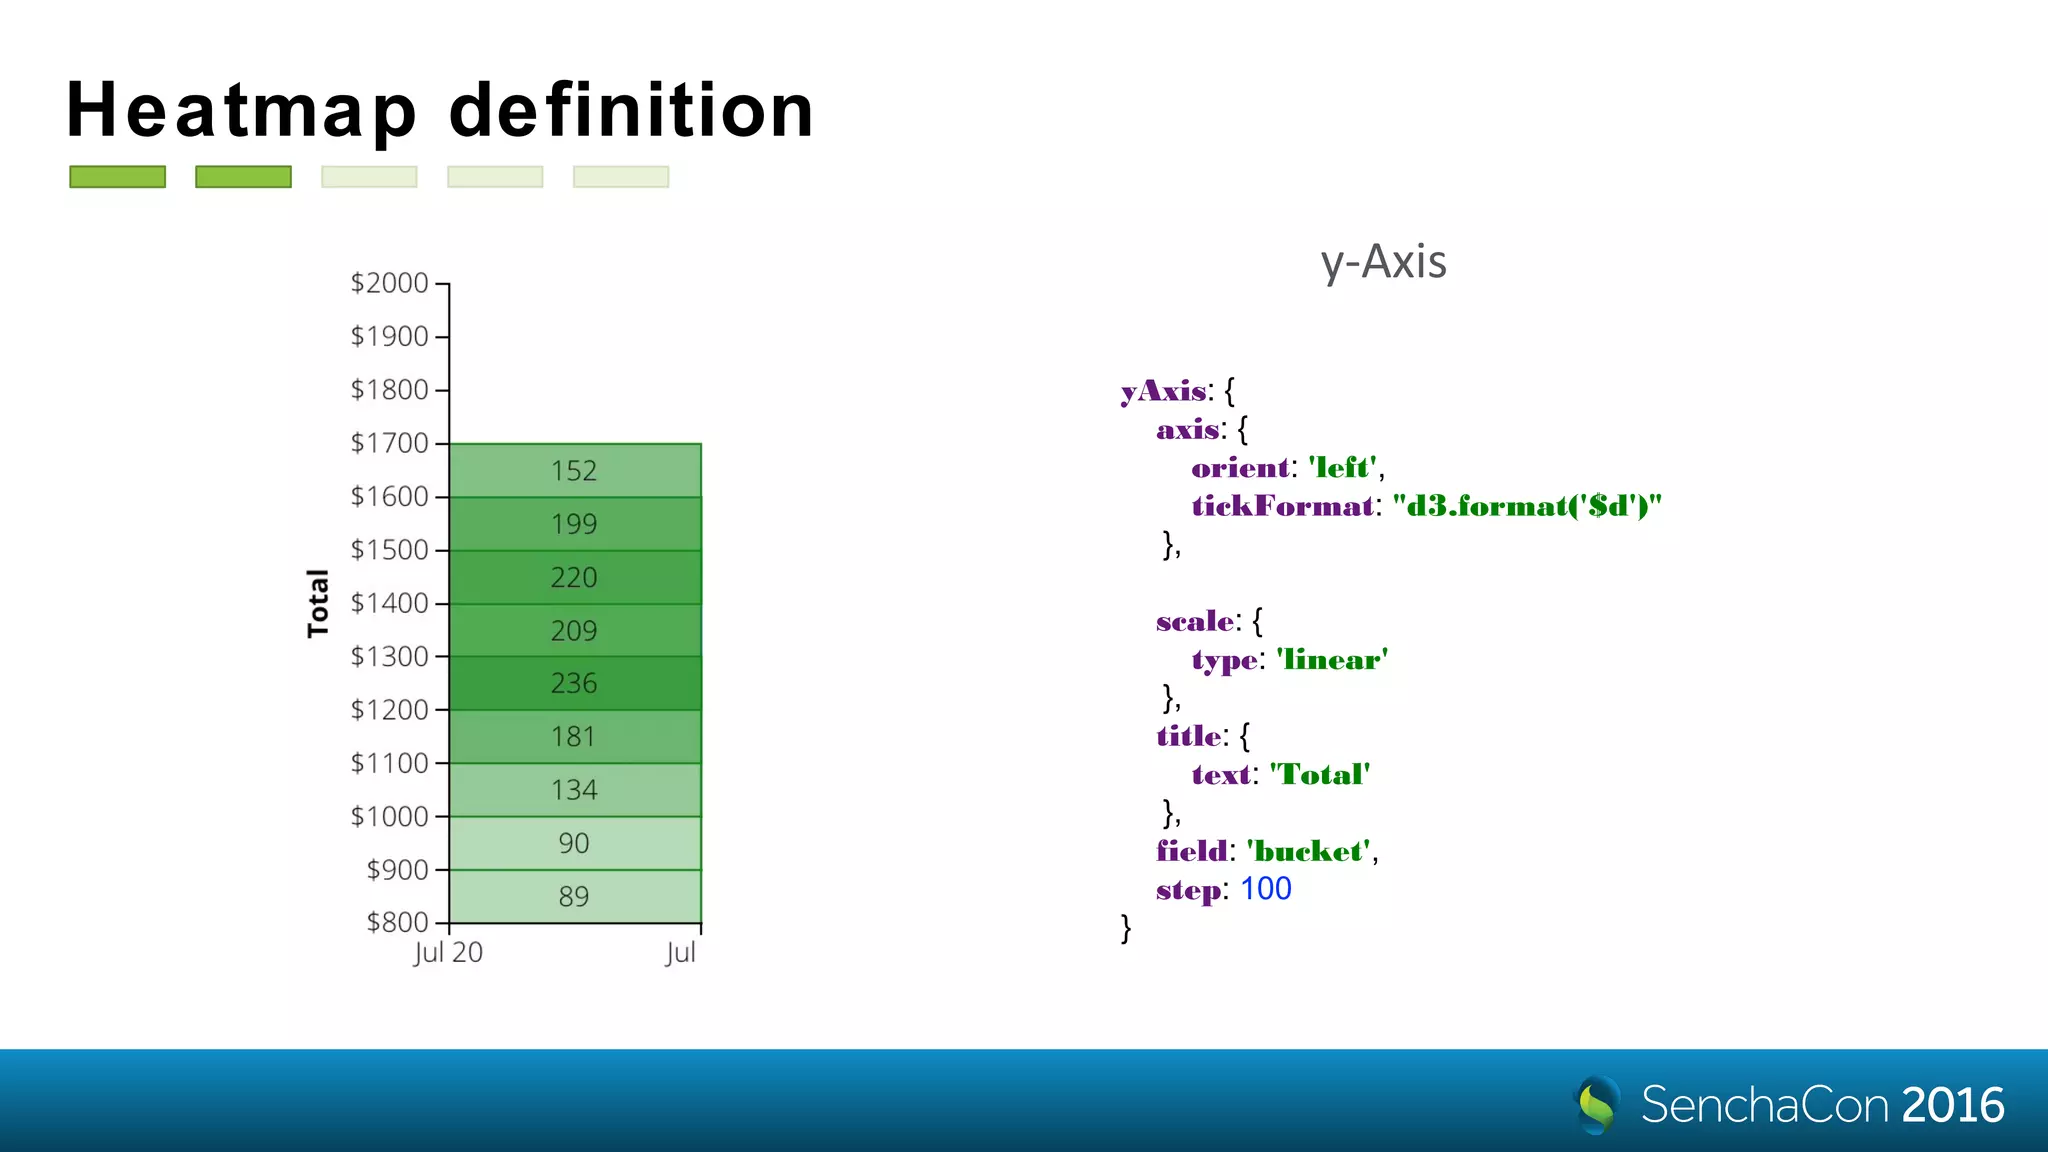
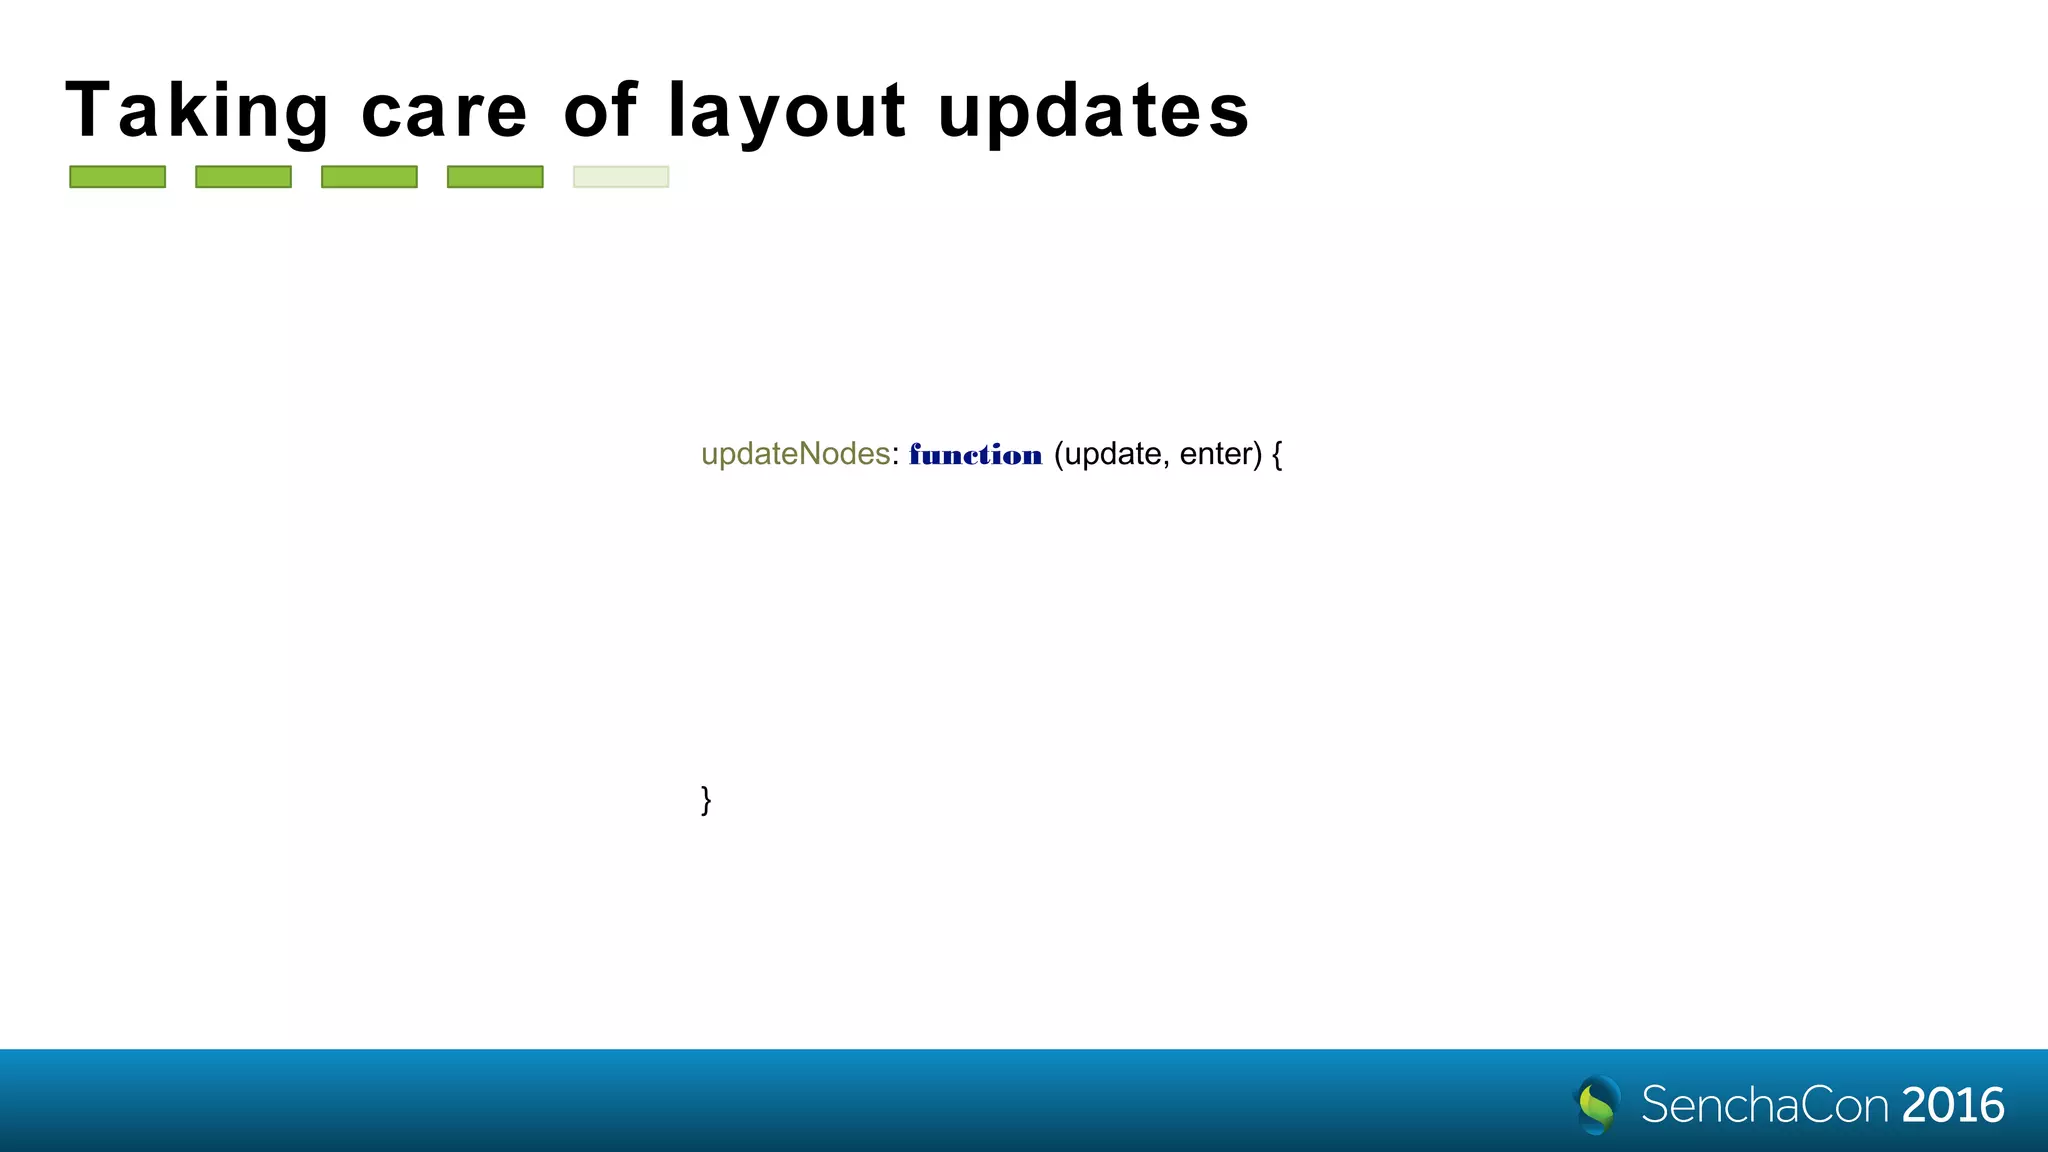
The document provides a guide on integrating D3 visualizations with Ext JS applications, outlining various components such as trees, treemaps, and heatmaps. It explains how to set up data bindings, customize visuals, and implement interactions while leveraging D3's strengths. Additionally, it addresses updates in D3 version 4.x and showcases live demo examples of the visualizations.


![Vibe Coding vs. Spec-Driven Development [Free Meetup]](https://cdn.slidesharecdn.com/ss_thumbnails/vibecodingvsspecdrivendevelopment-251209105622-43f455e7-thumbnail.jpg?width=640&height=640&fit=bounds)


