Downloaded 25 times


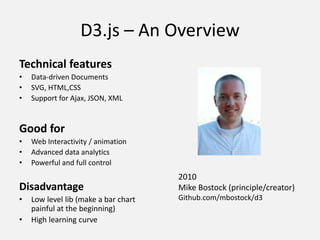
![D3 basic – Property as functions
d3.selectAll("p")
.data([4, 8, 15, 16, 23, 42])
.style("font-size", function(d) {
return d + "px";
});
Plug in Data](https://image.slidesharecdn.com/d3-140708145630-phpapp02/85/D3-8-320.jpg)
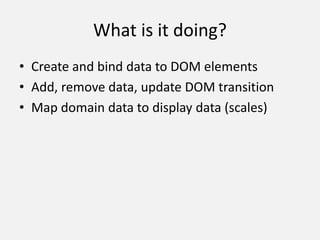
![D3 basic – Enter and Exit
var dataset = [5, 10, 20, 15, 18];
d3.select(“svg") .attr(‘id’,”abc”)
.selectAll(“circle”)
.data(dataset)
.enter()
.append(“circle”)](https://image.slidesharecdn.com/d3-140708145630-phpapp02/85/D3-9-320.jpg)
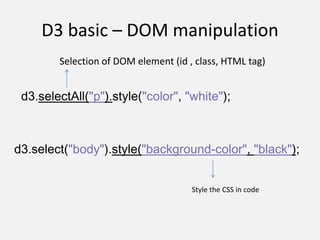
![D3 basic – Enter and Exit
var dataset = [5, 10, 20, 15, 18];
d3.select(“svg") .attr(‘id’,”abc”)
. selectAll(“circle”)
.data(dataset)
.enter()
.append(“circle”)
Empty Selection](https://image.slidesharecdn.com/d3-140708145630-phpapp02/85/D3-10-320.jpg)
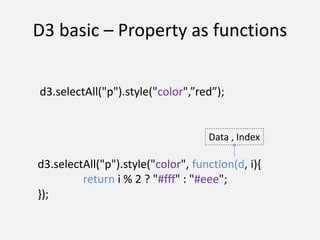
![D3 basic – Enter and Exit
var dataset = [5, 10, 20, 15, 18];
d3.select(“svg") .attr(‘id’,”abc”)
. selectAll(“circle”)
.data(dataset)
.enter()
.append(“circle”)](https://image.slidesharecdn.com/d3-140708145630-phpapp02/85/D3-11-320.jpg)
![D3 basic – Enter and Exit
var dataset = [5, 10, 20, 15, 18];
d3.select(“svg") .attr(‘id’,”abc”)
. selectAll(“circle”)
.data(dataset)
.enter()
.append(“circle”)](https://image.slidesharecdn.com/d3-140708145630-phpapp02/85/D3-12-320.jpg)
![D3 basic – Enter and Exit
var dataset = [5, 10, 20, 15, 18];
d3.select(“svg") .attr(‘id’,”abc”)
. selectAll(“circle”)
.data(dataset)
.enter()
.append(“circle”)](https://image.slidesharecdn.com/d3-140708145630-phpapp02/85/D3-13-320.jpg)
![D3 basic - Attributes
d3. selectAll(“circle”)
.attr(‘cy’, 60)
.attr(‘cx’, function(d, i){ return i * 100 + 30; })
.attr(‘r’, function(d){ return Math.sqrt(r); })
svg.selectAll("circle") .data([32, 57, 112, 293]);](https://image.slidesharecdn.com/d3-140708145630-phpapp02/85/D3-14-320.jpg)
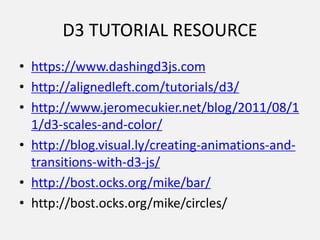
![D3.js – scale (Domain and Range)
var data = [4, 8, 15, 16, 23, 42];
var x = d3.scale.linear()
.domain([0,d3.max(data)])
.range([0, 420]);
Value range of the dataset
Value range for the visualized graph
d3.select(".chart") .data(data)
.enter().append("div")
.style("width", function(d) { return x(d) + "px"; })
.text(function(d) { return d; });](https://image.slidesharecdn.com/d3-140708145630-phpapp02/85/D3-17-320.jpg)


This document provides an overview of D3.js, an open-source JavaScript library for producing dynamic, interactive data visualizations in web browsers. It discusses D3.js's technical features like using SVG, HTML, and CSS, its support for Ajax, JSON, and XML, and how it is useful for web interactivity, advanced data analytics, and allowing powerful and full control. The document also briefly touches on D3.js's learning curve and provides examples of basic DOM manipulation, properties as functions, entering and exiting data, attributes, transitions, and interactions using D3.js.