Download to read offline
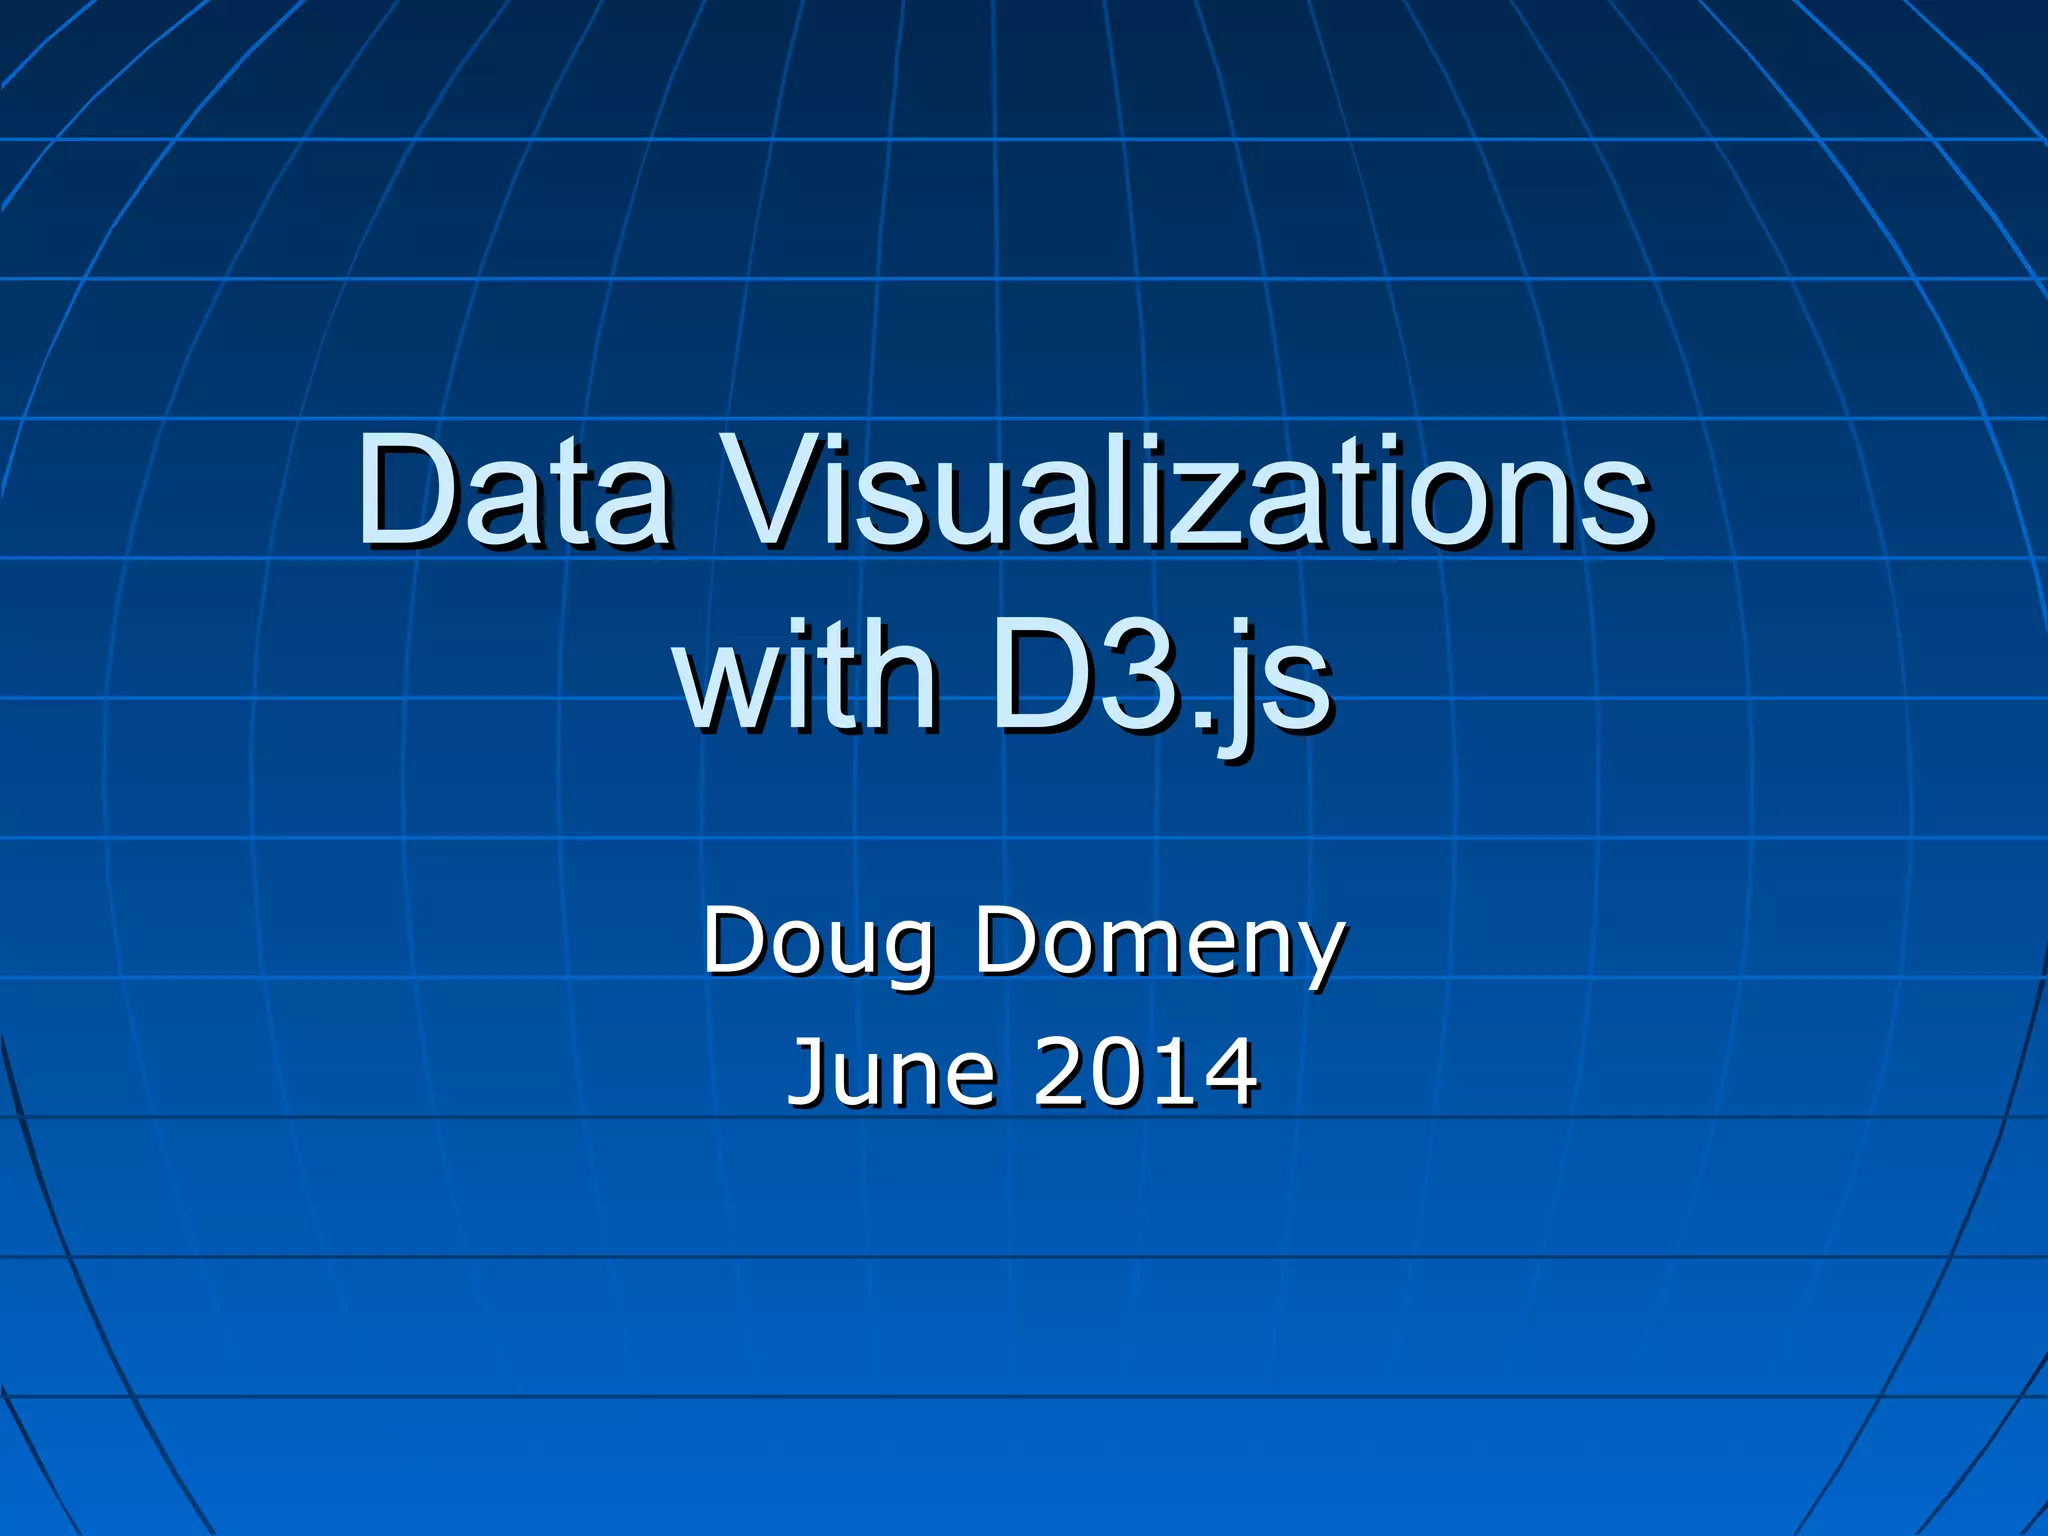
![Data-Driven DocumentsData-Driven Documents
JavaScript + HTML + SVG + CSSJavaScript + HTML + SVG + CSS
Bind arbitrary data to a Document ObjectBind arbitrary data to a Document Object
Model (DOM)Model (DOM)
Similar to jQuery & PrototypeSimilar to jQuery & Prototype
• SelectionsSelections
• Dynamic PropertiesDynamic Properties
• Function ChainingFunction Chaining
d3.selectAll("p")
.data([4, 8, 15, 16, 23, 42])
.style("font-size", function(d)
{ return d + "px"; });](https://image.slidesharecdn.com/12b17704-040d-468e-9714-1549f54b6c60-170107184304/85/Data-Visualizations-with-D3-2-320.jpg)
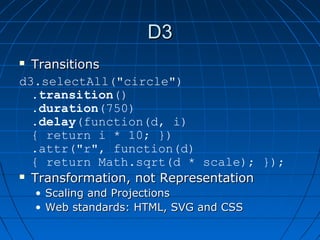
![DOM ManipulationDOM Manipulation
enterenter: create new nodes for incoming data: create new nodes for incoming data
exit:exit: remove outgoing nodes that are no longerremove outgoing nodes that are no longer
needed.needed.
Common PatternCommon Pattern
// Update…
var p = d3.select("body").selectAll("p")
.data([4, 8, 15, 16, 23, 42])
.text(String);
// Enter…
p.enter().append("p").text(String);
// Exit…
p.exit().remove();](https://image.slidesharecdn.com/12b17704-040d-468e-9714-1549f54b6c60-170107184304/85/Data-Visualizations-with-D3-5-320.jpg)
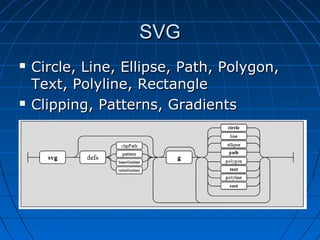
![d3.geod3.geo
var projection = d3.geo.robinson()
.scale(200) // 150 = normal, 200 = zoom
.translate([1256/2, 480/2 + 40]) // +40=bias north
.rotate([71.4553, 0])
.precision(0.5);
var path = d3.geo.path().projection(projection);
var arc = d3.geo.greatArc()
.source(function (d) { return d.client_loc; })
.target(function (d) { return d.server_loc; });
var svg = d3.select("#main").append("svg")
.attr("width", 1256)
.attr("height", 480);
var container = svg.append("g").attr("id", "container");
var arcs = container.append("g").attr("id", "arcs");
arcs.selectAll("path.arc")
.data(conns).enter()
.append("path")
.attr("class", "arc")
.attr("d", function (d) { return path(arc(d)); });](https://image.slidesharecdn.com/12b17704-040d-468e-9714-1549f54b6c60-170107184304/85/Data-Visualizations-with-D3-15-320.jpg)
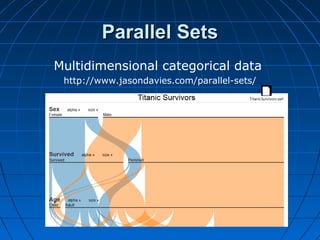

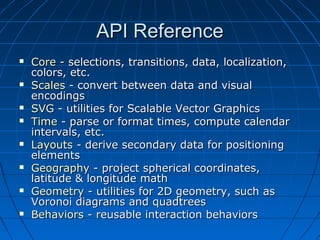
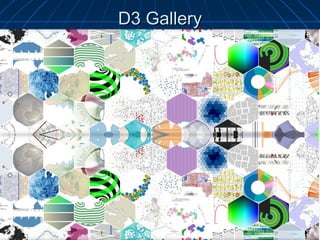
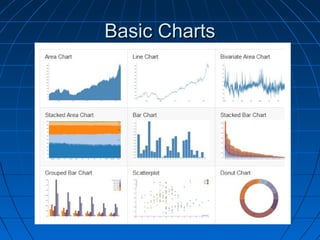
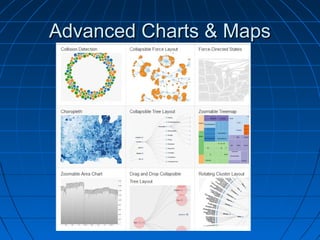
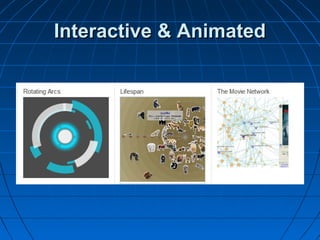
This document provides an overview of D3.js, a JavaScript library for visualizing data using HTML, SVG, and CSS. It discusses how D3 allows binding arbitrary data to documents, uses common jQuery patterns for selections and properties. It also covers D3 features like transitions, scales and projections, SVG shapes, DOM manipulation, and APIs for loading external data. Examples of basic and advanced charts, maps, and interactive visualizations created with D3 are also referenced.