Download as PDF, PPTX


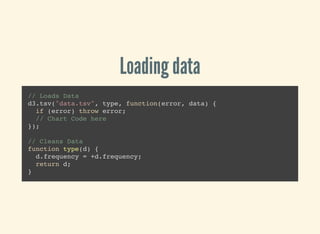
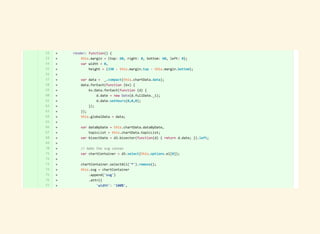
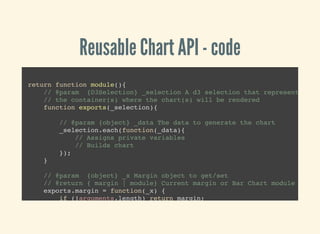
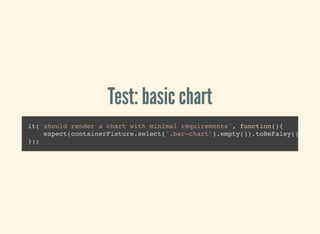
![Setting up scales and axes
var x = d3.scale.ordinal()
.rangeRoundBands([0, width], .1);
var y = d3.scale.linear()
.range([height, 0]);
var xAxis = d3.svg.axis()
.scale(x)
.orient("bottom");
var yAxis = d3.svg.axis()
.scale(y)
.orient("left")
.ticks(10, "%");
Reference: Scales tutorial](https://image.slidesharecdn.com/betterd3chartswithtdd-160804050906/85/Better-d3-charts-with-tdd-35-320.jpg)
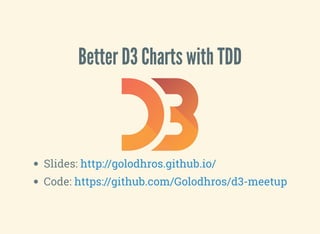
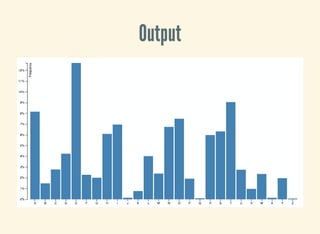
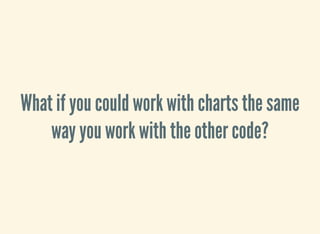
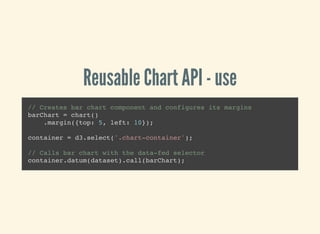
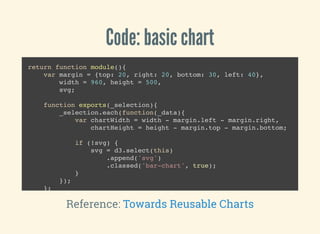
![Drawing axes
// Rest of the scales
x.domain(data.map(function(d) { return d.letter; }));
y.domain([0, d3.max(data, function(d) { return d.frequency; })]);
// Draws X axis
svg.append("g")
.attr("class", "x axis")
.attr("transform", "translate(0," + height + ")")
.call(xAxis);
// Draws Y axis
svg.append("g")
.attr("class", "y axis")
.call(yAxis)
.append("text")
.attr("transform", "rotate(-90)")
.attr("y", 6)
.attr("dy", ".71em")](https://image.slidesharecdn.com/betterd3chartswithtdd-160804050906/85/Better-d3-charts-with-tdd-37-320.jpg)

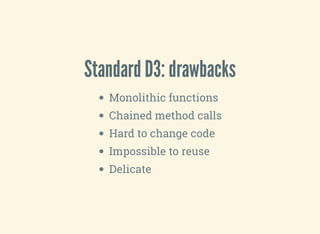


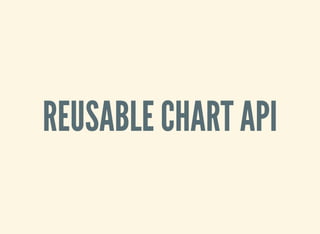

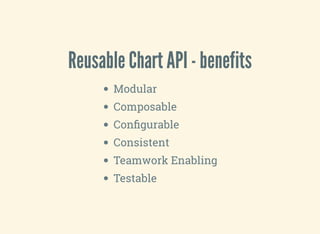
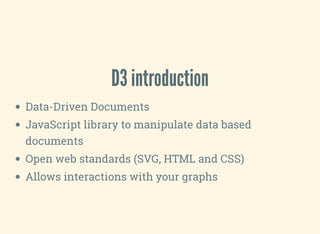
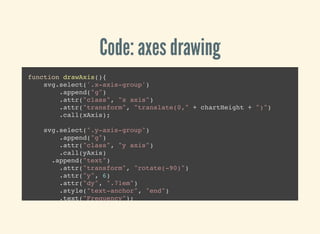
![The "before" block
container = d3.select('.test-container');
dataset = [
{ letter: 'A',
frequency: .08167
},{
letter: 'B',
frequency: .01492
},...
];
barChart = barChart();
container.datum(dataset).call(barChart);](https://image.slidesharecdn.com/betterd3chartswithtdd-160804050906/85/Better-d3-charts-with-tdd-71-320.jpg)


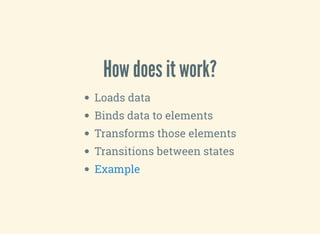
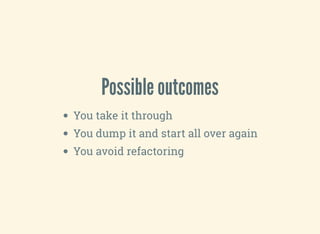
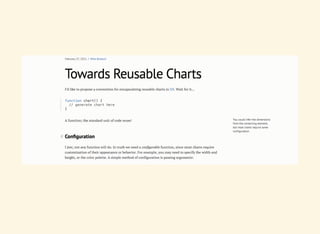
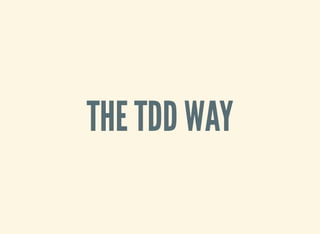
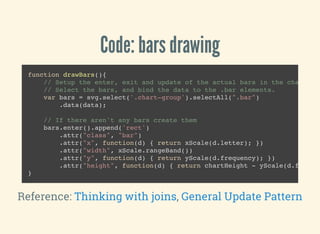
![Code: scales
function buildScales(){
xScale = d3.scale.ordinal()
.domain(data.map(function(d) { return d.letter; }))
.rangeRoundBands([0, chartWidth], .1);
yScale = d3.scale.linear()
.domain([0, d3.max(data, function(d) { return d.frequency; })])
.range([chartHeight, 0]);
}](https://image.slidesharecdn.com/betterd3chartswithtdd-160804050906/85/Better-d3-charts-with-tdd-77-320.jpg)


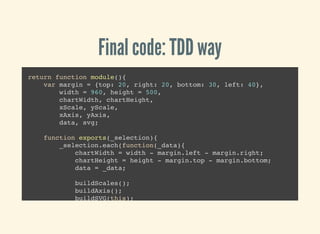
![Final code: standard way
var margin = {top: 20, right: 20, bottom: 30, left: 40},
width = 960 - margin.left - margin.right,
height = 500 - margin.top - margin.bottom;
var x = d3.scale.ordinal()
.rangeRoundBands([0, width], .1);
var y = d3.scale.linear()
.range([height, 0]);
var xAxis = d3.svg.axis()
.scale(x)
.orient("bottom");
var yAxis = d3.svg.axis()
.scale(y)
.orient("left")
.ticks(10, "%");](https://image.slidesharecdn.com/betterd3chartswithtdd-160804050906/85/Better-d3-charts-with-tdd-85-320.jpg)


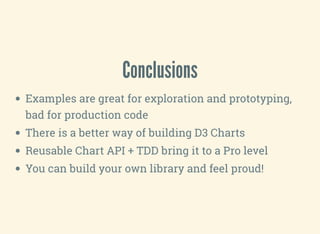


The presentation covers creating enhanced D3.js charts using a Test-Driven Development (TDD) approach, emphasizing the flexibility and modularity of a reusable chart API. It outlines workflows for adapting code, best practices for building charts, and showcases various chart types and implementations. The final takeaway highlights the benefits of TDD and the reusable chart API for producing high-quality, production-ready visualizations.